

Just-in-Time Inspect Guide
Just-in-Time Inspect Guide
Just-in-time inspection captures module hierarchy and input/output signatures during real model execution, without tuning or compilation. Use it to understand what JIT tuning would see before you commit to a tuning strategy.
Overview
Just-in-time inspection provides:
- Module Discovery: Capture modules that execute at runtime
- Hierarchy View: See parent/child relationships and depth
- Input/Output Signatures: Record tensor shapes, dtypes, and argument structure
- HTML Report: Generate a shareable inspection report
Quick Start
Enable inspection
Add a single import at the top of your script to enable inspection mode:
Run a real workload and save a report
The example below mirrors the Stable Diffusion inspection workflow used in
tests/functional/pytorch/jit/006_jit_sd15_inspect.py:
Open the report
What the report shows
- Module summary: Total modules and basic statistics
- Module hierarchy: Tree view of the executed module structure
- Module details: Name, type, depth, parameter counts, call counts, execution times
- Inputs/outputs: Shapes, dtypes, and detected batch axes for each executed module
Example screenshots
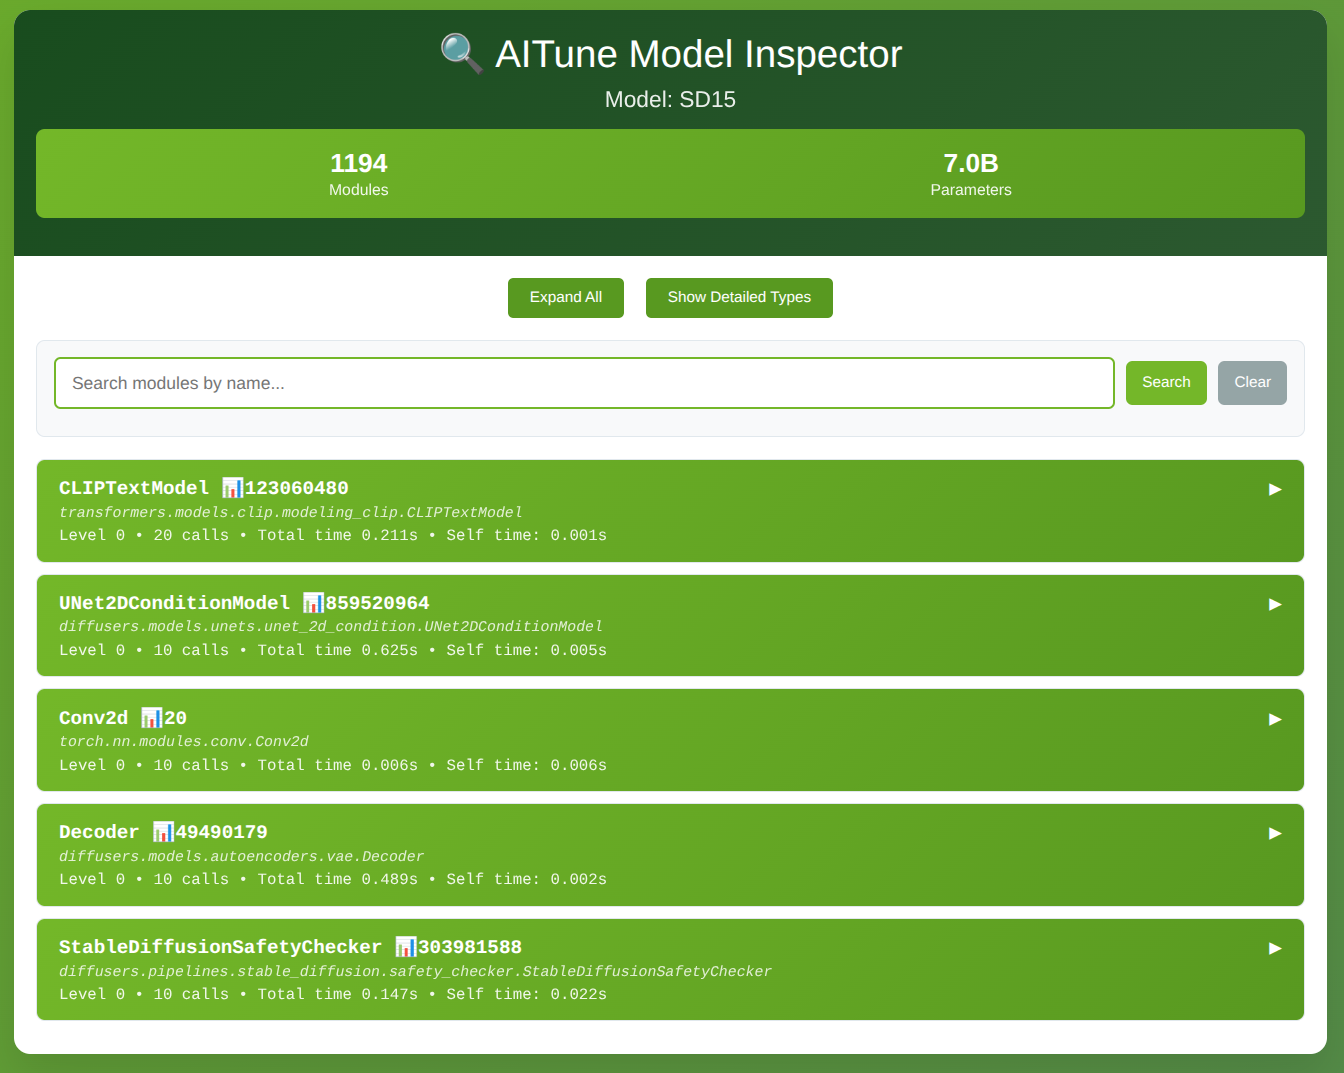
The main view gives a top-level summary of discovered modules and quick navigation across the report sections.
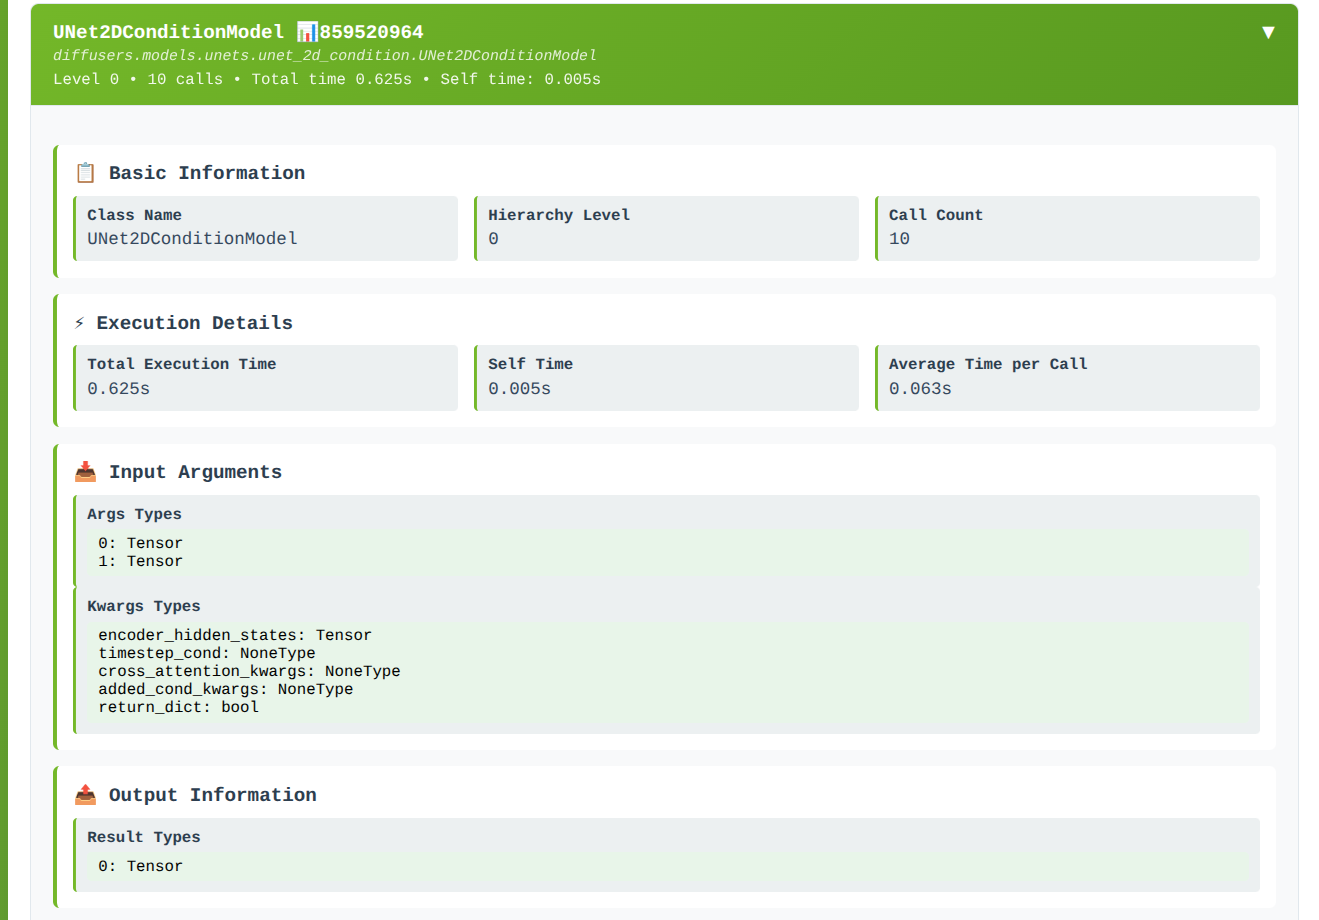
If you click on a particular module, the detailed view shows execution stats and its recorded input/output signatures.
Notes
- Inspection data is collected only for modules that actually execute.
- Running multiple batches with different shapes helps capture dynamic behavior.
- The report is generated from in-memory inspection data at
save_reporttime.
Next Steps
- Learn about Just-in-Time Tuning to actually tune models
- Compare with AOT Inspect for more control