Questions, Comments, and Bugs
To contact NVIDIA with questions and comments about NVIDIA CloudXR SDK or to report a bug against the SDK, go to the CloudXR Forum.
If you are reporting a bug, provide the following information in your e-mail:
Operating system.
GPU model.
NVIDIA graphics driver version.
Headsest/Device used.
Steps to reproduce the issue.
Log files with verbose mode enabled from the client and server.
See Log Files for more information.
For performance or network issues, share ETL files.
See ETL Traces for more information.
Log Files
From the beginning, the CloudXR libraries would write their own log files to disk. A further API was added to allow clients to send in messages to include in the CloudXR logs. For CloudXR 4.0, we’ve flipped responsibility, and control, over CloudXR message logging. Now the client is sent log messages from the library, and can choose when and how to record them, whether our sample file logger, or one of many existing logging facilities. For more details see revised CloudXR logging.
Windows
On Windows, the client and server create log files in a logs subdirectory under the current user’s AppData folder. Historically, and as a fallback, the full path used was C:\Users\*user-name*\AppData\Local\NVIDIA\CloudXR\logs\.
There is now a field for client applications to specify to CloudXR where output files should go, whether logs, trace files, stream recordings, or frame captures – this is covered in more depth in CloudXR File Storage. For the CloudXR 4.0 release, we moved away from using one subfolder for all the servers and clients, and now use a one-level-deeper subfolder based on the application. For the SteamVR server, it goes into the above path, but further under \CloudXR\SteamVR\logs\ instead. For the Windows Client Sample, files now go into \CloudXR\ClientSample\logs\. And for the experimental Server Sample, output files go to \CloudXR\ServerSample\logs\.
Additional messages are sent to the debug output, which can be captured by a standard debugger. Additionally, for the Windows client, the following command-line arguments can offer additional help:
-w: Windowed mode.Instead of driving a VR headset, this will display the video feed to the PC screen.-v: Enables verbose logging.When sending logs to NVIDIA for debugging, ensure that verbose logs are captured by using this argument.
If the server crashes, a crashdump.dmp file is created in the server logs directory.
Android
Previously on Android, logs were stored in a hard-coded location, /sdcard/CloudXR/. Due to recent changes in Android filesystem permissions, that location is inaccessible. Instead, the client app must tell CloudXR where its data folder is. For more details on this, please review CloudXR File Storage
To capture more detailed log messages from a headset for an Android client, connect the headset to a windows PC and run the adb.exe logcat CloudXR \*:S command.
Log File Names
CloudXR Server log file:
CloudXR Server log <Date Time stamp>.txtCloudXR Client log file:
CloudXR Client Log <Date Time stamp>.txtStream Server log file:
Streamer Server Log <Date Time stamp>.txtStream Windows client log file:
Streamer Client Log <Date Time stamp>.txt
Note
To prevent storage space overrun, we recommend you cap file sizes on the client as seems appropriate. The various server logs and traces will be as large as they need to be.
Additional Logging Features
Frame timing information will show up in the CloudXR Client Log when running in -v verbose mode, for all client platforms. The timing output is in the following format:
[16:33:59] fps: 71.7, s2st:  30.3, qt:  7.5, late:   0.0 ms
[16:33:59] fps: 71.8, s2st:  28.8, qt: 10.0, late:   0.0 ms
[16:33:59] fps: 71.9, s2st:  28.3, qt: 11.4, late:   0.0 ms
[16:33:59] fps: 12.1, s2st:  27.7, qt:  8.2, late:  68.9 ms
[16:33:59] fps: 99.3, s2st:  20.0, qt:  1.2, late:   8.1 ms
[16:33:59] fps: 71.6, s2st:  20.9, qt:  3.1, late:   0.0 ms
These four fields match the first four fields in the bulleted list below.
To capture more detailed QoS statistics, you use the launch option -tqs or -trace-qos-stats. This will capture a separate CSV log that can be opened in a spreadsheet or easily processed with a custom application, and includes the following fields:
Frames Per Second
Frame Time in CXR (ms)
Client Queue Time (ms)
Late Awaiting Latch (ms)
Average Video Rate (kbps)
Estimated Available Bandwidth (kbps)
Bandwidth Utilization (%)
Packet Loss (cumulative)
Jitter (us)
Round Trip Delay (ms)
Received Packets (cumulative)
Received Packets Dropped (cumulative)
The three fields other than fps that are output in both the Client log and the QoS CSV log are:
Frame Time in CXRors2st:value is the period between when the CXR server receives the eye textures to when the eye textures leave the CloudXR library on the client, or from submit-to-submit (server to client).Client Queue Timeorqt:is the period that the decoded frames spend for dejittering. This is a part of the overallFrame Time in CXRvalue.Late Awaiting Latchorlate:is the period that thecxrLatchFrame()call spends waiting for frames to be available to dequeue.
Other logging feature options are available for the server and client that use launch options (see Command-Line Options for more information).
Here are some other options:
-dforces a PNG screenshot to be captured every 1000 frames while streaming.The corresponding client and server images can then be compared.-pinstructs the client and server to disable privacy in streamer logging.
Crash Dump
If the server crashes, a crashdump.dmp file is created in the log directory on the server system. This file can be sent to NVIDIA for analysis.
ETL Traces
For issues that occur during streaming, you might need to collect detailed stream events in addition to the normal logs and send this information to the CloudXR support team for analysis.
Event Trace Logs (ETL) capture a trace of client, server, and network events and timings. Capturing these logs can help determine why a failure, or other issues, occurred during streaming. ETL captures are also extremely useful in debugging networking-related issues, such as low quality, stutters, and high latency. The ETL contains useful information only if the connection was successfully established and streaming started. If you cannot connect, the ETL will not help. The ETL is an NVIDIA-custom format for debugging issues, and we have internal-only tools to post-process the data into usable, browseable data within an internal debugging app, and is not designed to be directly viewed by customers.
To enable ETL logging you need to add -t or -trace-stream-events to the client or server launch options. For more information, see Command-Line Options.
Note
The actual logging occurs on the server, but you can request it on the client.
Warning
The trace is only completed after you exit the CloudXR server and SteamVR.
Like other server log output, the ETL trace output will be placed in the logs folder. The file with .etl extension and the current date and time contains the resulting ETL trace. For example, you might see a file like 20210703-152354-NvStreamer.etl.
Warning
If you do not get an ETL trace file in the logs folder as expected, it might be related to account permissions. ETL trace capture uses a Windows system service to record events, and it requires the SteamVR process to be running in the Administrator account or from a user account that is in the Performance Log Users group.
If you are not the original Administrator account on the machine, we recommend that you have your user account added to the Performance Log Users group. The secondary account in the admin group might not work. This is the workaround for accounts that cannot capture ETL traces.
Local Event Traces (CloudXR Visual Profiler)
The local event traces can help you understand performance or stutter issues. When you specify the -tle or the -trace-local-events launch option on either the client or server, a file called Event Trace DATE TIME.json will be produced in the respective CloudXR logs directory. The file contains timestamped events, such as when the video frame decoding started and completed on the client. The server and clients generate their own separate local traces, with different events.
Note
The trace is only a 30s capture, and it is delayed to start 10s after the client connects to ensure the stream has stabilized.
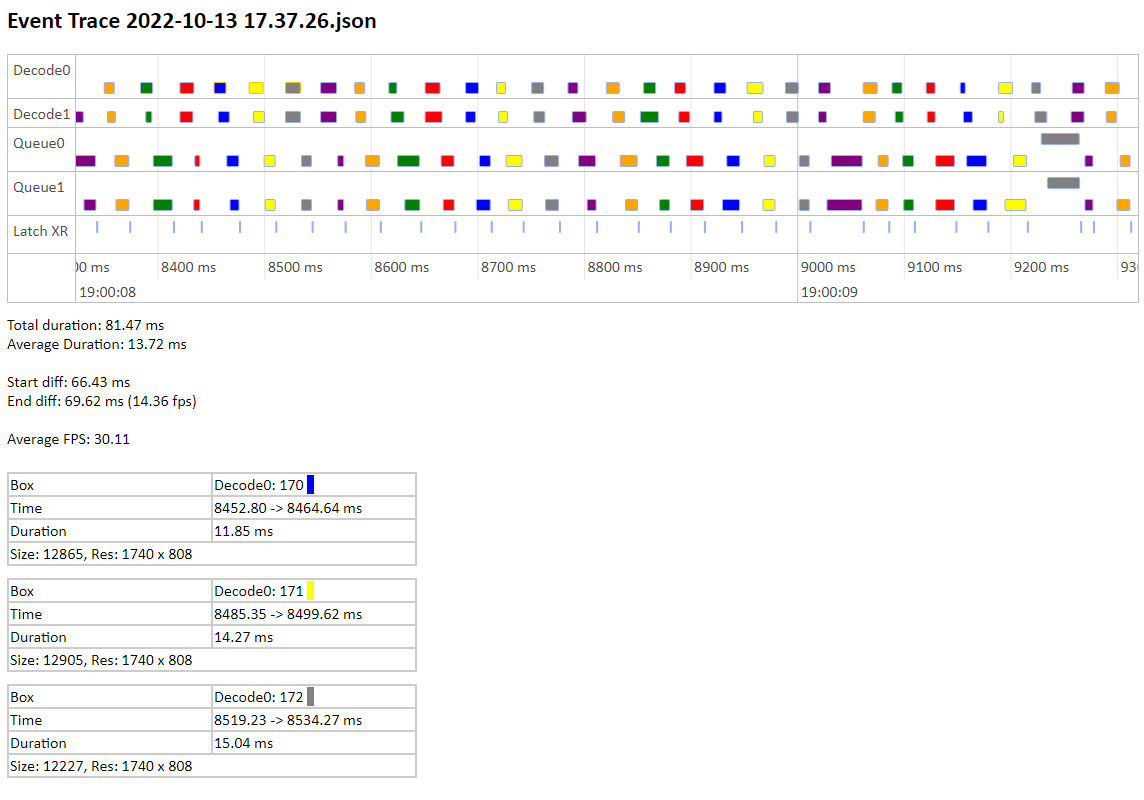
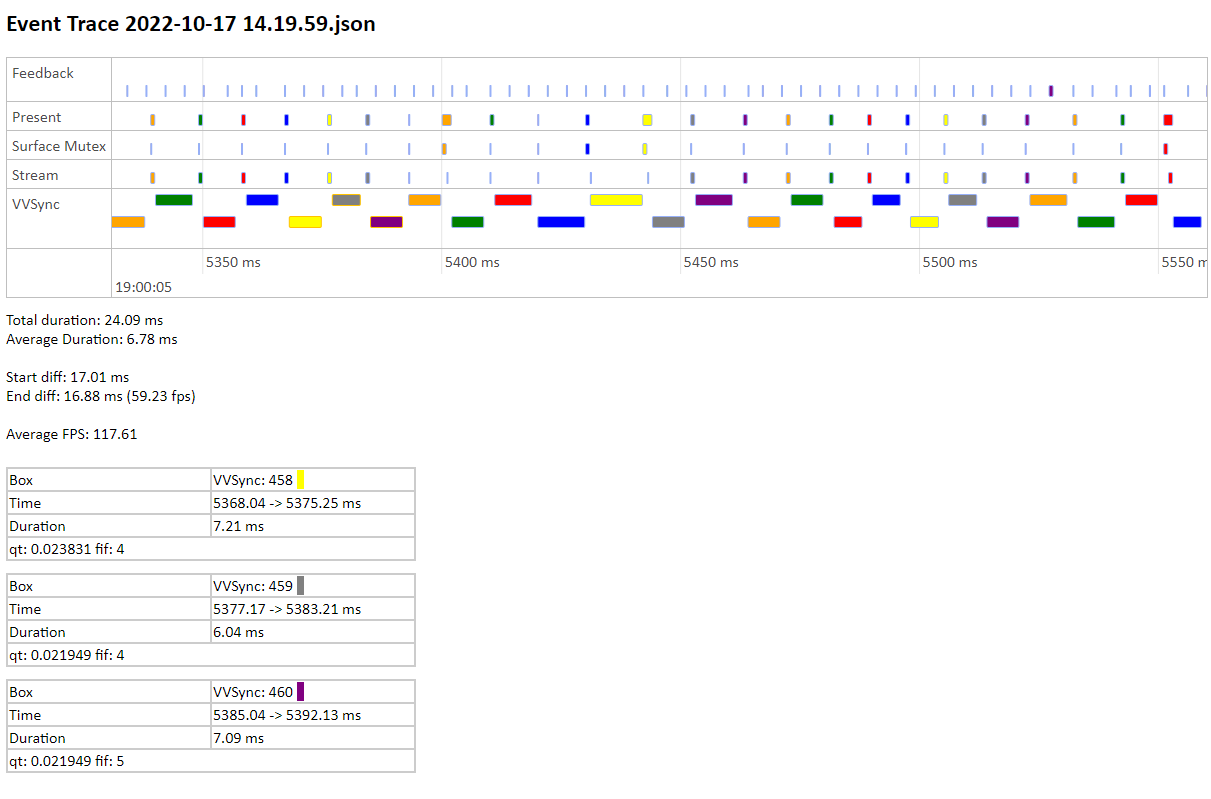
You can review the file by launching the index.html web page in TestTools\trace_vis. This step starts the CloudXR Visual Profiler in your browser, and you will be prompted to select a trace file to open. When you open this file, you should see a visualization like the following screenshots (click either to see at full size):
Example Client Trace
Example Server Trace
The above images show the example default output from both a client trace and a server trace.
Here are some of ways you can interact with the trace:
When you click on a colored box that represents an event, the profiler will display more detailed information such as the event name and ID, the start and end times of the event and total duration, and for frame data it includes the current resolution.
When you press Control+Click multiple boxes in a row in an event, the profiler will show a box for each event, and report the total and average durations for the selected events, as well as the inferred FPS rate.
You can also use the scroll wheel to zoom in and out of the graph and click-and-drag in the time row to shift the viewed window of data.
In your browser, you can open the index.html file in multiple tabs, or side by side in split screen, and rapidly switch between the tabs for easy comparisons between traces.