2. Usage#
2.1. CUPTI Compatibility and Requirements#
CUPTI, the CUDA Profiling Tools Interface, ensures seamless profiling compatibility for CUDA applications across various GPU architectures and CUDA driver versions. As part of the CUDA Toolkit, CUPTI adheres to CUDA Toolkit compatibility requirements with CUDA drivers, which includes support for Backward, Forward and Enhanced compatibilities. For instance, a profiling tool based on an older version of CUPTI can still operate with a more recent CUDA driver.
It’s essential to refer to the CUDA Toolkit and Corresponding Driver Versions table in the
CUDA Toolkit Release Notes
to determine the minimum CUDA driver version required for each release of CUPTI corresponding to a
CUDA Toolkit release. Attempting to use CUPTI calls with an incompatible CUDA driver version will
result in a CUPTI_ERROR_NOT_INITIALIZED error code.
2.2. CUPTI Initialization#
CUPTI initialization occurs lazily the first time you invoke any CUPTI function. For the Activity and Callback APIs there are no requirements on when this initialization must occur (i.e. you can invoke the first CUPTI function at any point). See the CUPTI Activity API section for more information on CUPTI initialization requirements for the activity API.
2.2.1. Recommended Initialization Workflow (CUDA 13.3+)#
Starting with CUDA 13.3, the recommended workflow uses the V2 APIs, which unify the CUPTI Activity API and Callback API under the same CUpti_SubscriberHandle. This model supports multiple concurrent subscribers and is the recommended way to use CUPTI going forward.
It is recommended that CUPTI clients call cuptiSubscribe_v2 before any activity or callback management API calls, after any required version/state queries and pre-subscription attribute configuration. Certain attributes, such as CUPTI_ACTIVITY_ATTR_ENABLE_HES, must be set via cuptiActivitySetAttribute_v2 before subscribing. For the complete step-by-step initialization workflow and the full list of V2 APIs, see Multiple Subscribers.
2.2.2. Legacy Initialization (CUDA 13.2 and earlier)#
For applications running on CUDA 13.2 or older, or with drivers older than r610, CUPTI limits activity tracing to a single subscriber.
It is recommended that CUPTI clients call cuptiSubscribe before starting the profiling session, prior to any other CUPTI calls.
If another CUPTI client is already subscribed, cuptiSubscribe will return CUPTI_ERROR_MULTIPLE_SUBSCRIBERS_NOT_SUPPORTED.
In this case, the CUPTI client should terminate further CUPTI calls and handle the error appropriately.
This ensures that only one CUPTI client is active at a time, preventing interference with each other’s profiling state.
Tool developers designing applications to run across both legacy and modern CUDA environments should ensure their initialization logic
handles CUPTI_ERROR_MULTIPLE_SUBSCRIBERS_NOT_SUPPORTED gracefully on older systems. On systems meeting the CUDA 13.3 and driver r610 requirements, this error will no longer be triggered by concurrent tool usage when the V2 APIs are used.
2.3. CUPTI Activity API#
The CUPTI Activity API allows you to asynchronously collect a trace of an application’s CPU and GPU CUDA activity. This API is provided in the header file cupti_activity.h. The following terminology is used by the activity API.
- Activity Record
CPU and GPU activity is reported in C data structures called activity records. There is a different C structure type for each activity kind (e.g.
CUpti_ActivityAPI). Records are generically referred to using theCUpti_Activitytype. This type contains only a field that indicates the kind of the activity record. Using this kind, the object can be cast from the genericCUpti_Activitytype to the specific type representing the activity. See theprintActivityfunction in the activity_trace_async sample for an example.- Activity Buffer
An activity buffer is used to transfer one or more activity records from CUPTI to the client. CUPTI fills activity buffers with activity records as the corresponding activities occur on the CPU and GPU. But CUPTI doesn’t guarantee any ordering of the activities in the activity buffer as activity records for few activity kinds are added lazily. The CUPTI client is responsible for providing empty activity buffers as necessary to ensure that no records are dropped.
An asynchronous buffering API is implemented by cuptiActivityRegisterCallbacks and cuptiActivityFlushAll.
It is not required that the activity API be initialized before CUDA initialization. All related activities occurring after initializing the activity API are collected. You can force initialization of the activity API by enabling one or more activity kinds using cuptiActivityEnable or cuptiActivityEnableContext, as shown in the initTrace function of the activity_trace_async sample. Some activity kinds cannot be directly enabled, see the API documentation for CUpti_ActivityKind for details. The functions cuptiActivityEnable and cuptiActivityEnableContext will return CUPTI_ERROR_NOT_COMPATIBLE if the requested activity kind cannot be enabled.
The activity buffer API uses callbacks to request and return buffers of activity records. To use the asynchronous buffering API, you must first register two callbacks using cuptiActivityRegisterCallbacks. One of these callbacks will be invoked whenever CUPTI needs an empty activity buffer. The other callback is used to deliver a buffer containing one or more activity records to the client. To minimize profiling overhead the client should return as quickly as possible from these callbacks. Client can pre-allocate a pool of activity buffers and return an empty buffer from the pool when requested by CUPTI. Activity buffer size should be chosen carefully, smaller buffers can result in frequent requests by CUPTI and bigger buffers can delay the automatic delivery of completed activity buffers. For typical workloads, it’s suggested to choose a size between 1 and 10 MB.
By default, CUPTI requests activity buffers separately for each thread that generates activity records. The per-thread activity buffer request strategy is especially beneficial for multi-threaded applications, as it avoids contention when multiple threads are generating activities concurrently and improve the runtime performance of the application. This can slightly increase the memory footprint. Alternatively, the client can configure CUPTI to request activity buffers at the application level. In this mode, a single shared set of buffers is used across all threads in the application. This can help reduce memory usage, though it may introduce contention when multiple threads are generating activities concurrently.
The functions cuptiActivityGetAttribute and cuptiActivitySetAttribute can be used to read and write attributes that control how the buffering API behaves. See the API documentation for more information.
Flushing of the activity buffers
CUPTI is expected to deliver the activity buffer automatically as soon as it gets full and all the activity records in it are completed. For performance reasons, CUPTI calls the underlying methods based on certain heuristics, thus it can cause delay in the delivery of the buffer. However client can make a request to deliver the activity buffer/s at any time, and this can be achieved using the APIs cuptiActivityFlushAll and cuptiActivityFlushPeriod. Behavior of these APIs is as follows:
For on-demand flush using the API
cuptiActivityFlushAllwith the flag set as 0, CUPTI returns all the activity buffers which have all the activity records completed, buffers need not to be full though. It doesn’t return buffers which have one or more incomplete records. This flush can be done at a regular interval in a separate thread.For on-demand forced flush using the API
cuptiActivityFlushAllwith the flag set as CUPTI_ACTIVITY_FLAG_FLUSH_FORCED, CUPTI returns all the activity buffers including the ones which have one or more incomplete activity records. It’s suggested to do the forced flush before the termination of the profiling session to allow remaining buffers to be delivered.For periodic flush using the API
cuptiActivityFlushPeriod, CUPTI returns only those activity buffers which are full and have all the activity records completed. It’s allowed to use the APIcuptiActivityFlushAllto flush the buffers on-demand, even when client sets the periodic flush.
Note that activity record is considered as completed if it has all the information filled up including the timestamps (if any).
The activity_trace_async sample shows how to use the activity buffer API to collect a trace of CPU and GPU activity for a simple application.
CUPTI Threads
CUPTI creates a worker thread to minimize the perturbance for the application created threads. CUPTI offloads certain operations from the application threads to the worker thread, this incldues synchronization of profiling resources between host and device, delivery of the activity buffers to the client using the buffer completed callback registered in the API cuptiActivityRegisterCallbacks etc. To minimize the overhead, CUPTI wakes up the worker thread based on certain heuristics. API cuptiActivityFlushPeriod introduced in CUDA 11.1 can be used to control the flush period of the worker thread. This setting overrides the CUPTI heuristics. It’s allowed to use the API cuptiActivityFlushAll to flush the data on-demand, even when client sets the periodic flush.
Further, CUPTI creates separate threads when certain activity kinds are enabled. For example, CUPTI creates one thread each for activity kinds CUPTI_ACTIVITY_KIND_UNIFIED_MEMORY_COUNTER and CUPTI_ACTIVITY_KIND_ENVIRONMENT to collect the information from the backend.
Kernel Name Demagling
CUPTI reports kernel names in mangled form in both activity records and callbacks. To obtain human-readable names, use cu++filt (included with the NVIDIA CUDA Toolkit) to demangle CUDA C++ symbols, or link your application with the cu++filt static library (libcufilt) to demangle in process.
Correlation ID
In CUPTI, a correlation ID is a integer value that links a CUDA API call (e.g., cuLaunchKernel, cudaMemcpy, cudaMemset) to the GPU activity records generated by that call.
Core idea
Every CUDA driver/runtime API invocation that CUPTI records is assigned a unique correlation ID.
The activity records produced as a result of that API call (kernel executions, memory copies, memsets etc.) carry the same correlation ID, so they can all be associated back to the originating CUDA API call.
The correlationId field is present in multiple CUPTI data structures:
CUDA API records:
CUpti_ActivityAPIhascorrelationIdfor the CUDA driver/runtime function call.GPU activity records: records such as
CUpti_ActivityKernel*(kernels),CUpti_ActivityMemcpy*(memory copies), andCUpti_ActivityMemset*(memsets) include acorrelationIdthat matches the originating CUDA API call.Callback data structures:
CUpti_CallbackDataexposes the same ID, allowing callback-based tools to correlate callbacks with activity records.
Typical uses of the correlation ID:
API-to-Activity Mapping: Build mappings from CUDA API calls (CPU side) to GPU activities (kernels, memcpys, memsets) by matching the shared
correlationId.External Correlation: When external correlation is enabled (OpenACC, OpenMP, MPI, application phases), external IDs are further mapped to CUPTI correlation IDs so you can relate high-level phases to lower-level CUDA work.
Note
For CUPTI to generate correlationId values, the CUDA API activity kinds i.e. CUPTI_ACTIVITY_KIND_RUNTIME and/or CUPTI_ACTIVITY_KIND_DRIVER must be enabled.
2.3.1. NVLink#
NVIDIA NVLink is a high-bandwidth, energy-efficient interconnect that enables fast communication between the CPU and GPU, and between GPUs. CUPTI provides NVLink topology information and NVLink transmit/receive throughput metrics.
The activity record CUpti_ActivityNVLink5, enabled using the activity kind CUPTI_ACTIVITY_KIND_NVLINK,
outputs NVLink topology information in terms of logical NVLinks. A logical NVLink connects two devices,
which can be either CPUs or GPUs, referred to as NVLink Processing Units (NPUs).
The physicalNvLinkCount field indicates the number of physical links in a logical link.
The fields portDev0 and portDev1 provide information about the slots where physical NVLinks are connected
for a logical link. This port corresponds to the instance of NVLink metrics profiled from a device.
Therefore, port and instance information should be used to correlate per-instance metric values with the physical
NVLinks and, in turn, with the topology.
The flag field describes the properties of a logical link, such as access to system memory or peer device memory,
and the capability to perform system memory or peer memory atomics.
The bandwidth field indicates the bandwidth of the logical link in kilobytes per second.
The number of links and total bandwidth depend on the specific GPU model and NVLink generation, with newer architectures offering more connections and higher bandwidth for improved multi-GPU communication.
CUPTI provides various metrics for each physical link, including data transmitted/received, transmit/receive throughput, and header versus user data overhead for each physical NVLink. These metrics are also provided per packet type (read/write/atomics/response) to offer more detailed insights into NVLink traffic.
The nvlink_bandwidth sample demonstrates how to use these APIs to collect NVLink metrics and topology information, as well as how to correlate metrics with the topology.
2.3.2. OpenACC#
CUPTI supports collecting information for OpenACC applications using the OpenACC tools interface implementation of the PGI runtime. OpenACC profiling is available only on Linux x86_64, IBM POWER and Arm server platform (arm64 SBSA) platforms. This feature also requires PGI runtime version 19.1 or higher.
The activity records CUpti_ActivityOpenAccData, CUpti_ActivityOpenAccLaunch, and CUpti_ActivityOpenAccOther are created, representing the three groups of callback events specified in the OpenACC tools interface. CUPTI_ACTIVITY_KIND_OPENACC_DATA, CUPTI_ACTIVITY_KIND_OPENACC_LAUNCH, and CUPTI_ACTIVITY_KIND_OPENACC_OTHER can be enabled to collect the respective activity records.
Due to the restrictions of the OpenACC tools interface, CUPTI cannot record OpenACC records from within the client application. Instead, a shared library that exports the acc_register_library function defined in the OpenACC tools interface specification must be implemented. Parameters passed into this function from the OpenACC runtime can be used to initialize the CUPTI OpenACC measurement using cuptiOpenACCInitialize. Before starting the client application, the environment variable ACC_PROFLIB must be set to point to this shared library.
cuptiOpenACCInitialize is defined in cupti_openacc.h, which is included by cupti_activity.h. Since the CUPTI OpenACC header is only available on supported platforms, CUPTI clients must define CUPTI_OPENACC_SUPPORT when compiling.
The openacc_trace sample shows how to use CUPTI APIs for OpenACC data collection.
2.3.3. CUDA Graphs#
CUPTI can collect trace of CUDA Graphs applications without breaking driver performance optimizations. CUPTI has added fields graphId and graphNodeId in the kernel, memcpy and memset activity records to denote the unique ID of the graph and the graph node respectively of the GPU activity. CUPTI issues callbacks for graph operations like graph and graph node creation/destruction/cloning and also for executable graph creation/destruction. The cuda_graphs_trace sample shows how to collect GPU trace and API trace for CUDA Graphs and how to correlate a graph node launch to the node creation API by using CUPTI callbacks for graph operations.
2.3.4. External Correlation#
CUPTI supports correlation of CUDA API activity records with external APIs. Such APIs include OpenACC, OpenMP, and MPI. This associates CUPTI correlation IDs with IDs provided by the external API. Both IDs are stored in a new activity record of type CUpti_ActivityExternalCorrelation.
CUPTI maintains a stack of external correlation IDs per CPU thread and per CUpti_ExternalCorrelationKind. Clients must use cuptiActivityPushExternalCorrelationId to push an external ID of a specific kind to this stack and cuptiActivityPopExternalCorrelationId to remove the latest ID. If a CUDA API activity record is generated while any CUpti_ExternalCorrelationKind-stack on the same CPU thread is non-empty, one CUpti_ActivityExternalCorrelation record per CUpti_ExternalCorrelationKind-stack is inserted into the activity buffer before the respective CUDA API activity record. The CUPTI client is responsible for tracking passed external API correlation IDs, in order to eventually associate external API calls with CUDA API calls. Along with the activity kind CUPTI_ACTIVITY_KIND_EXTERNAL_CORRELATION, it is necessary to enable the CUDA API activity kinds i.e. CUPTI_ACTIVITY_KIND_RUNTIME and CUPTI_ACTIVITY_KIND_DRIVER to generate external correlation activity records.
If both CUPTI_ACTIVITY_KIND_EXTERNAL_CORRELATION and any of CUPTI_ACTIVITY_KIND_OPENACC_* activity kinds are enabled, CUPTI will generate external correlation activity records for OpenACC with externalKindCUPTI_EXTERNAL_CORRELATION_KIND_OPENACC.
The cupti_external_correlation sample shows how to use CUPTI APIs for external correlation.
2.3.5. Dynamic Attach and Detach#
CUPTI provides mechanisms for attaching to or detaching from a running process to support on-demand profiling. CUPTI can be attached by calling any CUPTI API as CUPTI supports lazy initialization. To detach CUPTI, call the API cuptiFinalize() which destroys and cleans up all the resources associated with CUPTI in the current process. After CUPTI detaches from the process, the process will keep on running with no CUPTI attached to it. Any subsequent CUPTI API call will reinitialize the CUPTI. You can attach and detach CUPTI any number of times. For safe operation of the API, it is recommended that API cuptiFinalize() is invoked from the exit call site of any of the CUDA Driver or Runtime API. Otherwise, CUPTI client needs to make sure that CUDA synchronization and CUPTI activity buffer flush is done before calling the API cuptiFinalize(). To understand the need for calling the API cuptiFinalize() from specific point/s in the code flow, consider multiple application threads performing various CUDA activities. While one thread is in the middle of the cuptiFinalize(), it is quite possible that other threads continue to call into the CUPTI and try to access the state of various objects (device, context, thread state etc) maintained by CUPTI, which might be rendered invalid as part of the cuptiFinalize(), thus resulting in the crash. We have to block the other threads until CUPTI teardown is completed via cuptiFinalize(). API exit call site is one such location where we can ensure that the work submitted by all the threads has been completed and we can safely teardown CUPTI. cuptiFinalize() is a heavy operation as it does context synchronization for all active CUDA contexts and blocks all the application threads until CUPTI teardown is completed. Sample code showing the usage of the API cuptiFinalize() in the cupti callback handler code:
void CUPTIAPI
cuptiCallbackHandler(void *userdata, CUpti_CallbackDomain domain,
    CUpti_CallbackId cbid, void *cbdata)
{
    const CUpti_CallbackData *cbInfo = (CUpti_CallbackData *)cbdata;

    // Take this code path when CUPTI detach is requested
    if (detachCupti) {
        switch(domain)
        {
        case CUPTI_CB_DOMAIN_RUNTIME_API:
        case CUPTI_CB_DOMAIN_DRIVER_API:
            if (cbInfo->callbackSite == CUPTI_API_EXIT) {
                // call the CUPTI detach API
                cuptiFinalize();
            }
            break;
        default:
            break;
        }
    }
}
Full code can be found in the sample cupti_finalize.
2.3.6. Device Memory Allocation Source Tracking#
CUDA applications utilize various shared libraries such as cuBLAS, cuFFT, cuDNN etc, each serving distinct purposes.
These libraries can be integrated either statically at compile time or loaded dynamically during runtime. In the
case of dynamic loading, CUPTI enables precise attribution of memory allocations to their respective shared libraries.
This can be achieved by calling the cuptiActivityEnableAllocationSource() API. The filepath of the responsible
shared object is assigned in the source field in the activity record CUpti_ActivityMemory4 which is enabled using
the activity kind CUPTI_ACTIVITY_KIND_MEMORY2. This functionality is currently exclusive to Linux x86_64 platform.
However, if the library is statically linked, the source is identified as the main application executable rather than
the library.
2.3.7. Hardware Event System (HES)#
The NVIDIA Blackwell architecture introduces a new hardware method known as the Hardware Event System (HES) for collecting CUDA kernel timestamps. This method provides more accurate timestamps and is expected to add minimal launch overhead compared to traditional software instrumentation and semaphore-based approaches used in CUPTI. The overhead is significantly reduced for CUDA graphs in per-node trace.
This is an opt-in feature in CUPTI, and the new CUPTI API, cuptiActivityEnableHWTrace enables the collection of kernel timestamps through hardware events.
This API can be called before CUDA driver initialization, but if called after driver initialization, it must be invoked before creating the CUDA context.
As a generic solution, this API can be called from the CUPTI_CBID_RESOURCE_CU_INIT_FINISHED callback.
CUPTI depends on Perfworks library to support this feature. This library is shipped as libnvperf_host.so on Linux and nvperf_host.dll on Windows in the same directory as CUPTI when the user installs CUDA toolkit.
This feature currently has certain limitations:
It is not supported on MPS, WSL, MCDM, MIG, vGPU, or confidential compute setups.
It is supported on Linux x86_64, Linux aarch64 SBSA desktop and Windows x86_64 platforms only.
It does not support late attach functionality. CUPTI should be attached to the application from the start.
Once enabled, HES-based tracing cannot be disabled and remains active throughout the profiling session.
This API is not compatible with
cuptiActivityEnableLatencyTimestamps.
The activity_trace_async sample has an option --enableHwTrace to use HES.
2.3.8. Compute Engine Context Switch#
CUPTI provides the ability to trace GPU compute engine context switches, providing insights into how these
events affect application performance.
Users will be able to retrieve information such as timestamps, operation types (start/end),
and associated CUDA context IDs, which will help them understand context switch frequency
and identify processes contributing to frequent context switching.
The information is reported in the CUpti_ActivityComputeEngineCtxSwitch activity record,
enabled with CUPTI_ACTIVITY_KIND_COMPUTE_ENGINE_CTX_SWITCH.
To identify the process associated with a switch, refer to the contextId from CUpti_ActivityComputeEngineCtxSwitch
in the corresponding CUpti_ActivityContext record and check the processId.
Note that context switch events are not supported on MIG, vGPU or QNX setups.
2.4. Multiple Subscribers#
2.4.1. Overview#
A subscriber in CUPTI refers to a client application or tool — such as a profiler or tracer — that registers with the CUPTI library to receive callbacks and collect activity records for CUDA events during an application’s execution.
In previous versions of CUDA, CUPTI limited activity tracing to a single subscriber. If a tool attempted to subscribe while another CUPTI client was already active, cuptiSubscribe would return CUPTI_ERROR_MULTIPLE_SUBSCRIBERS_NOT_SUPPORTED. Starting with CUDA 13.3, CUPTI supports multiple concurrent subscribers to trace CUDA activities simultaneously. This feature enables scenarios where multiple CUPTI-based tracing tools need to trace the same application at the same time, with each tool maintaining its own independent activity buffers and callbacks.
Multiple subscriber support requires CUDA 13.3+ and driver r610+. It is supported on all platforms and all GPU architectures.
In the multi-subscriber model, both the CUPTI Activity API and the CUPTI Callback API are unified under the same CUpti_SubscriberHandle. Users subscribe via cuptiSubscribe_v2, and all subsequent activity and callback operations are scoped to that subscriber.
When multiple subscribers are enabled, each subscriber:
Has its own set of activity buffers (managed via per-subscriber buffer callbacks)
Can have different buffer sizes and callback configurations
Can independently enable/disable activity kinds
Receives activity records only for the activity kinds it has enabled
2.4.2. Enabling Multiple Subscribers#
To enable multiple subscribers, all subscribers must use the V2 APIs instead of the unversioned (V1) APIs. The required V2 APIs are:
cuptiSubscribe_v2, cuptiActivityEnable_v2, cuptiActivityDisable_v2, cuptiActivityEnableAndDump_v2, cuptiActivityGetAttribute_v2, cuptiActivitySetAttribute_v2, and cuptiActivityRegisterCallbacks_v2.
Important: The first subscriber that calls cuptiSubscribe_v2 must set allowMultipleSubscribers in the CUpti_SubscriberParams structure to 1. This setting is global and applies to all subsequent subscribers. Once set, subsequent cuptiSubscribe_v2 passing the same allowMultipleSubscribers value will succeed without returning CUPTI_ERROR_MULTIPLE_SUBSCRIBERS_NOT_SUPPORTED.
To check whether multiple subscribers mode has already been enabled by a previous subscriber, use cuptiActivityGetAttribute_v2 with the CUPTI_ACTIVITY_ATTR_MULTIPLE_SUBSCRIBER_STATE attribute.
2.4.3. Per-Subscriber Activity Management#
Use the following V2 APIs to manage activity tracing for each subscriber independently:
cuptiActivityEnable_v2andcuptiActivityDisable_v2: Enable and disable specific activity kinds for a subscriber. Each subscriber can enable different activity kinds.cuptiActivityGetAttribute_v2andcuptiActivitySetAttribute_v2: Get and set attributes for a specific subscriber. Note that some attributes are enforced at the subscriber level while others are global — refer to the documentation of each attribute for details.cuptiActivityRegisterCallbacks_v2: Register buffer request and completion callbacks for a specific subscriber. Each subscriber receives its own activity buffers through its registered callbacks.
Important: All tools must call cuptiSubscribe_v2 before registering buffers or enabling activity and callback collection, after any required version/state queries and pre-subscription attribute configuration.
2.4.4. Query APIs#
The following APIs can be used to query the current CUPTI multi-subscriber state:
cuptiIsTracingSessionRunning: Check whether an existing CUPTI tracing session is already active. This can be used to determine if another tool has already loaded CUPTI.cuptiActivityGetEnabledKinds: Query which activity kinds are enabled for a specific subscriber, or passNULLto get the union of kinds enabled across all subscribers.cuptiGetEnabledCallbacks: Query which CUPTI callbacks are enabled for a specific subscriber, or passNULLto get the union of callbacks enabled across all subscribers.cuptiActivityGetStructSize: Query the size of the activity record structure for a particular activity kind in the current CUPTI version.
2.4.5. Recommended Initialization Workflow#
The following is the recommended sequence for initializing CUPTI with V2 APIs:
Check for existing CUPTI sessions: Use
cuptiIsTracingSessionRunningto determine if another tool has already loaded CUPTI. Users can decide whether to proceed based on the loaded CUPTI version.Verify CUPTI version: Use
cuptiGetVersionto ensure the loaded library supports all features your tool requires.Set pre-subscription attributes: Use
cuptiActivitySetAttribute_v2to set any attributes that must be configured before subscribing (e.g.,CUPTI_ACTIVITY_ATTR_ENABLE_HES).Check multi-subscriber state: Use
cuptiActivityGetAttribute_v2withCUPTI_ACTIVITY_ATTR_MULTIPLE_SUBSCRIBER_STATEto check if another subscriber has already configured the multi-subscriber setting.Subscribe: Call
cuptiSubscribe_v2withCUpti_SubscriberParams. This should be the first activity or callback management API called after any required version/state queries and pre-subscription attribute configuration. SetallowMultipleSubscribersto 1 to enable concurrent tracing by multiple tools.Register buffer callbacks: Call
cuptiActivityRegisterCallbacks_v2to register per-subscriber buffer request and completion callbacks.Enable activities and callbacks: Use
cuptiActivityEnable_v2to enable activity kinds andcuptiEnableCallbackto enable CUPTI callbacks for your subscriber.cuptiEnableCallbackis the callback-control API; there is no_v2variant for this operation.Run workload.
Flush and tear down: Call
cuptiActivityFlushAllto flush all activity buffers, thencuptiUnsubscribeto end the tracing session.
2.4.6. Teardown#
Users should flush all activity buffers by calling cuptiActivityFlushAll before unsubscribing. Each subscriber should then call cuptiUnsubscribe when it is done with tracing.
Note
cuptiFinalize will return early without performing a tear-down if more than one subscriber is active. This prevents one tool from destroying the CUPTI state for all active tools. Users should call cuptiUnsubscribe to end their tracing session. CUPTI can be finalized only when there is one or no active subscribers.
2.4.7. Limitations and Restrictions#
V1/V2 API Mixing: V1 APIs and V2 APIs cannot be used together. If V1 (unversioned) APIs and V2 APIs are used in the same process, CUPTI will return
CUPTI_ERROR_MULTIPLE_SUBSCRIBERS_NOT_SUPPORTED.First Subscriber Setting: The
allowMultipleSubscribersparameter is determined by the first subscriber and cannot be changed by subsequent subscribers. All subscribers must use the same setting.First Subscriber’s CUPTI Version: The CUPTI library loaded by the first subscriber is the one used by all subscribers. If a subsequent subscriber uses APIs or activity kinds not present in that version, the call will return an error. Users should ensure that the first subscriber loads the highest CUPTI version among all tools.
Graph Trace Level: Graph-level and node-level trace cannot both be enabled at the same time by different subscribers. The first subscriber determines whether graph-level or node-level trace is available for all subscribers by setting the
CUPTI_ACTIVITY_ATTR_ENABLE_MULTI_SUBSCRIBER_GRAPH_LEVEL_TRACEattribute.No Inter-Subscriber Communication: There is no mechanism for subscribers to communicate with one another. Users can query what activities and callbacks are enabled across all subscribers, but cannot determine what another subscriber will do in a specific callback.
First Subscriber Attributes: Certain attributes can only be set by the first subscriber before
cuptiSubscribe_v2(e.g.,CUPTI_ACTIVITY_ATTR_ENABLE_HES). These can be queried but not changed by subsequent subscribers.Activity API Only: Multiple subscriber support applies only to the CUPTI Activity API. It is not applicable to CUPTI Profiling APIs (such as the Range Profiler or PM Sampling APIs).
Supports only CUPTI subscribers: This feature is only supported for multiple CUPTI subscribers from one or more CUPTI-based tools. CUPTI still does not support tracing or profiling along with other NVIDIA Developer Tools like cuda-gdb or Compute Sanitizer.
For a step-by-step guide, see Multi-Subscriber CUDA Tracing. For a complete example, see the multiple_subscribers_trace sample.
2.5. CUPTI User-Defined Activity Records#
2.5.1. Overview#
The CUPTI user-defined activity records feature allows users to customize activity records by selecting specific fields instead of collecting complete predefined activity records. This provides memory efficiency through reduced data collection and flexibility for application-specific profiling needs.
User-defined records can be used only when subscriber-scope activity APIs are used.
Subscriber-scope activity APIs are APIs that take a subscriber handle (CUpti_SubscriberHandle) as a parameter. All activity settings (such as attribute values, buffer callbacks, and enabled activity kinds) are tied to that subscriber. Calling ``cuptiSubscribe()`` or ``cuptiSubscribe_v2()`` is required before using any subscriber-scope activity APIs.
The subscriber-scope activity APIs used for user-defined records include:
cuptiSubscribe()/cuptiSubscribe_v2()— subscribe to CUPTI (must be called first)cuptiActivitySetAttribute_v2()— set activity attributes (e.g.CUPTI_ACTIVITY_ATTR_USER_DEFINED_RECORDS)cuptiActivityRegisterCallbacks_v2()— register buffer request and buffer completed callbackscuptiActivityEnable_v2()— enable an activity kind with field selectioncuptiActivityDisable_v2()— disable an activity kindcuptiActivityGetNextRecord_v2()— get the next activity record when parsing buffers (used in the buffer completed callback)
Minimum CUPTI Version: CUPTI_API_VERSION 130200 (CUDA 13.2). The CUPTI version can be queried using cuptiGetVersion() API.
Note
In CUPTI_API_VERSION 130200, user-defined activity records were beta. Starting with CUPTI_API_VERSION 130300 (CUDA 13.3), the feature is productized (no longer beta).
Challenges with Predefined Records:
Traditional fixed-field records like CUpti_ActivityKernel9 and CUpti_ActivityAPI present several challenges:
Inflexible layouts: Fixed-field records cannot be tailored to specific user needs
Memory waste: Unused fields consume memory and include padding for record alignment
Performance impact: Larger records with unused fields affect data access speeds
Backward compatibility issues: Adding new fields or removing obsolete fields can break existing code
Difficult customization: Each user cannot define its own activity record format
Key Benefits of User-defined Records:
Custom field selection: Users can choose only the fields necessary for their data collection; each user can define its own activity record format
Optimized memory usage: No extra storage is required for unused fields, leading to efficient memory utilization
Fast data access: Compact, structured buffers enhance performance by improving data access speeds
Future-proof: New fields can be added without disrupting existing formats. For example, if fields are bumped from 32-bit to 64-bit, users can switch to the updated fields without facing compatibility issues or redundant space usage
Lower overhead: Reduced data collection and processing costs
For a step-by-step tutorial on using this feature, see CUDA tracing with User-Defined Activity Records.
2.5.2. Pre-defined vs User-Defined Activity Records#
Pre-defined Activity Records:
Using cuptiActivityEnable(), users collect fixed records with all predefined fields. For example, CUpti_ActivityAPI record structure contains all fields regardless of specific needs.
User-Defined Activity Records:
Using cuptiActivityEnable_v2(), users select specific fields to collect.
For CUDA API tracing, each field in CUpti_ActivityAPI is mapped to an enum value in CUpti_ActivityApiFieldIds, allowing users to specify only the fields they need.
Field Selection and Mapping:
To enable field selection, CUPTI provides enum mappings for each supported activity kind.
These enums are defined in cupti_activity.h, where the data types of the enum values are documented in comments above each field.
Users can specify which fields they need through these enum values, and CUPTI will provide only those fields in the activity records.
For example, for CUDA API tracing with CUpti_ActivityAPI, each field is mapped to an enum value:
|
|
|---|---|
|
|
|
|
|
|
|
|
|
|
|
|
|
|
|
|
Important Data Type Changes:
While the majority of field names and data types remain the same as in predefined records, some fields have been updated for improved functionality:
threadId: Changed from 32-bit (uint32_t) to 64-bit (uint64_t)correlationId: Changed from 32-bit (uint32_t) to 64-bit (uint64_t)
These changes ensure better compatibility with modern systems and provide sufficient range for these identifiers.
Memory Impact:
For CUDA API activity records, if you only need 6 fields instead of all 8:
Standard approach: Collect all fields in the predefined record
User-defined: Collect only selected fields (e.g.,
API_FIELD_KIND,API_FIELD_CBID,API_FIELD_START,API_FIELD_END,API_FIELD_THREAD_ID,API_FIELD_CORRELATION_ID)
2.5.3. Data Structures#
The following data structures are used for configuring and parsing user-defined activity records:
CUpti_ActivityConfig: Configuration structure for enabling activity kinds with field selectionCUpti_ActivityFieldSelection: Specifies which fields to include in activity recordsCUpti_BufferCallbackCompleteInfo: Provides record layouts in the buffer completed callbackCUpti_ActivityRecordLayout: Describes the complete layout of a user-defined activity recordCUpti_ActivityFieldLayoutEntry: Describes a single field’s layout inside a user-defined record
For detailed structure definitions and field descriptions, refer to the documentation in cupti_activity.h.
2.5.4. Usage#
User-defined activity records require using subscriber-scope activity APIs that support field selection and provide record layout information. See CUDA tracing with User-Defined Activity Records for complete step-by-step instructions with compilable examples.
Mandatory Requirements:
The following are mandatory to use user-defined activity records:
Subscribe to CUPTI - Call
cuptiSubscribe()orcuptiSubscribe_v2()before calling any other subscriber-scope activity APIs. UsingcuptiSubscribe_v2()is recommended:CUpti_SubscriberHandle subscriber; cuptiSubscribe_v2(&subscriber, NULL, NULL, NULL);
Enable the feature - Set
CUPTI_ACTIVITY_ATTR_USER_DEFINED_RECORDSusing the subscriber-scope APIcuptiActivitySetAttribute_v2()before enabling any activity kinds:size_t valueSize = sizeof(uint8_t); uint8_t value = 1; cuptiActivitySetAttribute_v2(subscriber, CUPTI_ACTIVITY_ATTR_USER_DEFINED_RECORDS, &valueSize, &value);
Use subscriber-scope activity callback registration:
CUptiResult cuptiActivityRegisterCallbacks_v2(CUpti_SubscriberHandle subscriber, CUpti_BufferCallbackRequestFunc_v2 funcBufferRequested, CUpti_BufferCallbackCompleteFunc_v2 funcBufferCompleted);
The
BufferCompletedcallback receivesCUpti_BufferCallbackCompleteInfocontaining record layouts for all enabled activity kinds through theppRecordLayoutsfield.Use subscriber-scope activity enable API with field selection:
CUptiResult cuptiActivityEnable_v2(CUpti_SubscriberHandle subscriber, CUpti_ActivityKind kind, CUpti_ActivityConfig *config);
Use subscriber-scope activity disable API when changing field selection:
CUptiResult cuptiActivityDisable_v2(CUpti_SubscriberHandle subscriber, CUpti_ActivityKind kind, CUpti_ActivityConfig *config);
Include KIND field first - The
*_FIELD_KINDfield must be the first field in any selection (e.g.,API_FIELD_KIND,KERNEL_FIELD_KIND). Select only fields needed for your analysis to minimize memory usage.Flush when changing field selection - To modify field selection for an already-enabled activity kind:
Disable the activity kind using
cuptiActivityDisable_v2()Call
cuptiActivityFlushAll(1)(mandatory before re-enabling)Re-enable with new field selection using
cuptiActivityEnable_v2()
Explicit enabling of dependent activity kinds - Some activity kinds that are implicitly enabled with predefined records must be explicitly enabled with user-defined records:
CUPTI_ACTIVITY_KIND_MEMCPY2is implicitly enabled when enablingCUPTI_ACTIVITY_KIND_MEMCPYwithcuptiActivityEnable(), but must be explicitly enabled withcuptiActivityEnable_v2()when using user-defined recordsCUPTI_ACTIVITY_KIND_DEVICE_GRAPH_TRACEis implicitly enabled when enablingCUPTI_ACTIVITY_KIND_GRAPH_TRACEwithcuptiActivityEnable(), but must be explicitly enabled withcuptiActivityEnable_v2()when using user-defined records
Without explicit enabling and field selection, CUPTI will not provide records for these kinds.
Parsing Record Layouts:
Record layouts are provided through the ppRecordLayouts field in CUpti_BufferCallbackCompleteInfo received in the CUpti_BufferCallbackCompleteFunc_v2 callback. Two parsing approaches are available:
Field-by-field parsing (recommended): Iterate through
CUpti_ActivityRecordLayout.pEntriesand extract fields using offset/size information. Handles alignment automatically.Typecasting to custom struct: Define a struct matching your field selection and typecast the record pointer. Requires exact alignment matching.
See CUDA tracing with User-Defined Activity Records for complete parsing examples.
Version Compatibility:
The structSize field in all structures (CUpti_ActivityConfig, CUpti_ActivityFieldSelection, CUpti_BufferCallbackRequestInfo, CUpti_BufferCallbackCompleteInfo, CUpti_ActivityRecordLayout, CUpti_ActivityFieldLayoutEntry) is used for CUPTI version compatibility. CUPTI fills this field to indicate structure version. When newer fields are introduced in future CUPTI versions, check structSize to determine which fields are valid and can be safely accessed. Users do not need to set structSize - CUPTI always fills this field.
2.5.5. Limitations#
The below activity kinds are not supported but CUPTI currently does not provide activity records for these kinds:
CUPTI_ACTIVITY_KIND_CDP_KERNELCUPTI_ACTIVITY_KIND_PREEMPTIONCUPTI_ACTIVITY_KIND_MODULECUPTI_ACTIVITY_KIND_DEVICE_ATTRIBUTECUPTI_ACTIVITY_KIND_FUNCTIONCUPTI_ACTIVITY_KIND_MEMORY
Field selection cannot be modified after enabling an activity kind. To change field selection, the activity kind must be disabled,
cuptiActivityFlushAll(1)must be called, and then the activity kind can be re-enabled with the new field selection. See CUDA tracing with User-Defined Activity Records for a complete example of changing field selection.Calling
cuptiActivityFlushAll(1)is only required when changing field selection. If the field selection remains the same when re-enabling an activity kind after disabling it, flushing is not required.Pre-defined records cannot be used alongside user-defined records. Once user-defined records are enabled, all activity kinds must use
cuptiActivityEnable_v2(). You cannot enable the same activity kind with bothcuptiActivityEnable()andcuptiActivityEnable_v2().Mixture of pre-defined and user-defined records for different activity kinds is not supported. You cannot enable some activity kinds with
cuptiActivityEnable()and others withcuptiActivityEnable_v2().
2.5.6. Tutorial and Sample Code#
Tutorial:
For a comprehensive step-by-step guide on using user-defined records, see CUDA tracing with User-Defined Activity Records.
Sample Code:
Refer to sample cupti_user_defined_records for practical examples of using user-defined records in CUPTI.
Refer to helper files helper_cupti_activity_user_defined_records.h (Location: $CUPTI_DIR/samples/common/) to reference parsing of user-defined activity records.
2.6. CUPTI Callback API#
The CUPTI Callback API allows you to register a callback into your own code. Your callback will be invoked when the application being profiled calls a CUDA runtime or driver function, or when certain events occur in the CUDA driver. This API is provided in the header file cupti_callbacks.h. The following terminology is used by the callback API.
- Callback Domain
Callbacks are grouped into domains to make it easier to associate your callback functions with groups of related CUDA functions or events. There are currently four callback domains, as defined by
CUpti_CallbackDomain: a domain for CUDA runtime functions, a domain for CUDA driver functions, a domain for CUDA resource tracking, and a domain for CUDA synchronization notification.- Callback ID
Each callback is given a unique ID within the corresponding callback domain so that you can identify it within your callback function. The CUDA driver API IDs are defined in
cupti_driver_cbid.hand the CUDA runtime API IDs are defined incupti_runtime_cbid.h. Both of these headers are included for you when you includecupti.h. The CUDA resource callback IDs are defined byCUpti_CallbackIdResource, and the CUDA synchronization callback IDs are defined byCUpti_CallbackIdSync.- Callback Function
Your callback function must be of type
CUpti_CallbackFunc. This function type has two arguments that specify the callback domain and ID so that you know why the callback is occurring. The type also has acbdataargument that is used to pass data specific to the callback.- Subscriber
A subscriber is used to associate each of your callback functions with one or more CUDA API functions. There can be at most one subscriber initialized with
cuptiSubscribe()at any time. Before initializing a new subscriber, the existing subscriber must be finalized withcuptiUnsubscribe().
Each callback domain is described in detail below. Unless explicitly stated, it is not supported to call any CUDA runtime or driver API from within a callback function. Doing so may cause the application to hang.
2.6.1. Driver and Runtime API Callbacks#
Using the callback API with the CUPTI_CB_DOMAIN_DRIVER_API or CUPTI_CB_DOMAIN_RUNTIME_API domains, you can associate a callback function with one or more CUDA API functions. When those CUDA functions are invoked in the application, your callback function is invoked as well. For these domains, the cbdata argument to your callback function will be of the type CUpti_CallbackData.
It is legal to call cudaThreadSynchronize(), cudaDeviceSynchronize(), cudaStreamSynchronize(), cuCtxSynchronize(), and cuStreamSynchronize() from within a driver or runtime API callback function.
The following code shows a typical sequence used to associate a callback function with one or more CUDA API functions. To simplify the presentation, error checking code has been removed.
CUpti_SubscriberHandle subscriber;
MyDataStruct *my_data = ...;
...
cuptiSubscribe(&subscriber,
               (CUpti_CallbackFunc)my_callback , my_data);
cuptiEnableDomain(1, subscriber,
                  CUPTI_CB_DOMAIN_RUNTIME_API);
First, cuptiSubscribe is used to initialize a subscriber with the my_callback callback function. Next, cuptiEnableDomain is used to associate that callback with all the CUDA runtime API functions. Using this code sequence will cause my_callback to be called twice each time any of the CUDA runtime API functions are invoked, once on entry to the CUDA function and once just before exit from the CUDA function. CUPTI callback API functions cuptiEnableCallback and cuptiEnableAllDomains can also be used to associate CUDA API functions with a callback (see reference below for more information).
The following code shows a typical callback function.
void CUPTIAPI
my_callback(void *userdata, CUpti_CallbackDomain domain,
            CUpti_CallbackId cbid, const void *cbdata)
{
  const CUpti_CallbackData *cbInfo = (CUpti_CallbackData *)cbdata;
  MyDataStruct *my_data = (MyDataStruct *)userdata;

  if ((domain == CUPTI_CB_DOMAIN_RUNTIME_API) &&
      (cbid == CUPTI_RUNTIME_TRACE_CBID_cudaMemcpy_v3020))  {
    if (cbInfo->callbackSite == CUPTI_API_ENTER) {
        cudaMemcpy_v3020_params *funcParams =
             (cudaMemcpy_v3020_params *)(cbInfo->
                 functionParams);

        size_t count = funcParams->count;
        enum cudaMemcpyKind kind = funcParams->kind;
        ...
      }
  ...
In your callback function, you use the CUpti_CallbackDomain and CUpti_CallbackID parameters to determine which CUDA API function invocation is causing this callback. In the example above, we are checking for the CUDA runtime cudaMemcpy function. The cbdata parameter holds a structure of useful information that can be used within the callback. In this case, we use the callbackSite member of the structure to detect that the callback is occurring on entry to cudaMemcpy, and we use the functionParams member to access the parameters that were passed to cudaMemcpy. To access the parameters, we first cast functionParams to a structure type corresponding to the cudaMemcpy function. These parameter structures are contained in generated_cuda_runtime_api_meta.h, generated_cuda_meta.h, and a number of other files. When possible, these files are included for you by cupti.h.
The callback_event and callback_timestamp samples described on the samples page both show how to use the callback API for the driver and runtime API domains.
2.6.2. Resource Callbacks#
Using the callback API with the CUPTI_CB_DOMAIN_RESOURCE domain, you can associate a callback function with some CUDA resource creation and destruction events. For example, when a CUDA context is created, your callback function will be invoked with a callback ID equal to CUPTI_CBID_RESOURCE_CONTEXT_CREATED. For this domain, the cbdata argument to your callback function will be of the type CUpti_ResourceData.
Note that APIs cuptiActivityFlush and cuptiActivityFlushAll will result in deadlock when called from stream destroy starting callback identified using callback ID CUPTI_CBID_RESOURCE_STREAM_DESTROY_STARTING.
2.6.3. Synchronization Callbacks#
Using the callback API with the CUPTI_CB_DOMAIN_SYNCHRONIZE domain, you can associate a callback function with CUDA context and stream synchronizations. For example, when a CUDA context is synchronized, your callback function will be invoked with a callback ID equal to CUPTI_CBID_SYNCHRONIZE_CONTEXT_SYNCHRONIZED. For this domain, the cbdata argument to your callback function will be of the type CUpti_SynchronizeData.
2.6.4. State Callbacks#
Any fatal error encountered by an explicit CUPTI API call is returned by the API itself, whereas errors encountered by CUPTI in the background is returned to the user only during the next explicit CUPTI API call. Using the callback API with the CUPTI_CB_DOMAIN_STATE domain, you can associate a callback function with errors in CUPTI, and receive the reported error instantaneously. For example, when a CUPTI runs into a fatal error, your callback function will be invoked with a callback ID equal to CUPTI_CBID_STATE_FATAL_ERROR. For this domain, the cbdata argument to your callback function will be of the type CUpti_StateData.
As part of CUpti_StateData, you can receive the error code of the failure, along with an appropriate error message with possible causes or appropriate links to documentation. The example usage of these callbacks can be found in the CUPTI trace samples.
2.7. NVIDIA Tools Extension (NVTX) Support#
CUPTI provides both callback and activity record support for NVTX (NVIDIA Tools Extension) APIs, including extended payload decoding introduced in NVTX v3.2.
2.7.1. NVTX Activity Records#
To collect CUPTI activity records for NVTX events, you must enable the appropriate activity kinds using the CUPTI Activity API cuptiActivityEnable:
CUptiResult res = cuptiActivityEnable(CUPTI_ACTIVITY_KIND_MARKER);
CUptiResult res = cuptiActivityEnable(CUPTI_ACTIVITY_KIND_MARKER_DATA);
Note:
CUPTI_ACTIVITY_KIND_MARKER must be enabled before enabling CUPTI_ACTIVITY_KIND_MARKER_DATA.
Without MARKER, no MARKER_DATA records will be emitted.
2.7.2. NVTX Callbacks#
You can associate a callback function with NVTX API calls using the CUPTI_CB_DOMAIN_NVTX domain. When an NVTX function is invoked, CUPTI triggers your registered callback.
First, cuptiSubscribe is used to initialize a subscriber with the NvtxCallbacks callback function. Next, cuptiEnableDomain is used to associate that callback with all the NVTX functions. Using this code sequence will cause NvtxCallbacks to be called once each time any of the NVTX functions are invoked
2.7.2.1. Typical callback registration#
CUpti_SubscriberHandle subscriber;
MyDataStruct *my_data = ...;

cuptiSubscribe(&subscriber, (CUpti_CallbackFunc)NvtxCallbacks, my_data);
cuptiEnableDomain(1, subscriber, CUPTI_CB_DOMAIN_NVTX);
Alternatively, use the CUPTI Callback API cuptiEnableCallback for fine-grained control.
2.7.2.2. Callback function example#
void CUPTIAPI
NvtxCallbacks(void *userdata, CUpti_CallbackDomain domain,
              CUpti_CallbackId cbid, const void *cbdata)
{
    const CUpti_NvtxData *nvtxInfo = (const CUpti_NvtxData *)cbdata;
    if ((domain == CUPTI_CB_DOMAIN_NVTX) &&
        (cbid == CUPTI_CBID_NVTX_nvtxRangeStartEx))
    {
        nvtxRangeStartEx_params *params =
            (nvtxRangeStartEx_params *)nvtxInfo->functionParams;
        nvtxRangeId_t *id =
            (nvtxRangeId_t *)nvtxInfo->functionReturnValue;
        ...
    }
}
Use functionParams to access input arguments and functionReturnValue for output.
2.7.3. Initialization to Receive NVTX Callbacks or Activity Records#
2.7.3.1. For your CUPTI-based profiling library#
The environment must be configured to inject the library at runtime:
setenv("NVTX_INJECTION32_PATH", "/path/to/32-bit/version/of/cupti/based/profiling/library", 1);
setenv("NVTX_INJECTION64_PATH", "/path/to/64-bit/version/of/cupti/based/profiling/library", 1);
Export the following injection functions:
/* Extern the CUPTI NVTX initialization APIs. The APIs are thread-safe */
extern "C" CUptiResult CUPTIAPI cuptiNvtxInitialize(void *pfnGetExportTable);
extern "C" CUptiResult CUPTIAPI cuptiNvtxInitialize2(void *pfnGetExportTable);
Ensure these functions are defined in your profiling library to initialize NVTX support when the library is loaded:
extern "C" int InitializeInjectionNvtx(void* p)
{
    return (cuptiNvtxInitialize(p) == CUPTI_SUCCESS) ? 1 : 0;
}

extern "C" int InitializeInjectionNvtx2(void* p)
{
    return (cuptiNvtxInitialize2(p) == CUPTI_SUCCESS) ? 1 : 0;
}
2.7.3.2. For application that have embedded CUPTI APIs#
The environment variables must be set to CUPTI library itself:
setenv("NVTX_INJECTION32_PATH", "/path/to/cupti/library/libcupti.so", 1);
setenv("NVTX_INJECTION64_PATH", "/path/to/cupti/library/libcupti.so", 1);
NOTE: User does not need to export cuptiNvtxInitialize or cuptiNvtxInitialize2 functions in this case.
2.7.3.3. NVTX Versions#
NVTX v1/v2: Initialization is done once per process.
NVTX v3: Each dynamic library with NVTX v3 initializes separately on its first NVTX call.
2.7.4. CUPTI NVTX Extended Payload Support#
CUPTI provides utilities to parse and decode extended payloads emitted by NVTX v3.2 APIs.
Refer nvToolsExtPayload.h for the NVTX extended payload API documentation.
2.7.4.1. New CUPTI APIs Introduced#
cuptiNvtxExtensionInitializecuptiActivityGetNvtxExtPayloadAttrcuptiActivityGetNvtxExtPayloadEntryTypeInfo
2.7.4.2. CUPTI initialization for NVTX extended payload parsing#
The workflow is similar to above section Initialization to Receive NVTX Callbacks or Activity Records. Export the following injection function:
/* Extern the CUPTI NVTX Extenstion initialization APIs. The API is thread-safe */
extern "C" CUptiResult CUPTIAPI cuptiNvtxExtensionInitialize(nvtxExtModuleInfo_t *moduleInfo);
Ensure this function is defined in your profiling library to initialize NVTX extension support when the library is loaded:
extern "C" int InitializeInjectionNvtxExtension(void* p)
{
    return (cuptiNvtxExtensionInitialize(p) == CUPTI_SUCCESS) ? 1 : 0;
}
NOTE: User does not need to export cuptiNvtxExtensionInitialize function in the case where CUPTI APIs are embedded in the application.
Export these CUPTI APIs to parse NVTX extended payloads:
extern "C" CUptiResult CUPTIAPI cuptiActivityGetNvtxExtPayloadAttr(
    uint32_t cuptiDomainId, uint64_t schemaId, CUpti_NvtxExtPayloadAttr *pPayloadAttributes);

extern "C" const nvtxPayloadEntryTypeInfo_t * CUPTIAPI cuptiActivityGetNvtxExtPayloadEntryTypeInfo();
2.7.4.3. Supported Features#
Payload schema registration via
nvtxPayloadSchemaRegisterEnum type registration via
nvtxPayloadEnumRegisterPayload schema type
NVTX_PAYLOAD_SCHEMA_TYPE_STATICPayload schema type
NVTX_PAYLOAD_SCHEMA_TYPE_DYNAMICNOTE: If the dynamic schema is nested schema, it is not supported.
Payload schema entry type is an array:
Fixed-size arrays i.e. entry types with flag
NVTX_PAYLOAD_ENTRY_FLAG_ARRAY_FIXED_SIZELength-indexed arrays i.e. entry types with flag
NVTX_PAYLOAD_ENTRY_FLAG_ARRAY_LENGTH_INDEXZero-terminated arrays i.e. entry types with flag
NVTX_PAYLOAD_ENTRY_FLAG_ARRAY_ZERO_TERMINATED
NCCL library support:
NVTX payloads used in the NCCL library are supported.
2.7.4.4. Limitations#
NVTX callbacks for NVTX APIs
nvtxPayloadSchemaRegisterandnvtxPayloadEnumRegisterare not supported.Payload entries that are registered strings are not supported:
Entry type is
NVTX_PAYLOAD_ENTRY_TYPE_NVTX_REGISTERED_STRING_HANDLE
Payload semantics are not supported:
nvtxSemanticsHeader_tis used to define semantics for payloads.
Payload schema types not supported:
NVTX_PAYLOAD_SCHEMA_TYPE_UNIONNVTX_PAYLOAD_SCHEMA_TYPE_UNION_WITH_INTERNAL_SELECTOR
Payload entries that are deep copy are not supported:
Entry types with flag
NVTX_PAYLOAD_SCHEMA_FLAG_DEEP_COPY
New payload-based NVTX APIs are not supported:
nvtxRangePushPayloadnvtxRangePopPayloadnvtxRangeStartPayloadnvtxRangeEndPayloadnvtxMarkPayload
2.7.4.5. Helper files#
Location:
$CUPTI_DIR/samples/common/nvtx/nvtx_payload_parser.[cpp|h]: Decodes CUPTI-collected NVTX extended payloads.nvtx_payload_attributes.[cpp|h]: Schema and attribute descriptor logic.
Look for the comment below to locate where the decoded data appears:
// NOTE: PLACEHOLDER FOR GETTING PAYLOAD DATA FOR AN ENTRY IN THE SCHEMA
Refer samples cupti_nvtx and cupti_nvtx_ext_payload for practical examples of using NVTX with CUPTI.
CuptiParseNvtxPayload() is used to decode NVTX extended payloads from CUPTI activity records in cupti_nvtx_ext_payload sample.
2.8. CUPTI Profiler Host API#
CUPTI has introduced a new set of profiler host APIs cuptiProfilerHost* in the CUDA 12.6 release. These APIs can be used to perform various
host-side tasks necessary for collecting profiling data through either PM Sampling APIs or the new Range Profiler APIs.
These APIs are provided in the header file cupti_profiler_host.h.
These new APIs replace the old Perfworks APIs and are more high-level compared to the previous NVPW Raw Metric and Metric Evaluator APIs. They maintain key functionality while abstracting away low-level details, offering a more streamlined and efficient way to gather performance metrics.
In CUPTI Profiling there are three types of host operations, these are enumeration, configuration and evaluation.
2.8.1. Enumeration#
A metric is a quantifiable measurement used to assess the performance and efficiency of a CUDA kernel. Metrics can provide insights into various computational characteristics such as execution time, instruction throughput, or cache efficiency.
When profiling a kernel, metrics are predefined to capture particular performance data. After the profiling is complete, the values associated with these metrics allow developers to analyze the kernel’s behavior, identify performance bottlenecks, and make informed optimizations.
For example, common metrics during kernel profiling might include:
Execution Time: The duration the kernel takes to complete.
Memory Bandwidth: The amount of data transferred between units.
Instruction Throughput: The number of instructions executed per second.
Cache Hit Rate: The percentage of memory accesses that are served by the cache.
Metrics provide a detailed, quantitative view of the kernel’s performance, making them essential for performance tuning and optimization.
CUPTI has introduced several APIs for querying the supported metrics for various chips and retrieving properties of those metrics, such as the metric type and a description of what each metric represents.
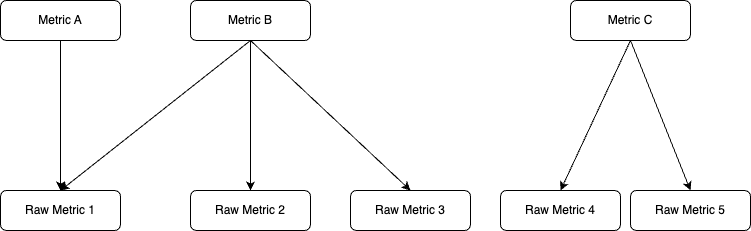
Each metric can be treated as a function of single or multiple raw metrics (also referred as raw counters). CUPTI will schedule (refer configuration) and profile the associated raw metrics and store it in a counter data image (refer evaluation).
Metric Types:
All the supported metrics in CUPTI can be categorized into 3 groups that are counters, ratio and throughput metrics. For profiling a metric user needs to add a rollup or a submetric or sometimes both based on metric type one wants to collect profiling data. A counter metric type needs to have a rollup but having a submetric is optional. For ratio metric type rollups are not supported so only a submetric will be added as a suffix for a valid profiling metric. For throughput metrics both rollups and submetrics are needed.
CUPTI supports four types of rollups that are sum, avg, min and max.
Rollup Table# Rollup Type
Metric details
.sum
The sum of counter values across all unit instances.
.avg
The average of counter values across all unit instances.
.min
The minimum of counter values across all unit instances.
.max
The maximum of counter values across all unit instances.
For counter metric types, refer to the below table for a list of optional sub metrics that can be added to the base metric for profiling.
Submetrics supported for counter metrics# Submetrics
Description
.peak_sustained
The peak sustained rate.
.peak_sustained_active
The peak sustained rate during unit active cycles.
.peak_sustained_active.per_second
The peak sustained rate during unit active cycles, per second.
.peak_sustained_elapsed
The peak sustained rate during unit elapsed cycles.
.peak_sustained_elapsed.per_second
The peak sustained rate during unit elapsed cycles, per second.
.per_second
The number of operations per second.
.per_cycle_active
The number of operations per unit active cycle.
.per_cycle_elapsed
The number of operations per unit elapsed cycle.
.pct_of_peak_sustained_active
% of peak sustained rate achieved during unit active cycles.
.pct_of_peak_sustained_elapsed
% of peak sustained rate achieved during unit elapsed cycles.
For example,
smsp__warps_launched.sum.per_second
Base metric:
smsp__warps_launchedRollup:
.sumSubmetric:
.per_secondRatio metric only supports below three sub-metrics.
Submetrics supported for ratio metrics# Submetrics
Description
.pct
The value expressed as a percentage.
.ratio
The value expressed as a ratio.
.max_rate
The ratio’s maximum value.
For example,
smsp__average_inst_executed_per_warp.max_rate
Base metric:
smsp__average_inst_executed_per_warpRollup:
NOT ALLOWEDSubmetric:
.max_rateFor throughput metric, users need to add one of the rollups with below submetrics.
Submetrics supported for throughput metrics# Submetrics
Description
.pct_of_peak_sustained_active
% of peak sustained rate achieved during unit active cycles.
.pct_of_peak_sustained_elapsed
% of peak sustained rate achieved during unit elapsed cycles.
For example,
sm__throughput.sum.pct_of_peak_sustained_active
Base metric:
sm__throughputRollup:
.sumSubmetric:
.pct_of_peak_sustained_activeNote
For decoding the metric name, the user can refer to the Metrics Decoder section in kernel profiling guide mentioned in Nsight compute documentation.
APIs:
The
cuptiProfilerHostGetBaseMetrics()API for listing base metrics for a metric type (counter, throughput and ratio).The
cuptiProfilerHostGetSubMetrics()API for listing the submetric for a metric.The
cuptiProfilerHostGetMetricProperties()API for querying the details about a metric like associated hardware unit, metric type and a short description about the metric.Code Samples:
// Initialize profiler host

CUptiResult GetSupportedBaseMetrics(std::vector<std::string>& metricsList)
{
   for (size_t metricTypeIndex = 0; metricTypeIndex < CUPTI_METRIC_TYPE__COUNT; ++metricTypeIndex)
   {
      CUpti_Profiler_Host_GetBaseMetrics_Params getBaseMetricsParams {CUpti_Profiler_Host_GetBaseMetrics_Params_STRUCT_SIZE};
      getBaseMetricsParams.pHostObject = m_pHostObject;
      getBaseMetricsParams.metricType = (CUpti_MetricType)metricTypeIndex;
      cuptiProfilerHostGetBaseMetrics(&getBaseMetricsParams);

      for (size_t metricIndex = 0; metricIndex < getBaseMetricsParams.numMetrics; ++metricIndex) {
         metricsList.push_back(getBaseMetricsParams.ppMetricNames[metricIndex]);
      }
    }
    return CUPTI_SUCCESS;
 }

CUptiResult GetMetricProperties(const std::string& metricName, CUpti_MetricType& metricType, std::string& metricDescription)
{
   CUpti_Profiler_Host_GetMetricProperties_Params getMetricPropertiesParams {CUpti_Profiler_Host_GetMetricProperties_Params_STRUCT_SIZE};
   getMetricPropertiesParams.pHostObject = m_pHostObject;
   getMetricPropertiesParams.pMetricName = metricName.c_str();
   cuptiProfilerHostGetMetricProperties(&getMetricPropertiesParams);
   metricType = getMetricPropertiesParams.metricType;
   metricDescription = getMetricPropertiesParams.pDescription;
   return CUPTI_SUCCESS;
}

CUptiResult GetSubMetrics(const std::string& metricName, std::vector<std::string>& subMetricsList)
{
    CUpti_MetricType metricType;
    std::string metricDescription;
    GetMetricProperties(metricName, metricType, metricDescription);

    CUpti_Profiler_Host_GetSubMetrics_Params getSubMetricsParams {CUpti_Profiler_Host_GetSubMetrics_Params_STRUCT_SIZE};
    getSubMetricsParams.pHostObject = m_pHostObject;
    getSubMetricsParams.pMetricName = metricName.c_str();
    getSubMetricsParams.metricType = metricType;
    cuptiProfilerHostGetSubMetrics(&getSubMetricsParams);

    for (size_t subMetricIndex = 0;subMetricIndex < getSubMetricsParams.numOfSubmetrics; ++subMetricIndex) {
        subMetricsList.push_back(getSubMetricsParams.ppSubMetrics[subMetricIndex]);
    }
    return CUPTI_SUCCESS;
}

// Deinitialize profiler host
Sample cupti_metric_properties shows how to query number of passes required to collect a set of counters.
2.8.1.1. Single Pass Metric Sets#
For PM Sampling, CUPTI requires that the metrics configuration specified by the user be collected in a single pass. Selecting compatible metrics for single pass collection can be challenging, so CUPTI provides predefined single pass metric sets. Each set contains metrics that can be gathered together in one pass, and these sets vary depending on the GPU architecture. Metrics from different single pass metric sets cannot be combined for PM sampling.
From CUPTI 13.2 onwards, CUPTI provides two new APIs to help users query available single pass metric sets and the metrics within each set:
cuptiProfilerHostGetSinglePassSets():Lists the available single pass metric sets for a given chip.cuptiProfilerHostGetMetricsInSinglePassSet():Lists the metrics included in a specific single pass metric set.
These APIs enable users to programmatically select compatible metrics for PM sampling instead of parsing metric names with “Triage” namespace. For usage example, refer to the pm_sampling sample in CUPTI samples.
Code Samples:
CUptiResult GetSupportedSinglePassMetricsSets(std::vector<const char*>& metricsSetsList, const char* pChipName) { CUpti_Profiler_Host_GetSinglePassSets_Params getSinglePassSetsParams {CUpti_Profiler_Host_GetSinglePassSets_Params_STRUCT_SIZE}; getSinglePassSetsParams.pChipName = pChipName; CUPTI_API_CALL(cuptiProfilerHostGetSinglePassSets(&getSinglePassSetsParams)); metricsSetsList.resize(getSinglePassSetsParams.numOfSinglePassSets); getSinglePassSetsParams.ppSinglePassSets = metricsSetsList.data(); CUPTI_API_CALL(cuptiProfilerHostGetSinglePassSets(&getSinglePassSetsParams)); return CUPTI_SUCCESS; } CUptiResult GetMetricsInSinglePassSet(const char* pSinglePassSet, std::vector<std::string>& metricsList, const char* pChipName) { std::vector<uint8_t> metricsBuffer; std::vector<size_t> metricsIndices; { CUpti_Profiler_Host_GetMetricsInSinglePassSet_Params params {CUpti_Profiler_Host_GetMetricsInSinglePassSet_Params_STRUCT_SIZE}; params.pChipName = pChipName; params.pSinglePassSetName = pSinglePassSet; CUPTI_API_CALL(cuptiProfilerHostGetMetricsInSinglePassSet(¶ms)); metricsBuffer.resize(params.metricsBufferSize); metricsIndices.resize(params.numOfMetricsInSinglePassSet); } { CUpti_Profiler_Host_GetMetricsInSinglePassSet_Params params {CUpti_Profiler_Host_GetMetricsInSinglePassSet_Params_STRUCT_SIZE}; params.pChipName = pChipName; params.pSinglePassSetName = pSinglePassSet; params.numOfMetricsInSinglePassSet = metricsIndices.size(); params.pMetricsIndicesBuffer = metricsIndices.data(); params.metricsBufferSize = metricsBuffer.size(); params.pMetricsBuffer = metricsBuffer.data(); CUPTI_API_CALL(cuptiProfilerHostGetMetricsInSinglePassSet(¶ms)); } metricsList.resize(metricsIndices.size()); for (uint32_t i = 0; i < metricsIndices.size(); i++) { const auto metrixIndex = metricsIndices[i]; metricsList[i] = std::string((const char*)&metricsBuffer[metrixIndex]); } return CUPTI_SUCCESS; }
2.8.2. Configuration#
After users have selected the metrics to be profiled, they must create a configuration image before starting the profiling session. This image contains the scheduling details for the specified metrics, including how many passes are required to collect the profiling data and which metrics will be collected during each pass. Users can store the config image offline and can reuse it for profiling the same list of metrics and for the same chip.
Below image shows a very high level overview of config image content. As we can see the config image has scheduling information for 3 metrics (M1, M2, M3) when collected together, it takes 3 passes. Each metric has defined raw metrics (RM-X) which are scheduled to collect in respective passes.
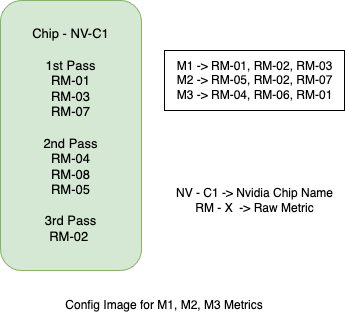
Note
For PM sampling the config image should be able to schedule the metric for collecting profiling data in
single pass, else CUPTI will report CUPTI_ERROR_NOT_SUPPORTED error.
APIs:
cuptiProfilerHostConfigAddMetrics(): Add a list of metrics which will be scheduled for profiling in the config image.cuptiProfilerHostGetConfigImageSize(): Once the metrics list is added, the user can call this API for getting how much memory will be allocated for storing the config image information.cuptiProfilerHostGetConfigImage(): The config image will be stored in the user allocated buffer.
Code Samples:
// Initialize profiler host

CUpti_Profiler_Host_ConfigAddMetrics_Params configAddMetricsParams {CUpti_Profiler_Host_ConfigAddMetrics_Params_STRUCT_SIZE};
configAddMetricsParams.pHostObject = profilerHostObjectPtr;
configAddMetricsParams.ppMetricNames = metricNames.data();
configAddMetricsParams.numMetrics = metricNames.size();
cuptiProfilerHostConfigAddMetrics(&configAddMetricsParams);

CUpti_Profiler_Host_GetConfigImageSize_Params getConfigImageSizeParams {CUpti_Profiler_Host_GetConfigImageSize_Params_STRUCT_SIZE};
getConfigImageSizeParams.pHostObject = profilerHostObjectPtr;
cuptiProfilerHostGetConfigImageSize(&getConfigImageSizeParams);

configImage.resize(getConfigImageSizeParams.configImageSize, 0);
CUpti_Profiler_Host_GetConfigImage_Params initializeConfigImageParams {CUpti_Profiler_Host_GetConfigImage_Params_STRUCT_SIZE};
initializeConfigImageParams.pHostObject = profilerHostObjectPtr;
initializeConfigImageParams.pConfigImage = configImage.data();
initializeConfigImageParams.configImageSize = configImage.size();
cuptiProfilerHostGetConfigImage(&initializeConfigImageParams);

// Deinitialize profiler host
NVLINK (nvl*), C2C, and PCIe metrics are collected at the device level, while all other metrics are collected at the context level.
Device-level metrics cannot be collected alongside context-level metrics. For device-level metrics, you need to pass an empty
counter availability image when setting up CUPTI profiler host APIs, which is required before creating the config image.
This limitation is addressed in the CUDA 13.1 release. To include device-level metrics in the image, set the parameter
bAllowDeviceLevelCounters in the CUpti_Profiler_GetCounterAvailability_Params structure.
2.8.3. Evaluation#
After collecting the profiling data, users must call the decode API for each profiling type (Range Profiling or PM Sampling) to decode the data stored in a hardware buffer into a user-allocated host buffer, known as the CounterData Image. This CounterData Image contains the profiling data for the queried metrics in an internal format, and users need to call the evaluation APIs to extract the data in a human-readable format.
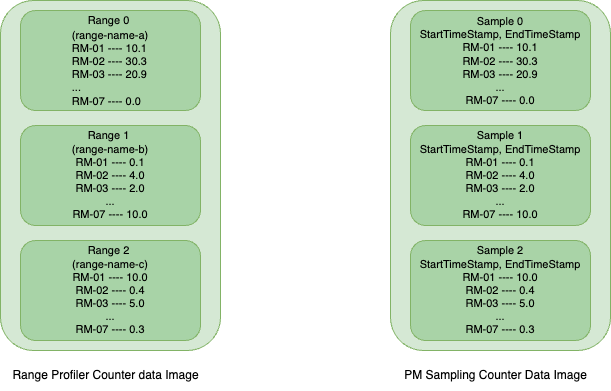
As shown in the above image which represents a very high level overview of how data is stored in a counter data image. For Range Profiling, each range is identified by a unique range name, whereas in PM Sampling, each sample is distinguished by its start and end timestamps.
APIs:
cuptiRangeProfilerGetCounterDataInfo(): In Range profiling, this API reports how many ranges have been profiled and stored in the counter data.
cuptiRangeProfilerCounterDataGetRangeInfo(): User can use this API for querying the range name for a particular range index in the counter data.
cuptiProfilerHostEvaluateToGpuValues(): Reports the profiling data for a list of metrics for a range index or sample index.Code Samples:
// Initialize profiler host

CUpti_RangeProfiler_GetCounterDataInfo_Params getCounterDataInfoParams {CUpti_RangeProfiler_GetCounterDataInfo_Params_STRUCT_SIZE};
getCounterDataInfoParams.pCounterDataImage = counterData;
getCounterDataInfoParams.counterDataImageSize = counterDataSize;
cuptiRangeProfilerGetCounterDataInfo(&getCounterDataInfoParams);
size_t numOfRanges = getCounterDataInfoParams.numTotalRanges;

metricNameValueMap.resize(metricNames.size());
for (size_t rangeIndex = 0; rangeIndex < numOfRanges; ++rangeIndex)
{
    CUpti_RangeProfiler_CounterData_GetRangeInfo_Params  getRangeInfoParams {CUpti_RangeProfiler_CounterData_GetRangeInfo_Params_STRUCT_SIZE};
    getRangeInfoParams.pCounterDataImage = counterData;
    getRangeInfoParams.counterDataImageSize = counterDataSize;
    getRangeInfoParams.rangeIndex = rangeIndex;
    getRangeInfoParams.rangeDelimiter = "/";
    cuptiRangeProfilerCounterDataGetRangeInfo(&getRangeInfoParams);

    std::vector<double> metricValues(metricNames.size());
    CUpti_Profiler_Host_EvaluateToGpuValues_Params evalauateToGpuValuesParams {CUpti_Profiler_Host_EvaluateToGpuValues_Params_STRUCT_SIZE};
    evalauateToGpuValuesParams.pHostObject = profilerHostObjectPtr;
    evalauateToGpuValuesParams.pCounterDataImage = counterData;
    evalauateToGpuValuesParams.counterDataImageSize = counterDataSize;
    evalauateToGpuValuesParams.ppMetricNames = metricNames.data();
    evalauateToGpuValuesParams.numMetrics = metricNames.size();
    evalauateToGpuValuesParams.rangeIndex = rangeIndex;
    evalauateToGpuValuesParams.pMetricValues = metricValues.data();
    cuptiProfilerHostEvaluateToGpuValues(&evalauateToGpuValuesParams);
}

// Deinitialize profiler host
2.9. CUPTI Range Profiling API#
Beginning with CUDA 12.6 Update 2, CUPTI has launched a new suite of high-level profiling APIs known as cuptiRangeProfiler*. These APIs are similar
to the previous cuptiProfiler* APIs, enabling users to collect profiling data for metrics at the CUDA context level. This uniformity in API calls
ensures alignment with other profiling components within CUPTI. Users can designate specific ranges within their applications to gather profiling
data on the GPU. These APIs are provided in the header file cupti_range_profiler.h.
The new APIs are compatible with Turing and newer GPU architectures (compute capability 7.5 and above) and require handling only two image types: the config image, which contains scheduling information for metrics, and the counter data image, where profiling data is stored after being decoded from the GPU. This method resembles the earlier profiler APIs and PM sampling APIs, involving both Host operations (enumeration, configuration, and evaluation) and Target operations (data collection).
2.9.1. Usage#
For Host tasks such as enumeration, configuration, and evaluation, please see the CUPTI Host API Usage section.
Collecting Profiling Data (collection):
Once you have the configuration image set up with all essential scheduling details, you can employ the range profiler APIs to gather profiling data. It is important to become familiar with the specific concepts related to range profiling before using these APIs.
Range Modes:
CUPTI offers two range modes to determine the definition of a profiler range:
Auto Range:
In this mode, each kernel launch is treated as an individual range. CUPTI assigns numeric values starting from 0 to these ranges while evaluating the collected data. Being defined around the boundary of a kernel, this mode includes a context synchronization at the end of each kernel launch, making operations synchronous. This can lead to problems like hang state, if there are dependencies between two kernel launches.
User Range:
In this mode, users can explicitly define ranges using Push/Pop APIs, allowing ranges to span multiple kernel launches. As a result, kernels can be launched asynchronously in this mode.
Replay Modes:
A metric includes various raw counters, which CUPTI gathers to generate the final metric value. Due to hardware limitations, some metrics need multiple replays. Replay mode is crucial for profiling multi-pass metric collections. For single-pass metrics, no replays are required; hence, replay modes can be disregarded.
Kernel Replay:
In this mode, a kernel is executed multiple times to gather complete profiling data, with CUPTI managing save/restore operations and launching the kernel several times. This replay mode is only supported in Auto Range Mode.
User Replay:
Users must save and restore the context state prior to replaying the range. This mode supports both Auto and User range modes. CUPTI has checkpoint APIs for managing save and restore of context data at a given time.
Application Replay:
Suitable for devices with limited memory, users relaunch the application using the same configuration image and intermediate counter data file to gather profiling data. This mode supports both Auto and User range modes.
Note
The application needs to have a deterministic runtime workload, else profiling data will be not correct.
Nested Ranges:
CUPTI allows nested Push/Pop range API calls, useful for detailed profiling. For example, Range A could encompass kernels A, B, and C, while Range B includes B and C, and Range C only includes C. Each range has an associated nesting level like for RangeA which is at base level is assigned to level 1 and nesting level for Range B and C are 2 and 3 respectively.
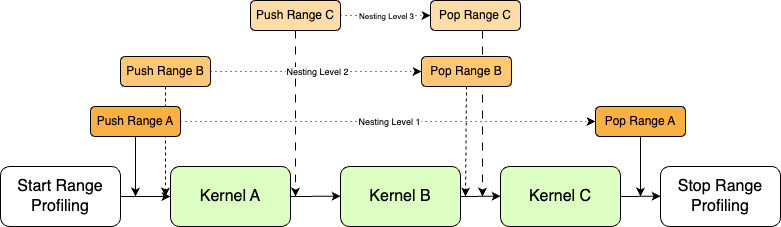
The Nested range is only allowed in User range mode and as the nesting level increases the number of replay required for collecting the profiling data for nested ranges also increases. In
CUpti_RangeProfiler_SetConfig_Paramsstruct numNestingLevels and minNestingLevel are specific to nested ranges where minNestingLevel will set the base level for the profiling session. The numNestingLevels parameters sets how many levels to be profiled starting from the base level in a profiling session; if set to 2 then only ranges in nesting level 1 and 2 will be profiled.
2.9.2. API usage#
Enable Range Profiling:
Before starting range profiling, enable it using
cuptiRangeProfilerEnable()for a CUDA context. This creates aCUpti_RangeProfiler_Object, which stores intermediate data and identifies other profiler APIs for the context.Create Counter Data Image:
Users need to allocate a CPU buffer for storing the decoded profiling data collected in the GPU. The buffer has to be in a specific format for storing the data and for this CUPTI exposes a set of APIs for getting the size of buffer required for storing the profiling data and once the buffer is allocated, CUPTI Initializes the data to default values.
cuptiRangeProfilerGetCounterDataSize(): For getting the size of buffer required based on metrics and number of ranges to be profiled in the application.cuptiRangeProfilerCounterDataImageInitialize(): This API initializes the buffer allocated by the user. This can also be used to reset the counter data image.
Set configuration:
Use
cuptiRangeProfilerSetConfig()API to customize the profiling configuration. Users must provide both the configuration and counter data images, along with parameters like range mode, replay mode, and the number of ranges per pass.Start Range Profiling:
After setting the configuration, call
cuptiRangeProfilerStart()API to define the profiling session’s boundary. Kernels outside this boundary will not be profiled.Push Range:
For User range mode, call
cuptiRangeProfilerPushRange()API to define the start of a range. Kernels launched between Push/Pop API calls will be profiled.Pop Range:
Use
cuptiRangeProfilerPopRange()API to mark the end of a range. Ensure the number of Pop range API calls matches the number of Push range calls to avoid errors.Note
CUPTI allows nested Push/Pop API calls for nested range profiling. Refer Nested Range Profiling.
Stop Range Profiling:
The
cuptiRangeProfilerStop()API sets the end of the boundary for range profiling. Along with that it also reports if all the passes for collecting profiling data for requested metrics are completed or not. If not then users need to replay the application or the Start/Stop boundary until all the passes are completed. For Kernel Replay mode, CUPTI internally replay the kernel so the allPassSubmitted parameter will always be 1. For application replay mode, it reports the current passIndex and targetNestingLevel which users need to set in thecuptiRangeProfilerSetConfig()API when the next replay is done.Decode Range Profiling data:
Profiling data stored in the GPU buffer must be decoded using
cuptiRangeProfilerDecodeData()API. This API adds a CUDA context synchronization before decoding.Note
If the number of ranges profiled in a pass is greater than the maximum limit of ranges can be stored in the counter data image then the ranges will be dropped and will be reported in the
cuptiRangeProfilerDecodeData()API.Disable Range Profiling:
Users need to call the
cuptiRangeProfilerDisable()API for destroying all the resources allocated by CUPTI for range profiling.
2.9.3. Sample code#
CUPTI ships a sample i.e. range_profiling, which showcases the API usage. The sample has two files range_profiling.h and range_profiling.cu.
For early prototypes users can simply take the range_profiling.h header file which has all the wrapper functions for host and target operations,
and use it in their application for collecting profiling data.
// Enable Range profiler
pRangeProfilerTarget->EnableRangeProfiler();

// Create CounterData Image
std::vector<uint8_t> counterDataImage;
pRangeProfilerTarget->CreateCounterDataImage(args.metrics, counterDataImage);

// Set range profiler configuration
pRangeProfilerTarget->SetConfig(CUPTI_AutoRange, CUPTI_KernelReplay, configImage,counterDataImage);

do
{
     // Start Range Profiling
     pRangeProfilerTarget->StartRangeProfiler();
     {
         // Push Range (Level 1)
         pRangeProfilerTarget->PushRange("VectorAdd");

         // Launch CUDA workload
         vectorLaunchWorkLoad.LaunchKernel();
         {

             // Push Range (Level 2)
             pRangeProfilerTarget->PushRange("Nested VectorAdd");

             vectorLaunchWorkLoad.LaunchKernel();

             // Pop Range (Level 2)
             pRangeProfilerTarget->PopRange();
         }

         // Pop Range (Level 1)
         pRangeProfilerTarget->PopRange();
     }

     vectorLaunchWorkLoad.LaunchKernel();

     // Stop Range Profiling
     pRangeProfilerTarget->StopRangeProfiler();
}
while (!pRangeProfilerTarget->IsAllPassSubmitted());

// Get Profiler Data
pRangeProfilerTarget->DecodeCounterData();

// Evaluate the results
size_t numRanges = 0;
pCuptiProfilerHost->GetNumOfRanges(counterDataImage, numRanges);
for (size_t rangeIndex = 0; rangeIndex < numRanges; ++rangeIndex) {
     pCuptiProfilerHost->EvaluateCounterData(rangeIndex, args.metrics, counterDataImage);
}

pCuptiProfilerHost->PrintProfilerRanges();

// Clean up
pRangeProfilerTarget->DisableRangeProfiler();
2.10. CUPTI PC Sampling API#
CUPTI supports periodic sampling of the warp program counter and warp scheduler state. At a fixed interval of cycles, the sampler in each streaming multiprocessor (SM) selects an active warp and records both its program counter and the warp scheduler state. The sampler selects a random active warp, while the scheduler may select a different warp to issue in the same cycle. The collected metrics can be correlated with the executed instructions, but they lack time resolution.
Metrics can be collected in continuous mode, which does not interrupt kernel execution and incurs minimal runtime overhead.
These APIs are provided in the header file cupti_pcsampling.h. Additionally, a utility library is provided in the
header file cupti_pcsampling_util.h which has APIs for correlating GPU assembly to CUDA-C source code and for reading
and writing the PC sampling data to files.
The PC sampling APIs are available on Turing and later GPU architectures (compute capability 7.5 and above).
Overview of Features:
Two sampling modes – Continuous (concurrent kernels) or Serialized (one kernel at a time).
Option to collect specific stall reasons.
Ability to collect GPU PC sampling data for entire application duration or for specific CPU code ranges (defined by start and stop APIs).
API to flush GPU PC sampling data.
APIs to support Offline and Runtime correlation of GPU PC samples to CUDA C source lines and GPU assembly instructions.
Samples are provided to demonstrate how to write the injection library to collect the PC sampling information, and how to parse the generated files using the utility APIs to print the stall reasons counter values and associate those with the GPU assembly instructions and CUDA-C source code. Refer to the samples pc_sampling_continuous, pc_sampling_utility and pc_sampling_start_stop.
2.10.1. Configuration Attributes#
The following table lists the PC sampling configuration attributes which can be set using the cuptiPCSamplingSetConfigurationAttribute() API.
Configuration Attribute |
Description |
Default Value |
Comparison of PC Sampling APIs with CUPTI PC Sampling Activity APIs |
Guideline to Tune Configuration Option |
|---|---|---|---|---|
Collection mode |
PC Sampling collection mode - Continuous or Kernel Serialized |
Continuous |
Continuous mode is new. Kernel Serialized mode is equivalent to the kernel level functionality provided by the CUPTI PC sampling Activity APIs. |
|
Sampling period |
Sampling period for PC Sampling. Valid values for the sampling periods are between 5 to 31 both inclusive. This will set the sampling period to (2^samplingPeriod) cycles. e.g. for sampling period = 5 to 31, cycles = 32, 64, 128,…, 2^31 |
CUPTI defined value is based on number of SMs |
Dropped current support for 5 levels(MIN, LOW, MID, HIGH, MAX) for sampling period. The new “sampling period” is equivalent to the “samplingPeriod2” field in CUpti_ActivityPCSamplingConfig. |
Low sampling period means a high sampling frequency which can result in dropping of samples. Very high sampling period can cause low sampling frequency and no sample generation. |
Stall reason |
Stall reasons to collect Input is a pointer to an array of the stall reason indexes to collect. |
All stall reasons will be collected |
With the CUPTI PC sampling Activity APIs there is no option to select which stall reasons to collect. Also the list of supported stall reasons has changed. |
|
Scratch buffer size |
Size of SW buffer for raw PC counter data downloaded from HW buffer. Approximately it takes 16 Bytes (and some fixed size memory) to accommodate one PC with one stall reason e.g. 1 PC with 1 stall reason = 32 Bytes 1 PC with 2 stall reason = 48 Bytes 1 PC with 4 stall reason = 96 Bytes |
1 MB (which can accommodate approximately 5500 PCs with all stall reasons) |
New |
Clients can choose scratch buffer size as per memory budget. Very small scratch buffer size can cause runtime overhead as more iterations would be required to accommodate and process more PC samples |
Hardware buffer size |
Size of HW buffer in bytes. If sampling period is too less, HW buffer can overflow and drop PC data |
512 MB |
New |
Device accessible buffer for samples. Less hardware buffer size with low sampling periods, can cause overflow and dropping of PC data. High hardware buffer size can impact application execution due to lower amount of device memory being available |
Enable start/stop control |
Control over PC Sampling data collection range. 1 - Allows user to start and stop PC Sampling using APIs |
0 (disabled) |
New |
2.10.2. Stall Reasons Mapping Table#
The table below lists the stall reasons mapping from PC Sampling Activity APIs to PC Sampling APIs. Note: Stall reasons with suffix _not_issued represents latency samples. These samples indicate that no instruction was issued in that cycle from the warp scheduler from where the warp was sampled.
PC Sampling Activity API Stall Reasons (common prefix: CUPTI_ACTIVITY_PC_SAMPLING_STALL_) |
PC Sampling API Stall Reasons (common prefix: smsp__pcsamp_warps_issue_stalled_) |
|---|---|
NONE |
selected selected_not_issued |
INST_FETCH |
branch_resolving branch_resolving_not_issued no_instructions no_instructions_not_issued |
EXEC_DEPENDENCY |
short_scoreboard short_scoreboard_not_issued wait wait_not_issued |
MEMORY_DEPENDENCY |
long_scoreboard long_scoreboard_not_issued |
TEXTURE |
tex_throttle tex_throttle_not_issued |
SYNC |
barrier barrier_not_issued membar membar_not_issued |
CONSTANT_MEMORY_DEPENDENCY |
imc_miss imc_miss_not_issued |
PIPE_BUSY |
mio_throttle mio_throttle_not_issued math_pipe_throttle math_pipe_throttle_not_issued |
MEMORY_THROTTLE |
drain drain_not_issued lg_throttle lg_throttle_not_issued |
NOT_SELECTED |
not_selected not_selected_not_issued |
OTHER |
misc misc_not_issued dispatch_stall dispatch_stall_not_issued |
SLEEPING |
sleeping sleeping_not_issued |
For PC Sampling APIs, total (smsp__pcsamp_sample_count) and dropped (smsp__pcsamp_samples_data_dropped) sample counts are collected by default.
2.10.3. Data Structure Mapping Table#
The table below lists the data structure mapping from PC Sampling Activity APIs to PC Sampling APIs.
PC Sampling Activity API structures |
PC Sampling API structures |
|---|---|
CUpti_ActivityPCSamplingConfig |
CUpti_PCSamplingConfigurationInfo |
CUpti_ActivityPCSamplingStallReason |
CUpti_PCSamplingStallReason |
CUpti_ActivityPCSampling3 |
CUpti_PCSamplingPCData |
CUpti_ActivityPCSamplingRecordInfo |
CUpti_PCSamplingData |
2.10.4. Data flushing#
CUPTI clients can periodically flush GPU PC sampling data using the API cuptiPCSamplingGetData(). Besides periodic flushing of GPU PC sampling data, CUPTI clients need to also flush the GPU PC sampling data at the following points to maintain the uniqueness of PCs:
For continuous collection mode CUPTI_PC_SAMPLING_COLLECTION_MODE_CONTINUOUS - after each module load-unload-load sequence.
For serialized collection mode CUPTI_PC_SAMPLING_COLLECTION_MODE_KERNEL_SERIALIZED - after completion of each kernel.
For range profiling using the configuration option CUPTI_PC_SAMPLING_CONFIGURATION_ATTR_TYPE_ENABLE_START_STOP_CONTROL - at the end of the range i.e. after
cuptiPCSamplingStop()API.
If application is profiled in the continuous collection mode with range profiling disabled, and there is no module unload, CUPTI clients can collect data in two ways:
By using
cuptiPCSamplingGetData()API periodically.By using
cuptiPCSamplingDisable()on application exit and reading GPU PC sampling data from sampling data buffer passed during configuration.
Note
In case, cuptiPCSamplingGetData() API is not called periodically, the sampling data buffer passed during configuration should be big enough to hold the data for all the PCs.
Note
Field remainingNumPcs of the struct CUpti_PCSamplingData helps in identifying the number of PC records available with CUPTI. User can adjust the periodic flush interval based on it. Further user need to ensure that all remaining records can be accommodated in the sampling data buffer passed during configuration before disabling the PC sampling.
2.10.5. SASS Source Correlation#
Building SASS source correlation for a PC can be split into two parts:
Correlation of a PC to a SASS instruction - PC to SASS correlation is done during PC sampling at run time and the SASS data is available in the PC record. Fields
cubinCrc,pcOffsetandfunctionNamein the PC record help in correlation of a PC with a SASS instruction. You can extract cubins from the application executable or library using thecuobjdumputility by executing the commandcuobjdump -xelf all exe/lib. The cuobjump utility version should match with the CUDA Toolkit version used to build the CUDA application executable or library files. You can find the cubinCrc for extracted cubins using thecuptiGetCubinCrc()API. With the help of cubinCrc you can find out the cubin to which a PC belongs. The cubin can be disassembled using thenvdisasmutility that comes with the CUDA toolkit.Correlation of a SASS instruction to a CUDA source line - Correlation of GPU PC samples to CUDA C source lines can be done offline as well as at runtime with the help of the
cuptiGetSassToSourceCorrelation()API.
JIT compiled cubins - In case of JIT compiled cubins, it is not possible to extract the cubin from the executable or library. For this case one can subscribe to one of the CUPTI_CBID_RESOURCE_MODULE_LOADED or CUPTI_CBID_RESOURCE_MODULE_UNLOAD_STARTING or CUPTI_CBID_RESOURCE_MODULE_PROFILED callbacks. It returns a CUpti_ModuleResourceData structure having the CUDA binary. This binary can be stored in a file and can be used for offline CUDA C source correlation.
2.10.6. API Usage#
Here is a pseudo code which shows how to collect the PC sampling data for specific CPU code ranges:
void Collection()
{
    // Select collection mode
    CUpti_PCSamplingConfigurationInfoParams pcSamplingConfigurationInfoParams = {};

    CUpti_PCSamplingConfigurationInfo collectionMode = {};
    collectionMode.attributeData.collectionModeData.collectionMode = CUPTI_PC_SAMPLING_COLLECTION_MODE_CONTINUOUS;

    pcSamplingConfigurationInfoParams.numAttributes = 1;
    pcSamplingConfigurationInfoParams.pPCSamplingConfigurationInfo = &collectionMode;
    cuptiPCSamplingSetConfigurationAttribute(&pcSamplingConfigurationInfoParams);

    // Select stall reasons to collect
    {
        // Get number of supported stall reasons
        cuptiPCSamplingGetNumStallReasons();
        // Get number of supported stall reason names and corresponding indexes
        cuptiPCSamplingGetStallReasons();
        // Set selected stall reasons
        cuptiPCSamplingSetConfigurationAttribute();
    }

    // Select code range using start/stop APIs
    // Opt-in for start and stop PC Sampling using APIs cuptiPCSamplingStart and cuptiPCSamplingStop
    CUpti_PCSamplingConfigurationInfo enableStartStop = {};
    enableStartStop.attributeType = CUPTI_PC_SAMPLING_CONFIGURATION_ATTR_TYPE_ENABLE_START_STOP_CONTROL;
    enableStartStop.attributeData.enableStartStopControlData.enableStartStopControl = true;

    pcSamplingConfigurationInfoParams.numAttributes = 1;
    pcSamplingConfigurationInfoParams.pPCSamplingConfigurationInfo = &enableStartStop;
    cuptiPCSamplingSetConfigurationAttribute(&pcSamplingConfigurationInfoParams);

    // Enable PC Sampling
    cuptiPCSamplingEnable();

    kernelA <<<blocks, threads, 0, s0>>>(...);                  // KernelA is not sampled

    // Start PC sampling collection
    cuptiPCSamplingStart();
    {
        // KernelB and KernelC might run concurrently since 'continuous' sampling collection mode is selected
        kernelB <<<blocks, threads, 0, s0>>>(...);              // KernelB is sampled
        kernelC <<<blocks, threads, 0, s1>>>(...);              // KernelC is sampled
    }
    // Stop PC sampling collection
    cuptiPCSamplingStop();
    // Flush PC sampling data
    cuptiPCSamplingGetData();

    kernelD <<<blocks, threads, 0, s0>>>(...);                  // KernelD is not sampled

    // Start PC sampling collection
    cuptiPCSamplingStart();
    {
        kernelE <<<blocks, threads, 0, s0>>>(...);              // KernelE is sampled
    }
    // Stop PC sampling collection
    cuptiPCSamplingStop();
    // Flush PC sampling data
    cuptiPCSamplingGetData();

    // Disable PC Sampling
    cuptiPCSamplingDisable();
}
2.10.7. Limitations#
Known limitations and issues:
PC Sampling APIs don’t support simultaneous sampling of multiple CUDA contexts on a GPU. However, simultaneous sampling of single CUDA context per GPU is supported. Before enabling and configuring the PC sampling on a different CUDA context on the same GPU, PC sampling needs to be disabled on the other context.
2.11. CUPTI SASS Metric API#
The SASS metric APIs support collecting metric data at SASS assembly instruction level. These support a larger set of SASS instruction level metrics compared to the CUPTI Activity APIs. The set of sass metrics supported for each GPU architecture can be queried. These APIs are supported on Turing and later GPU architectures, i.e. devices with compute capability 7.5 and higher. These APIs are provided in the header file cupti_sass_metrics.h.
These APIs support SASS instruction to CUDA C source line correlation in offline mode. Hence the runtime overhead during data collection is lower.
2.11.1. API usage#
Enumerate metrics: Use the API
cuptiSassMetricsGetNumOfMetrics()for the number of metrics supported by the chip. Then allocate the buffer of typeCUpti_SassMetrics_MetricDetailsand pass it to the APIcuptiSassMetricsGetMetrics()where CUPTI will list out all the SASS metrics and put it in the user-allocated buffer.Create config image: For all the selected SASS metrics, create a list of
CUpti_SassMetrics_Configstructures. For creating the config buffer for a metric we need the metric id and the output granularity for the metric. The metric id can be queried by using the APIcuptiSassMetricsGetProperties(). The output granularity tells at what level data will be collected. CUPTI supports collection at three levels -CUPTI_SASS_METRICS_OUTPUT_GRANULARITY_GPU (at GPU level),
CUPTI_SASS_METRICS_OUTPUT_GRANULARITY_SM (at Streaming Multiprocessor level, the metric instance count will be the number of SMs present in the chip),
CUPTI_SASS_METRICS_OUTPUT_GRANULARITY_SMSP (SM sub-partition level, the number of instances will be the sum of all the SMSP present in the chip i.e num of SMs * num of sub-partitions in each SM)
Set config for the CUDA device: API
cuptiSassMetricsSetConfig()should be used for setting the config on the device for SASS metrics collection. This API takes the device index and list ofCUpti_SassMetrics_Configstructs as input parameters. Then set the config for the device on which the kernel is running else CUPTI will report aCUPTI_ERROR_INVALID_OPERATIONerror.Enable SASS metric profiling: After setting the config for the CUDA device one needs to enable SASS patching for the context on which the kernel will be launched using the API
cuptSassMetricsEnable(). CUPTI provides control over when the kernel will be patched. For Lazy patching mode, CUPTI will only patch the kernel at the first launch instance and then unpatch the kernel when the APIcuptiSassMetricsDisableis called. Otherwise, CUPTI will patch all the kernels in the module for the context, regardless of whether kernels would be launched in the enable/disable range. Set theenableLazyPatchingflag to enable the lazy patching mode for profiling. Lazy patching is suitable for applications that have a large number of kernels in the module and a small set of kernels are launched.Flush SASS metric profiling data: Once kernel execution is completed, metric data is stored in an internal format. One needs to query the size of the buffer to store the metrics data. API
cuptiSassMetricsGetDataProperties()can be used to query the number of patched instructions and the number of hardware instances. Then allocate the buffer based on retrieved data, where CUPTI will flush the profiled metric data. For flushing the data, call the APIcuptiSassMetricsFlushData().Disable SASS metric profiling: Once the profiling of the kernel is done, call the API
cuptiSassMetricsDisable()for resetting the patched kernel and remove all the profiled metric data which has been collected for the kernels. One thing to note is that CUPTI will remove all the metric data which has been collected for kernels launched since the APIcuptiSassMetricsFlushData()call. So it is the user’s responsibility to call flush data API for retrieving all the metric data. Calling APIcuptiSassMetricsFlushData()aftercuptiSassMetricsDisable()will report the errorCUPTI_ERROR_INVALID_OPERATION.Unset configuration for the CUDA device: CUPTI maintains internal state for each CUDA device for which SASS metric collection is enabled. API
cuptiSassMetricsUnsetConfig()should be called to clean-up the state. This API should be called for each device for which SASS metric collection has been configured.
2.11.2. Sample code#
CUPTI sample sass_metric has two core functions – function ListSupportedMetrics() shows how to enumerate all metrics supported by the chip and function CollectSassMetrics() show how to collect SASS metrics. Code snippet for enumerating SASS metrics (refer the ListSupportedMetrics() function in the CUPTI sass_metric sample):
CUpti_Device_GetChipName_Params getChipParams{ CUpti_Device_GetChipName_Params_STRUCT_SIZE };
cuptiDeviceGetChipName(&getChipParams);

CUpti_SassMetrics_GetNumOfMetrics_Params getNumOfMetricParams;
getNumOfMetricParams.pChipName = getChipParams.pChipName;
cuptiSassMetricsGetNumOfMetrics(&getNumOfMetricParams);

std::vector<CUpti_SassMetrics_MetricDetails> supportedMetrics(getNumOfMetricParams.numOfMetrics);
CUpti_SassMetrics_GetMetrics_Params getMetricsParams {CUpti_SassMetrics_GetMetrics_Params_STRUCT_SIZE};
getMetricsParams.pChipName = getChipParams.pChipName;
getMetricsParams.pMetricsList = supportedMetrics.data();
getMetricsParams.numOfMetrics = supportedMetrics.size();
cuptiSassMetricsGetMetrics(&getMetricsParams);
for (size_t i = 0; i < supportedMetrics.size(); ++i)
{
    std::cout << "Metric Name: " << supportedMetrics[i].pMetricName
            << ", MetricID: " << supportedMetrics[i].metricId
            << ", Metric Description: " << supportedMetrics[i].pMetricDescription << "\n";
}
Code snippet for collecting SASS metrics (refer the CollectSassMetrics() function in the CUPTI sass_metric sample):
cuptiSassMetricsSetConfig();

// Enable SASS Patching
sassMetricsEnableParams.enableLazyPatching = 1;
cuptiSassMetricsEnable();

// As lazy patching has been enabled, VectorAdd will be patched here at the first launch instance
VectorAdd<<<gridSize, blockSize>>>();

cuptiSassMetricsGetDataProperties();

if (getDataPropParams.numOfInstances != 0 && getDataPropParams.numOfPatchedInstructionRecords != 0)
{
    // allocate memory for getting patched data.

    flushDataParams.numOfInstances = getDataPropParams.numOfInstances;
    flushDataParams.numOfPatchedInstructionRecords = getDataPropParams.numOfPatchedInstructionRecords;
    flushDataParams.pMetricsData =
            (CUpti_SassMetrics_Data*)malloc(getDataPropParams.numOfPatchedInstructionRecords * sizeof(CUpti_SassMetrics_Data));

    for (size_t recordIndex = 0;
         recordIndex < getDataPropParams.numOfPatchedInstructionRecords;
         ++recordIndex)
    {
        flushDataParams.pMetricsData[recordIndex].pInstanceValues =
            (CUpti_SassMetrics_InstanceValue*) malloc(getDataPropParams.numOfInstances * sizeof(CUpti_SassMetrics_InstanceValue));
    }

    cuptiSassMetricsFlushData();
    // Store the data for post-processing the data (e.g. SASS to source correlation)
    // Cleanup memory
}

// As this is the first VectorSub launch, the patching will be done here.
VectorSub<<<gridSize, blockSize>>>();

// As cuptiSassMetricsFlushData() API is not called, VectorSub SASS metric data will be discarded.
// All the kernels which were patched earlier will be reset to its original state.
cuptiSassMetricsDisable();

// VectorMultiply function will not get patched as it is called outside the enable/disable range.
VectorMultiply<<<gridSize, blockSize>>>();

cuptiSassMetricsUnsetConfig();
2.12. CUPTI PM Sampling API#
In the CUDA 12.6 release, CUPTI introduced new PM sampling APIs which are included in the header file cupti_pmsampling.h for collecting a set
of metrics by sampling the GPU’s performance monitors (PM) periodically at fixed intervals. Each sample is composed of metric values and the
GPU timestamp when it was collected in nanoseconds.
These APIs are supported on Turing and later GPU architectures, i.e. devices with compute capability 7.5 and higher.
PM sampling follows a similar approach to range profiling, where the process is divided into 2 types of operations i.e. host (enumeration, configuration, evaluation) and target(collection).
2.12.1. API usage#
Enumerate metrics (enumeration):
CUPTI released a new set of host APIs with
cuptiProfilerHostprefix, where users need to create a profiler host object for all the host operations. For PM sampling specific host operation, users need to set the profilerType toCUPTI_PROFILER_TYPE_PM_SAMPLINGin theCUpti_Profiler_Host_Initialize_Paramsobject.CUPTI has following host APIs for enumerating metrics and it properties:
cuptiProfilerHostGetBaseMetrics()for listing base metrics for a metric type (counter, throughput and ratio).cuptiProfilerHostGetSubMetrics()for listing the submetric for a metric.cuptiProfilerHostGetMetricProperties()for querying the details about a metric like associated hardware unit, metric type and a short description about the metric.CUPTI lists some of the useful metrics in the PM Sampling Metric Table which can be used for initial metric selection which list out various GPU and its component attributes like SM active cycles, GPC and SYS clock frequency and many more.
In the CUDA 13.2 release, CUPTI added new concept of single pass metric sets which are predefined sets of metrics that can be collected in a single pass. Refer to the Single Pass Metric Sets section for more details like APIs and code samples.
Create config image (configuration):
Similar to range profiler, for collecting PM sampling data users need to create a config image blob which will have scheduling information for metrics which were selected for collection. As configuration is a host operation similar to enumeration, users need to initialize the profiler host object before calling any of the configuration APIs.
For creating a config image, CUPTI exposes new profiler host APIs like
cuptiProfilerHostConfigAddMetrics()API where users will pass the list of metrics as input and then callcuptiProfilerHostGetConfigImageSize()API for getting the size of config image which user need to allocate and finally call thecuptiProfilerHostGetConfigImage()API where users can pass the allocated buffer for storing the scheduling information in the config image.CUPTI also adds another optional API i.e.
cuptiProfilerHostGetNumOfPasses()for checking the number of passes required for collecting the sampling data for a given config image.When users select metrics from a single pass metric set, they need to pass the set name as input for
pSinglePassMetricSetNameparameter in theCUpti_Profiler_Host_Initialize_Paramsobject in thecuptiProfilerHostInitialize()API, which initializes the profiler host object for creating the config image and based on that CUPTI schedules the metrics for collecting it in a single pass.Note
Config images which need more than one pass for collecting sampling data are not supported.
Collecting Sampling Data (collection):
This operation instructs CUPTI to begin collecting sampling data on a CUDA device at specific intervals or cycles, determined by the trigger type specified in the
cuptiPmSamplingSetConfig()API.Collection phase can be divided into 6 subparts:
Enable PM Sampling:
This is the entry point of the PM sampling process where the user passes the device index on which sampling data will be collected. Use the
cuptiPmSamplingEnable()API to create aCUpti_PmSampling_Objectobject. This stores all the intermediate data and act as an identifier for other target APIs.Set configuration:
CUPTI has
cuptiPmSamplingSetConfig()API for customizing configuration to the PM sampling process like hardware buffer size where the raw sampling data will be stored, sampling interval specifies the frequency at which sampling triggers will collect the sampling data. This will vary depending on the trigger mode set in the config API. Along with these parameters users need to pass the config image which has the scheduling information, which has been created earlier in the configuration phase.The maximum sampling frequency without buffer overflow events depends on GPU (SM count), GPU load intensity, and overall system load. The bigger the chip and the higher the load, the lower the maximum frequency. If you need higher frequency, you can increase it until you get the overflow event which can be queried while decoding the pm sampling data using
cuptiPmSamplingDecodeData()API.CUPTI supports two trigger modes,
GPU_SYSCLK_INTERVALwhich is based on sys clock frequency and the sample intervals are in terms of clock cycles. And the 2nd one isGPU_TIME_INTERVALwhich has fixed frequency and the intervals are in terms of nanoseconds.Note
The
GPU_TIME_INTERVALtrigger is not supported in Turing and GA100 chips.Start PM Sampling:
After enabling and setting up the configuration for the PM sampling, users need to call the
cuptiPmSamplingStart()API which signals CUPTI to start the collection, the raw sampling data will be stored in the hardware buffer.Stop PM Sampling:
Users need to call the
cuptiPmSamplingStop()API for stopping the collection of sampling data.Decode PM Sampling data:
While collection phase all the raw sampling data will be stored in the hardware buffer. CUPTI exposes
cuptiPmSamplingDecodeData()API which decodes the raw data and stores it in a counter data image which users need to pass into the API as input. For creating the counter data image refer to this.It is users responsibility to call this decode API for freeing up the hardware buffer for allowing new raw data to get stored in the hardware buffer. This API also outputs some attributes like hardware buffer overflow status, decode stop reasons like end of all the raw data or if the counter data image passed is full. So for long running workload users can call this decode API between the Start and Stop API. The ideal way would be calling it in a separate thread. Refer pm_sampling public sample which shows the decode operation running in parallel with the collection.
Disable PM Sampling:
For destroying all the resources allocated for PM sampling and ending the PM sampling users can call the
cuptiPmSamplingDisable()API.Create Counter data image:
For storing the decoded data and using it in the evaluation phase users need to allocate a buffer which CUPTI refer as counter data image. Creating a counter data image is a target operation and should be done after enabling the PM sampling and before calling the decode API call. For creating the counter buffer image, first users need to call
cuptiPmSamplingGetCounterDataSize()API for getting the size of buffer needed for allocation. Once users allocate the buffer the buffer needs to be in counter data format where the samples will be stored so to initialize the buffer users have to callcuptiPmSamplingCounterDataImageInitialize()API. This same API can also be used to reset the counter buffer image.
Evaluating Counter Data (evaluation):
Once the raw data is decoded to counter buffer image, users need to use profiler host APIs for evaluating the counter data for getting sample data in readable format. Users can query the number of completed samples in the counter data using the
cuptiPmSamplingGetCounterDataInfo()API. For PM sampling each sample is defined by its start and end time stamps. For getting sample info like start and end timestamps CUPTI hascuptiPmSamplingCounterDataGetSampleInfo()API. The timestamps reported are CPU based time stamps. Then to get the collected metrics values for the sample,cuptiProfilerHostEvaluateToGpuValues()API is used.Note
It is a known limitation that the first sample may occasionally contain outlier values. Discarding the first sample is recommended.
2.12.2. Sample code#
CUPTI sample pm_sampling has two core functions – function PmSamplingQueryMetrics() shows how to enumerate all metrics supported by the chip and function PmSamplingCollection() show how to collect PM sampling data for a list of metrics while launching CUDA workloads. Code snippet for enumerating supported PM sampling metrics (refer the PmSamplingQueryMetrics() function in the CUPTI pm_sampling sample):
CUpti_Device_GetChipName_Params getChipParams{ CUpti_Device_GetChipName_Params_STRUCT_SIZE };
cuptiDeviceGetChipName(&getChipParams);

CUpti_Profiler_Host_Initialize_Params hostInitializeParams = {CUpti_Profiler_Host_Initialize_Params_STRUCT_SIZE};
hostInitializeParams.profilerType = CUPTI_PROFILER_TYPE_PM_SAMPLING;
hostInitializeParams.pChipName = m_chipName.c_str();
hostInitializeParams.pCounterAvailabilityImage = counterAvailibilityImage.data();
cuptiProfilerHostInitialize(&hostInitializeParams);
m_pHostObject = hostInitializeParams.pHostObject;

for (size_t metricTypeIndex = 0; metricTypeIndex < CUPTI_METRIC_TYPE__COUNT; ++metricTypeIndex)
{
    CUpti_Profiler_Host_GetBaseMetrics_Params getBaseMetricsParams {CUpti_Profiler_Host_GetBaseMetrics_Params_STRUCT_SIZE};
    getBaseMetricsParams.pHostObject = m_pHostObject;
    getBaseMetricsParams.metricType = (CUpti_MetricType)metricTypeIndex;
    cuptiProfilerHostGetBaseMetrics(&getBaseMetricsParams);

    for (size_t metricIndex = 0; metricIndex < getBaseMetricsParams.numMetrics; ++metricIndex) {
        metricsList.push_back(getBaseMetricsParams.ppMetricNames[metricIndex]);
    }
}

CUpti_Profiler_Host_Deinitialize_Params deinitializeParams = {CUpti_Profiler_Host_Deinitialize_Params_STRUCT_SIZE};
deinitializeParams.pHostObject = m_pHostObject;
cuptiProfilerHostDeinitialize(&deinitializeParams);
Code snippet for collecting PM sampling data (refer the PmSamplingCollection() function in the CUPTI pm_sampling sample):
void PmSamplingCollection()
{
    // 1. Create config image
    std::vector<uint8_t> configImage;
    CreateConfigImage(configImage, metrics);

    // 2. Enable PM sampling and set config for the PM sampling data collection.
    EnablePmSampling(deviceIndex);
    SetConfig(configImage, hardwareBufferSize, samplingInterval);

    // 3. Create counter data image
    std::vector<uint8_t> counterDataImage;
    CreateCounterDataImage(maxSamples, metrics, counterDataImage);

    VectorLaunchWorkLoad vectorWorkLoad;
    vectorWorkLoad.SetUp();

    // 4. Start the PM sampling and launch the CUDA workload
    StartPmSampling();

    // 5. Launch the kernel NUM_OF_ITERATIONS times
    const size_t NUM_OF_ITERATIONS = 100000;
    for (size_t ii = 0; ii < NUM_OF_ITERATIONS; ++ii)
    {
        vectorWorkLoad.LaunchKernel();
    }
    cudaDeviceSynchronize();

    // 6. Stop the PM sampling and join the decode thread
    StopPmSampling();

    // 7. Decode PM Sampling Data
    DecodeCounterData(counterDataImage);

    // 8. Print the sample ranges for the collected metrics
    PrintSampleRanges(counterDataImage);

    // 9. Disable PM Sampling
    DisablePmSampling();
}

// PrintSampleRanges function
void PrintSampleRanges(std::vector<uint8_t> counterDataImage)
{
    CUpti_PmSampling_GetCounterDataInfo_Params counterDataInfo {CUpti_PmSampling_GetCounterDataInfo_Params_STRUCT_SIZE};
    counterDataInfo.pCounterDataImage = counterDataImage.data();
    counterDataInfo.counterDataImageSize = counterDataImage.size();
    cuptiPmSamplingGetCounterDataInfo(&counterDataInfo);

    for (size_t sampleIndex = 0; sampleIndex < counterDataInfo.numCompletedSamples; ++sampleIndex)
    {
        pmSamplingHost.EvaluateCounterData(sampleIndex, metricsList, counterDataImage);
    }

    // For reusing the counter data image, reset the counter data image
    ResetCounterDataImage(counterDataImage);
}
2.12.3. Metrics Table#
PM sampling supports the collection of a wide variety of metrics. The table below lists some useful metrics that provide insights into the utilization of different units in the GPU.
Metric Name |
Metric details |
|---|---|
gpc__cycles_elapsed.avg.per_second |
GPC Clock Frequency: The average GPC clock frequency in hertz. |
sys__cycles_elapsed.avg.per_second |
SYS Clock Frequency: The average SYS clock frequency in hertz. The GPU front end (command processor), copy engines, and the performance monitor run at the SYS clock. On Turing and NVIDIA GA100 GPUs the sampling frequency is based upon a period of SYS clocks (not time) so samples per second will vary with SYS clock. On NVIDIA GA10x GPUs the sampling frequency is based upon a fixed frequency clock. The maximum frequency scales linearly with the SYS clock. |
gr__cycles_active.sum.pct_of_peak_sustained_elapsed |
GR Active: The percentage of cycles the compute engine is active. The compute engine is active if there is any work in the compute pipe. |
gr__dispatch_count.avg.pct_of_peak_sustained_elapsed |
Dispatch Started: The ratio of compute grid launches (dispatches) to the compute pipe to the maximum sustained rate of the compute pipe. |
tpc__warps_inactive_sm_active_realtime.avg.pct_of_peak_sustained_elapsed |
Active SM Unused Warp Slots: The ratio of inactive warp slots on the SMs to the maximum number of warps per SM as a percentage. This is an indication of how many more warps may fit on the SMs if occupancy is not limited by a resource such as max warps of a shader type, shared memory, registers per thread, or thread blocks per SM. |
tpc__warps_inactive_sm_idle_realtime.avg.pct_of_peak_sustained_elapsed |
Idle SM Unused Warp Slots: The ratio of inactive warps slots due to idle SMs to the the maximum number of warps per SM as a percentage. This is an indicator that the current workload on the SM is not sufficient to put work on all SMs. This can be due to either CPU starving the GPU, current work is too small to saturate the GPU or current work is trailing off but blocking next work. |
sm__cycles_active.avg.pct_of_peak_sustained_elapsed |
SMs Active: The ratio of cycles SMs had at least 1 warp in flight (allocated on SM) to the number of cycles as a percentage. A value of 0 indicates all SMs were idle (no warps in flight). A value of 50% can indicate some gradient between all SMs active 50% of the sample period or 50% of SMs active 100% of the sample period. |
sm__inst_executed_realtime.avg.pct_of_peak_sustained_elapsed |
SM Issue: The ratio of cycles that SM sub-partitions (warp schedulers) issued an instruction to the number of cycles in the sample period as a percentage. |
sm__pipe_tensor_cycles_active_realtime.avg.pct_of_peak_sustained_elapsed |
Tensor Active: The ratio of cycles the SM tensor pipes were active issuing tensor instructions to the number of cycles in the sample period as a percentage. This metric is not available on Turing GPUs for periodic sampling. |
sm__pipe_shared_cycles_active_realtime.avg.pct_of_peak_sustained_elapsed |
Tensor Active / FP16 Active: The ratio of cycles the SM tensor pipes or FP16x2 pipes were active issuing tensor instructions to the number of cycles in the sample period as a percentage. This metric is only available for Turing GPUs for periodic sampling. |
dramc__read_throughput.avg.pct_of_peak_sustained_elapsed |
DRAM Read Bandwidth: The ratio of cycles the DRAM interface was active reading data to the elapsed cycles in the same period as a percentage. |
dramc__write_throughput.avg.pct_of_peak_sustained_elapsed |
DRAM Write Bandwidth: The ratio of cycles the DRAM interface was active writing data to the elapsed cycles in the same period as a percentage. |
pcie__read_bytes.avg.pct_of_peak_sustained_elapsed |
PCIe Read Throughput: The ratio of bytes received on the PCIe interface to the maximum number of bytes receivable in the sample period as a percentage. The theoretical value is calculated based upon the PCIe generation and number of lanes. |
pcie__write_bytes.avg.pct_of_peak_sustained_elapsed |
PCIe Write Throughput: The ratio of bytes transmitted on the PCIe interface to the maximum number of bytes receivable in the sample period as a percentage. The theoretical value is calculated based upon the PCIe generation and number of lanes. |
nvlrx__bytes.avg.pct_of_peak_sustained_elapsed |
NVLink bytes received: The ratio of bytes received on the NVLink interface to the maximum number of bytes receivable in the sample period as a percentage. |
nvltx__bytes.avg.pct_of_peak_sustained_elapsed |
NVLink bytes transmitted: The ratio of bytes transmitted on the NVLink interface to the maximum number of bytes transmittable in the sample period as a percentage. |
pcie__rx_requests_aperture_bar1_op_read.sum pcie__rx_requests_aperture_bar1_op_write.sum |
PCIe Read/Write Requests to BAR1: BAR1 is a PCI Express (PCIe) interface used to allow the CPU or other devices to directly access GPU memory. The GPU normally transfers memory with its copy engines, which would not show up as BAR1 activity. The GPU drivers on the CPU do a small amount of BAR1 accesses, but heavier traffic is typically coming from other technologies. |
2.13. CUPTI Checkpoint API#
Starting with CUDA 11.5, CUPTI ships with a new library to assist tool developers who wish to replay kernels under direct control, such as tools using the profiling API User Replay mode. This new Checkpoint library provides support for automatically saving and restoring device state for many common uses.
A device checkpoint is a managed copy of device functional state - including values in memory, along with some (but not all) other user visible state of the device. When a checkpoint is saved, this state is saved to internal buffers, preferentially using free device, then host, and finally filesystem space to save the data. The user tool maintains a handle to a checkpoint, and is able to restore the checkpoint with a single call, restoring the state so a kernel may be re-executed and expect to have the same device state as when the checkpoint was saved.
Once saved, a checkpoint may be restored any time including after multiple kernels have been launched, though currently there are limitations on which user calls (CUDA or driver API calls) have been validated to work between a Save and Restore. It currently is known safe to launch multiple kernels on a context and to do memcpy calls before restoring a checkpoint. Future versions of CUPTI will extend this to support additional API calls between a Save and Restore.
Checkpoints may be saved during injected kernel launch callbacks or directly coded into a target application.
Certain APIs are known to not work with the version of the Checkpoint API shipped with CUPTI 11.5, including Stream Capture mode.
2.13.1. Usage#
There is one header for the library, cupti_checkpoint.h, which needs to be included, and libcheckpoint needs to be linked in to the application or injection library. Though the checkpoint library doesn’t depend on cupti, the error codes returned by the API are shared with cupti, so linking libcupti in is needed in order to translate the return codes to string representations.
The Checkpoint API follows a similar design to other CUPTI APIs. API behavior is controlled through a structure, CUpti_Checkpoint, which is initialized by a tool or application, then passed to cuptiCheckpointSave. If the call is successful, the structure saves a handle to a checkpoint. At this point, the application may make a series of calls which modify device state (kernels which update memory, memcopies, etc), and when the device state should be restored, the tool can use the same structure in calls to cuptiCheckpointRestore, and finally a call to cuptiCheckpointFree to release the resources used by the checkpoint object.
Multiple checkpoints may be saved at the same time. If multiple checkpoints exist, they operate entirely independently - each checkpoint consumes the full resources needed to restore the device state at the point it was saved. Order of operations between multiple checkpoints is not enforced by the API - while a common use for multiple checkpoints may be a nested pattern, it is also possible to interleave checkpoint operations.
Between a cuptiCheckpointSave and cuptiCheckpointRestore, any number of standard kernel launches (or equivalent API calls such as cuLaunchKernel) or memcpy calls may be made. Additionally, any host (cpu) side calls may be made that do not affect device state. It is possible that other CUDA or driver API calls may be made, but have not been validated with the 11.5 release.
Several options exist in the CUpti_Checkpoint structure. They must be set prior to the initial cuptiCheckpointSave using that structure. Any further changes to the structure are ignored until after a call to cuptiCheckpointFree, at which point the structure can be re-configured and re-used.
Important per-checkpoint options:
structSize- must be set to the value ofCUpti_Checkpoint_STRUCT_SIZEctx- if NULL, the checkpoint will be of the default CUDA context, otherwise, specifies which contextreserveDeviceMB- Restrict a checkpoint save from using at least this much device memoryreserveHostMB- Restrict a checkpoint save from using at least this much host memoryallowOverwrite- It is normally an error to call Save using an existing checkpoint handle (one which has not been Freed). When set, this option allows the Save operation to be called multiple times on a handle. Note that when using this option, theCUpti_Checkpointoptions are not re-read on any subsequent Save. To read new options, the handle must be passed tocuptiCheckpointFreeprior to thecuptiCheckpointSavecall.optimizations- Bitmask of options for checkpoint behaviorCUPTI_CHECKPOINT_OPT_TRANSFER- Normally when restoring a checkpoint, all existing device memory at the time of the save is restored. This optimization adds a test to see whether a block of memory has changed before restoring it and caches the results for subsequent calls to Restore. Use of this option requires that all Restore calls be done at the same point in an application for a given checkpoint. As the optimization may be computationally expensive, it is most useful when there is a significant amount of data that can be skipped and there will be several calls to Restore the checkpoint.
2.13.2. Restrictions#
Checkpoints API calls may not be made during a stream capture. They also may not be inserted into a graph. Beyond kernel launches (cuLaunchKernel, standard kernel<<<>>> launches, etc) and memcpy calls, the remaining CUDA and driver API calls have not been validated within a CheckpointSave and Restore region. Any other CUDA or driver API calls (example - device malloc or free) may work, or may cause undetermined behavior. Additional APIs will be validated to work with the Checkpoint API in future releases.
The Checkpoint API does not have visibility into which API calls have been made between cuptiCheckpointSave and cuptiCheckpointRestore calls, and may not be able to correctly detect error cases if unsupported calls have been made. In this case it is possible that device state may only be partially restored by cuptiCheckpointRestore, which may cause functionally incorrect behavior in subsequent device calls.
The Checkpoint API only restores functionally visible device state, not performance critical state. Some performance characteristics, such as state of the caches, will not be saved by a checkpoint, and saving or restoring a checkpoint may change the occupancy and alter performance for subsequent device calls.
The Checkpoint API makes no attempt to restore host (non-device) state, beyond freeing the resources it internally uses during a call to cuptiCheckpointFree.
The Checkpoint API by default uses device memory, host memory, and finally the filesystem to back up the device state. It is possible that addition of a cuptiCheckpointSave causes a later device allocation to fail due to the increased device memory usage. (Similarly, host memory is also used, and may be affected by a checkpoint). To allow the user to guarantee a certain amount of device or host memory remains available for later use, reserveDeviceMB and reserveHostMB fields in the CUpti_Checkpoint struct may be set. Use of these fields will guarantee that the device or host memory will leave that much memory free during a cuptiCheckpointSave call, but may cause the Checkpoint API call performance to degrade due to increased use of slower storage spaces.
2.13.3. Examples#
The Checkpoint API does not require any other CUPTI calls. A simple use case could be to compare the output of three different implementations of a kernel. Pseudocode for this could look like:
CUpti_Checkpoint cp = { CUpti_Checkpoint_STRUCT_SIZE };

int kernel = 0;
do
{
  if (kernel == 0)
    cuptiCheckpointSave(&cp);
  else
    cuptiCheckpointRestore(&cp);

  if (kernel == 0)
    kernel_1<<<>>>(...);
  else if (kernel == 1)
    kernel_2<<<>>>(...);
  else if (kernel == 2)
    kernel_3<<<>>>(...);
} while (kernel++ < 3);

cuptiCheckpointFree(&cp);
In this example, even if any of the kernels modify their own input data, the subsequent passes through the loop will still run correctly - the modified input data would be restored by each call to cuptiCheckpointRestore before the next kernel runs. This is particularly useful when a programmer does not know the exact state of the device prior to a kernel call - the Checkpoint API ensures that all needed data is saved and restored, which would not otherwise be practical or perhaps even possible in some complex cases.
Another possible use case could be for fuzzing - randomly modifying input to a kernel, and ensuring it performs as expected. Instead of manually restoring device state to a known good point, the Checkpoint API and initialize a good state, and the fuzzer can modify only what is needed.
CUpti_Checkpoint cp = { CUpti_Checkpoint_STRUCT_SIZE };

int i = 0;
do
{
  if (i == 0)
    cuptiCheckpointSave(&cp);
  else
    cuptiCheckpointRestore(&cp);

  setup_test<<<>>>(i, ...);

  kernel<<<>>>(...);

  validate_result<<<>>>(i, ...);
} while (i++ < num_tests);

cuptiCheckpointFree(&cp);
The Checkpoint API is particularly useful in User Replay mode of the CUPTI profiling API. This mode replays only the parts of the application within a performance region, unlike Kernel Replay and Application Replay modes. In User Replay mode, kernels may need to be launched multiple times to gather all requested metrics, which can be complicated if they modify their input data or the internal context state. Without the Checkpoint API, tool developers must manually restore modified input data and context state, as it is difficult for tools to automatically determine what needs to be restored.
In Kernel Replay mode, CUPTI handles the save and restore of context data internally around a kernel. However, in User Replay mode, users must manage the save-restore process regardless of the range mode enabled. Application Replay mode does not require this as the entire application runs multiple times. The Checkpoint API ensures that input data and context state are restored with each pass, facilitating accurate profiling data collection in multi-pass metric configurations.
// Enable range profiler
// ...

// Set range profiler configuration (User Replay Mode)
CUpti_RangeProfiler_SetConfig_Params setConfigParams = {};
setConfigParams.replayMode = CUPTI_UserReplay;
// ... Other setConfigParams
cuptiRangeProfilerSetConfig(&setConfigParams)

// Create Checkpoint for a cuda context
CUpti_Checkpoint cp = { CUpti_Checkpoint_STRUCT_SIZE };
cp.ctx = cuContext;
cuptiCheckpointSave(&cp);

bool allPassSubmitted = false;
do
{
    cuptiRangeProfilerStart(&startRangeProfiler);
    LaunchA<<<...>>>();
    LaunchB<<<...>>>();
    LaunchC<<<...>>>();
    cuptiRangeProfilerStop(&stopRangeProfiler);
    allPassSubmitted = stopRangeProfiler.isAllPassSubmitted;

    // Restore Checkpoint if not all passes are submitted
    if (!allPassSubmitted) {
        cuptiCheckpointRestore(&cp);
    }
}
while (!allPassSubmitted);

// Free Checkpoint
cuptiCheckpointFree(&cp);

// Get Profiler Data and print results
// ...
In this example, the Profiler range will span all concurrently running kernels, which may modify their own input data - each pass through the loop will restore the initial values.
2.14. CUPTI Profiling API#
In the CUDA 10.0, a new set of metric APIs were added for devices with compute capability 7.0 and higher. These APIs are provided in the header file cupti_profiler_target.h. These APIs provide low and deterministic profiling overhead on the target system. These are supported on all CUDA supported platforms except Android, and are not supported under MPS (Multi-Process Service), Confidential Compute, or SLI configured systems. In order to determine whether a device is compatible with this API, a new function cuptiProfilerDeviceSupported is introduced in CUDA 11.5 which exposes overall Profiling API support and specific requirements for a given device. Profiling API must be initialized by calling cuptiProfilerInitialize before testing device support.
This section covers performance profiling Host and Target APIs for CUDA. Broadly profiling APIs are divided into following four sections:
Enumeration (Host)
Configuration (Host)
Collection (Target)
Evaluation (Host)
Host APIs provide a metric interface for enumeration, configuration and evaluation that doesn’t require a compute(GPU) device, and can also run in an offline mode. In the samples section under extensions, profiler host utility covers the usage of host APIs. Target APIs are used for data collection of the metrics and requires a compute (GPU) device. Refer to samples auto_rangeProfiling and userrange_profiling for usage of profiling APIs.
These APIs adhere to a uniform metric naming convention using the format unit__(subunit?)_(pipestage?)_quantity_qualifiers.
Note
In the CUDA 12.6 release, CUPTI introduced a new set of target API CUPTI Range Profiling API
and the host API CUPTI Profiler Host API.
For profiling, it is strongly recommended that users utilize these new host and target APIs.
The CUPTI Profiling API is deprecated in the CUDA 13.0 release
and will not support any future GPU architectures after Blackwell. Note that not all APIs from the header cupti_profiler_target.h
are deprecated; a few supported APIs are used by other profiling features like Range Profiling and PM Sampling.
2.14.1. Multi Pass Collection#
NVIDIA GPU hardware has a limited number of counter registers and cannot collect all possible counters concurrently. There are also limitations on which counters can be collected together in a single pass. This is resolved by replaying the exact same set of GPU workloads multiple times, where each replay is termed a pass. On each pass, a different subset of requested counters are collected. Once all passes are collected, the data is available for evaluation. Certain metrics have many counters as inputs; adding a single metric may require many passes to collect. CUPTI APIs support multi pass collection through different collection attributes.
2.14.2. Range Profiling#
Each profiling session runs a series of replay passes, where each pass contains a sequence of ranges. Every metric enabled in the session’s configuration is collected separately per unique range-stack in the pass. CUPTI supports auto and user defined ranges.
2.14.2.1. Auto Range#
In a session with auto range mode, ranges are defined around each kernel automatically with a unique name assigned to each range, while profiling is enabled. This mode is useful for tight metric collection around each kernel. A user can choose one of the supported replay modes, pseudo code for each is described below:
Kernel Replay
The replay logic (multiple pass, if needed) is done by CUPTI implicitly (opaque to the user), and usage of CUPTI replay API’s cuptiProfilerBeginPass and cuptiProfilerEndPass will be a no-op in this mode. This mode is useful for collecting metrics around a kernel in tight control. Each kernel launch is synchronized to segregate its metrics into a separate range, and a CPU-GPU sync is made to ensure the profiled data is collected from GPU. Counter Collection can be enabled and disabled with cuptiProfilerEnableProfiling and cuptiProfilerDisableProfiling. Refer to the sample autorange_profiling
/* Assume Inputs(counterDataImagePrefix and configImage) from configuration phase at host */
void Collection(std::vector<uint8_t>& counterDataImagePrefix, std::vector<uint8_t>& configImage)
{
    CUpti_Profiler_Initialize_Params profilerInitializeParams = { CUpti_Profiler_Initialize_Params_STRUCT_SIZE };
    cuptiProfilerInitialize(&profilerInitializeParams);

    std::vector<uint8_t> counterDataImages;
    std::vector<uint8_t> counterDataScratchBuffer;
    CreateCounterDataImage(counterDataImages, counterDataScratchBuffer, counterDataImagePrefix);

    CUpti_Profiler_BeginSession_Params beginSessionParams = { CUpti_Profiler_BeginSession_Params_STRUCT_SIZE };
    CUpti_ProfilerRange profilerRange = CUPTI_AutoRange;
    CUpti_ProfilerReplayMode profilerReplayMode = CUPTI_KernelReplay;

    beginSessionParams.ctx = NULL;
    beginSessionParams.counterDataImageSize = counterDataImage.size();
    beginSessionParams.pCounterDataImage = &counterDataImage[0];
    beginSessionParams.counterDataScratchBufferSize = counterDataScratchBuffer.size();
    beginSessionParams.pCounterDataScratchBuffer = &counterDataScratchBuffer[0];
    beginSessionParams.range = profilerRange;
    beginSessionParams.replayMode = profilerReplayMode;
    beginSessionParams.maxRangesPerPass = num_ranges;
    beginSessionParams.maxLaunchesPerPass = num_ranges;

    cuptiProfilerBeginSession(&beginSessionParams));

    CUpti_Profiler_SetConfig_Params setConfigParams = { CUpti_Profiler_SetConfig_Params_STRUCT_SIZE };
    setConfigParams.pConfig = &configImage[0];
    setConfigParams.configSize = configImage.size();

    cuptiProfilerSetConfig(&setConfigParams));

    kernelA <<<grid, tids >>>(...);                  // KernelA not profiled

    CUpti_Profiler_EnableProfiling_Params enableProfilingParams = { CUpti_Profiler_EnableProfiling_Params_STRUCT_SIZE };
    cuptiProfilerEnableProfiling(&enableProfilingParams);
    {

        kernelB <<<grid, tids >>>(...);              // KernelB profiled and captured in an unique range.
        kernelC <<<grid, tids >>>(...);              // KernelC profiled and captured in an unique range.
        kernelD <<<grid, tids >>>(...);              // KernelD profiled and captured in an unique range.
    }

    CUpti_Profiler_DisableProfiling_Params disableProfilingParams = { CUpti_Profiler_DisableProfiling_Params_STRUCT_SIZE };
    cuptiProfilerDisableProfiling(&disableProfilingParams);

    kernelE <<<grid, tids >>>(...);                  // KernelE not profiled

    CUpti_Profiler_UnsetConfig_Params unsetConfigParams = { CUpti_Profiler_UnsetConfig_Params_STRUCT_SIZE };
    cuptiProfilerUnsetConfig(&unsetConfigParams);

    CUpti_Profiler_EndSession_Params endSessionParams = { CUpti_Profiler_EndSession_Params_STRUCT_SIZE };
    cuptiProfilerEndSession(&endSessionParams);
}
User Replay
The replay (multiple passes, if needed) is done by the user using the replay API’s cuptiProfilerBeginPass and cuptiProfilerEndPass. It is user responsibility to flush the counter data cuptiProfilerFlushCounterData before ending the session to ensure collection of metric data in CPU. Counter collection can be enabled and disabled with cuptiProfilerEnableProfiling/ cuptiProfilerDisableProfiling. Refer to the sample autorange_profiling
/* Assume Inputs(counterDataImagePrefix and configImage) from configuration phase at host */

void Collection(std::vector<uint8_t>& counterDataImagePrefix, std::vector<uint8_t>& configImage)
{
    CUpti_Profiler_Initialize_Params profilerInitializeParams = {CUpti_Profiler_Initialize_Params_STRUCT_SIZE};
    cuptiProfilerInitialize(&profilerInitializeParams);

    std::vector<uint8_t> counterDataImages;
    std::vector<uint8_t> counterDataScratchBuffer;
    CreateCounterDataImage(counterDataImages, counterDataScratchBuffer, counterDataImagePrefix);

    CUpti_Profiler_BeginSession_Params beginSessionParams = {CUpti_Profiler_BeginSession_Params_STRUCT_SIZE};
    CUpti_ProfilerRange profilerRange = CUPTI_AutoRange;
    CUpti_ProfilerReplayMode profilerReplayMode = CUPTI_UserReplay;

    beginSessionParams.ctx = NULL;
    beginSessionParams.counterDataImageSize = counterDataImage.size();
    beginSessionParams.pCounterDataImage = &counterDataImage[0];
    beginSessionParams.counterDataScratchBufferSize = counterDataScratchBuffer.size();
    beginSessionParams.pCounterDataScratchBuffer = &counterDataScratchBuffer[0];
    beginSessionParams.range = profilerRange;
    beginSessionParams.replayMode = profilerReplayMode;
    beginSessionParams.maxRangesPerPass = num_ranges;
    beginSessionParams.maxLaunchesPerPass = num_ranges;

    cuptiProfilerBeginSession(&beginSessionParams));

    CUpti_Profiler_SetConfig_Params setConfigParams = {CUpti_Profiler_SetConfig_Params_STRUCT_SIZE};
    setConfigParams.pConfig = &configImage[0];
    setConfigParams.configSize = configImage.size();

    cuptiProfilerSetConfig(&setConfigParams));

    CUpti_Profiler_FlushCounterData_Params cuptiFlushCounterDataParams =        {CUpti_Profiler_FlushCounterData_Params_STRUCT_SIZE};

    CUpti_Profiler_EnableProfiling_Params enableProfilingParams =       {CUpti_Profiler_EnableProfiling_Params_STRUCT_SIZE};

    CUpti_Profiler_DisableProfiling_Params disableProfilingParams =         {CUpti_Profiler_DisableProfiling_Params_STRUCT_SIZE};


    kernelA<<<grid, tids>>>(...);                  // KernelA neither profiled, nor replayed

    CUpti_Profiler_BeginPass_Params beginPassParams = {CUpti_Profiler_BeginPass_Params_STRUCT_SIZE};
    CUpti_Profiler_EndPass_Params endPassParams = {CUpti_Profiler_EndPass_Params_STRUCT_SIZE};

    cuptiProfilerBeginPass(&beginPassParams);
    {
        kernelB<<<grid, tids>>>(...);              // KernelB replayed but not profiled

        cuptiProfilerEnableProfiling(&enableProfilingParams);

        kernelC<<<grid, tids>>>(...);              // KernelC profiled and captured in an unique range.
        kernelD<<<grid, tids>>>(...);              // KernelD profiled and captured in an unique range.

        cuptiProfilerDisableProfiling(&disableProfilingParams);
    }
    cuptiProfilerEndPass(&endPassParams);

    cuptiProfilerFlushCounterData(&cuptiFlushCounterDataParams);

    kernelE<<<grid, tids>>>(...);                  // KernelE not profiled

    CUpti_Profiler_UnsetConfig_Params unsetConfigParams = {CUpti_Profiler_UnsetConfig_Params_STRUCT_SIZE};
    cuptiProfilerUnsetConfig(&unsetConfigParams);

    CUpti_Profiler_EndSession_Params endSessionParams = {CUpti_Profiler_EndSession_Params_STRUCT_SIZE};
    cuptiProfilerEndSession(&endSessionParams);
}
Application Replay
This replay mode is same as user replay, instead of in process replay, you can replay the whole process again. You will need to update the pass index while setting the config cuptiProfilerSetConfig and reload the intermediate counterDataImage on each pass.
2.14.2.2. User Range#
In a session with user range mode, ranges are defined by you, cuptiProfilerPushRange and cuptiProfilerPopRange. Kernel launches are concurrent within a range. This mode is useful for metric data collection around a specific section of code, instead of per-kernel metric collection. Kernel replay is not supported in user range mode. You own the responsibility of replay using cuptiProfilerBeginPass and cuptiProfilerEndPass.
User Replay
The replay (multiple passes, if needed) is done by the user using the replay API’s cuptiProfilerBeginPass and cuptiProfilerEndPass. It is your responsibility to flush the counter data using cuptiProfilerFlushCounterData before ending the session. Counter collection can be enabled/disabled with cuptiProfilerEnableProfiling and cuptiProfilerDisableProfiling. Refer to the sample userrange_profiling
/* Assume Inputs(counterDataImagePrefix and configImage) from configuration phase at host */

void Collection(std::vector<uint8_t>& counterDataImagePrefix, std::vector<uint8_t>& configImage)
{
    CUpti_Profiler_Initialize_Params profilerInitializeParams = {CUpti_Profiler_Initialize_Params_STRUCT_SIZE};
    cuptiProfilerInitialize(&profilerInitializeParams);

    std::vector<uint8_t> counterDataImages;
    std::vector<uint8_t> counterDataScratchBuffer;
    CreateCounterDataImage(counterDataImages, counterDataScratchBuffer, counterDataImagePrefix);

    CUpti_Profiler_BeginSession_Params beginSessionParams = {CUpti_Profiler_BeginSession_Params_STRUCT_SIZE};
    CUpti_ProfilerRange profilerRange = CUPTI_UserRange;
    CUpti_ProfilerReplayMode profilerReplayMode = CUPTI_UserReplay;

    beginSessionParams.ctx = NULL;
    beginSessionParams.counterDataImageSize = counterDataImage.size();
    beginSessionParams.pCounterDataImage = &counterDataImage[0];
    beginSessionParams.counterDataScratchBufferSize = counterDataScratchBuffer.size();
    beginSessionParams.pCounterDataScratchBuffer = &counterDataScratchBuffer[0];
    beginSessionParams.range = profilerRange;
    beginSessionParams.replayMode = profilerReplayMode;
    beginSessionParams.maxRangesPerPass = num_ranges;
    beginSessionParams.maxLaunchesPerPass = num_ranges;

    cuptiProfilerBeginSession(&beginSessionParams));

    CUpti_Profiler_SetConfig_Params setConfigParams = {CUpti_Profiler_SetConfig_Params_STRUCT_SIZE};
    setConfigParams.pConfig = &configImage[0];
    setConfigParams.configSize = configImage.size();

    cuptiProfilerSetConfig(&setConfigParams));

    CUpti_Profiler_FlushCounterData_Params cuptiFlushCounterDataParams = {CUpti_Profiler_FlushCounterData_Params_STRUCT_SIZE};

    kernelA<<<grid, tids>>>(...);                  // KernelA neither profiled, nor replayed

    CUpti_Profiler_BeginPass_Params beginPassParams = {CUpti_Profiler_BeginPass_Params_STRUCT_SIZE};
    CUpti_Profiler_EndPass_Params endPassParams = {CUpti_Profiler_EndPass_Params_STRUCT_SIZE};

    cuptiProfilerBeginPass(&beginPassParams);
    {
        kernelB<<<grid, tids>>>(...);              // KernelB replayed but not profiled

        CUpti_Profiler_PushRange_Params enableProfilingParams = {CUpti_Profiler_PushRange_Params_STRUCT_SIZE};
        pushRangeParams.pRangeName = "RangeA";
        cuptiProfilerPushRange(&pushRangeParams);

        kernelC<<<grid, tids>>>(...);
        kernelD<<<grid, tids>>>(...);

        cuptiProfilerPopRange(&popRangeParams);     // Kernel C and Kernel D are captured in rangeA without any serialization introduced by profiler
    }
    cuptiProfilerEndPass(&endPassParams);
    cuptiProfilerFlushCounterData(&cuptiFlushCounterDataParams);

    kernelE<<<grid, tids>>>(...);                  // KernelE not Profiled

    CUpti_Profiler_UnsetConfig_Params unsetConfigParams = {CUpti_Profiler_UnsetConfig_Params_STRUCT_SIZE};
    cuptiProfilerUnsetConfig(&unsetConfigParams);

    CUpti_Profiler_EndSession_Params endSessionParams = {CUpti_Profiler_EndSession_Params_STRUCT_SIZE};
    cuptiProfilerEndSession(&endSessionParams);
}
Application Replay
This replay mode is same as user replay, instead of in process replay, you can replay the whole process again. You will need to update the pass index while setting the config using the cuptiProfilerSetConfig API, and reload the intermediate counterDataImage on each pass.
2.14.3. CUPTI Profiler Definitions#
Definitions of glossary used in this section.
- Counter:
The number of occurrences of a specific event on the device.
- Configuration Image:
A Blob to configure the session for counters to be collected.
- CounterData Image:
A Blob which contains the values of collected counters
- CounterData Prefix:
A metadata header for CounterData Image
- Device:
A physical NVIDIA GPU.
- Event:
An event is a countable activity, action, or occurrence on device.
- Metric:
A high-level value derived from counter values.
- Pass:
A repeatable set of operations, with consistently labeled ranges.
- Range:
A labeled region of execution
- Replay:
Performing the repeatable set of operation.
- Session:
A profiling session where GPU resources needed for profiling are allocated. The profiler is in armed state at session boundaries, and power management may be disabled at session boundaries. Outside of a session, the GPU will return to its normal operating state.
2.14.4. Limitations#
Here is the list of features which are not available with the Profiling API:
The Profiling API offers the closest equivalent metrics for most events and metrics previously supported by the now-dropped event and metric APIs. However, there are some events and metrics for which there is no equivalent metrics in the Profiling API. Tables Metrics Mapping Table and Events Mapping Table can be referred to find the equivalent Perfworks metrics for compute capability 7.0.
Per-instance metrics i.e. users can’t collect metrics for each instance of the hardware units like SM, FB etc separately. However, the Profiling API offers sub-metrics that allow users to calculate the average, sum, minimum, or maximum across all instances of a hardware unit.
2.15. Perfworks Metric API#
Introduction:
The Perfworks Metric API supports the enumeration, configuration and evaluation of metrics. The binary outputs of the configuration phase are inputs to the Range API of the CUPTI Profiling API. The output of range profiling is the CounterData, which is passed to the Derived Metrics Evaluation APIs. These APIs are provided in the header file nvperf_host.h.
GPU Metrics are generally presented as counts, ratios and percentages. The underlying values collected from hardware are raw counters, but those details are hidden behind derived metric formulas.
The Metric APIs are split into two layers: Derived Metrics and Raw Metrics. Derived Metrics contains the list of named metrics and performs evaluation to numeric results. Most user interaction will be with derived metrics. Raw Metrics contains the list of raw counters and generates configuration file images.
Metric Enumeration
Metric Enumeration is the process of listing available counters and metrics.
Metrics are grouped into three types i.e. counters, ratios and throughput. Except ratios metric type each metrics have four type of sub-metrics also known as rollup metrics i.e. sum, avg, min, max.
For enumerating supported metrics for a chip, we need to calculate the scratch buffer needed for host operation and to initialize the Metric Evaluator.
Call
NVPW_CUDA_MetricsEvaluator_CalculateScratchBufferSizefor calculating scratch buffer size required for allocating memory for host operations.Call
NVPW_CUDA_MetricsEvaluator_Initializefor initializing the Metrics Evaluator which creates a NVPW_MetricsEvaluator object.
The outline for enumerating supported counter metrics for a chip:
Call
NVPW_MetricsEvaluator_GetMetricNamesfor NVPW_METRIC_TYPE_COUNTER metric type for listing all the counter metrics supported.Call
NVPW_MetricsEvaluator_GetSupportedSubmetricsto list all the sub-metric supported for NVPW_METRIC_TYPE_COUNTER metric type.Call
NVPW_MetricsEvaluator_GetCounterPropertiesto give description of the counter and the collection hardware unit.
Similarly, for enumerating ratio and throughput metrics we need to pass NVPW_METRIC_TYPE_RATIO and NVPW_METRIC_TYPE_THROUGHPUT as metric types to NVPW_MetricsEvaluator_GetMetricNames and NVPW_MetricsEvaluator_GetSupportedSubmetrics.
For more details about the metric properties call NVPW_MetricsEvaluator_GetRatioMetricProperties and NVPW_MetricsEvaluator_GetThroughputMetricProperties respectively.
Configuration Workflow
Configuration is the process of specifying the metrics that will be collected and how those metrics should be collected. The inputs for this phase are the metric names and metric collection properties. The output for this phase is a ConfigImage and a CounterDataPrefix Image.
Refer to file Metric.cpp used by the userrange_profiling sample.
The outline for configuring metrics:
As input, take a list of metric names.
Before creating ConfigImage or CounterDataPrefixImage, we need a list of NVPA_RawMetricRequest for the metrics listed for collection.
We need to calculate the scratch buffer size required for the host operation and to initialize the Metric Evaluator like in the Enumeration phase.
For each metric, Call
NVPW_MetricsEvaluator_ConvertMetricNameToMetricEvalRequestfor creating a NVPW_MetricEvalRequest.Call
NVPW_MetricsEvaluator_GetMetricRawDependencieswhich takes the NVPW_MetricsEvaluator and NVPW_MetricEvalRequest as input, for getting raw dependencies for given metrics.
Create an
NVPA_RawMetricRequestwithkeepInstances=trueandisolated=truePass the
NVPA_RawMetricRequesttoNVPW_RawMetricsConfig_AddMetricsfor the ConfigImage.Pass the
NVPA_RawMetricRequesttoNVPW_CounterDataBuilder_AddMetricsfor the CounterDataPrefix.Generate binary configuration “images” (file format in memory):
ConfigImage from
NVPW_RawMetricsConfig_GetConfigImageCounterDataPrefix from
NVPW_CounterDataBuilder_GetCounterDataPrefix
Metric Evaluation
Metric Evaluation is the process of forming metrics from the counters stored in the CounterData image.
Refer to file Eval.cpp used by the userrange_profiling sample.
The outline for configuring metrics:
As input, take the same list of metric names as used during configuration.
As input, take a CounterDataImage collected on a target device.
We need to calculate the scratch buffer size required for the host operation and to initialize the Metric Evaluator like in the Enumeration phase.
Query the number of ranges collected via
NVPW_CounterData_GetNumRanges.For each metric:
Call
NVPW_MetricsEvaluator_ConvertMetricNameToMetricEvalRequestfor creating NVPW_MetricEvalRequestFor each range:
Call
NVPW_Profiler_CounterData_GetRangeDescriptionsto retrieve the range’s description, originally set bycuptiProfilerPushRange.Call
NVPW_MetricsEvaluator_SetDeviceAttributesto set the current range for evaluation on the NVPW_MetricEvalRequest.Call
NVPW_MetricsEvaluator_EvaluateToGpuValuesto query an array of numeric values corresponding to each input metric.
2.15.1. Derived metrics#
Metrics Overview
The PerfWorks API comes with an advanced metrics calculation system, designed to help you determine what happened (counters and metrics), and how close the program reached to peak GPU performance (throughputs as a percentage). Every counter has associated peak rates in the database, to allow computing its throughput as a percentage.
Throughput metrics return the maximum percentage value of their constituent counters. Constituents can be programmatically queried via NVPW_MetricsEvaluator_GetMetricNames with NVPW_METRIC_TYPE_THROUGHPUT as metric types. These constituents have been carefully selected to represent the sections of the GPU pipeline that govern peak performance. While all counters can be converted to a %-of-peak, not all counters are suitable for peak-performance analysis; examples of unsuitable counters include qualified subsets of activity, and workload residency counters. Using throughput metrics ensures meaningful and actionable analysis.
Two types of peak rates are available for every counter: burst and sustained. Burst rate is the maximum rate reportable in a single clock cycle. Sustained rate is the maximum rate achievable over an infinitely long measurement period, for “typical” operations. For many counters, burst == sustained. Since the burst rate cannot be exceeded, percentages of burst rate will always be less than 100%. Percentages of sustained rate can occasionally exceed 100% in edge cases. Burst metrics are only supported with MetricsContext APIs and these will be deprecated in a future CUDA release. These metrics are not supported with NVPW_MetricsEvaluator APIs.
Metrics Entities
The Metrics layer has 3 major types of entities:
Metrics : these are calculated quantities, with the following static properties:
Description string.
Dimensional Units : a list of (‘name’, exponent) in the style of dimensional analysis. Example string representation:
pixels / gpc_clk.Raw Metric dependencies : the list of raw metrics that must be collected, in order to evaluate the metric.
Every metric has the following sub-metrics built in.
.peak_sustainedthe peak sustained rate
.peak_sustained_activethe peak sustained rate during unit active cycles
.peak_sustained_active.per_secondthe peak sustained rate during unit active cycles, per second *
.peak_sustained_elapsedthe peak sustained rate during unit elapsed cycles
.peak_sustained_elapsed.per_secondthe peak sustained rate during unit elapsed cycles, per second *
.peak_sustained_regionthe peak sustained rate over a user-specified “range”
.peak_sustained_region.per_secondthe peak sustained rate over a user-specified “range”, per second *
.peak_sustained_framethe peak sustained rate over a user-specified “frame”
.peak_sustained_frame.per_secondthe peak sustained rate over a user-specified “frame”, per second *
.per_cycle_activethe number of operations per unit active cycle
.per_cycle_elapsedthe number of operations per unit elapsed cycle
.per_cycle_in_regionthe number of operations per user-specified “range” cycle
.per_cycle_in_framethe number of operations per user-specified “frame” cycle
.per_secondthe number of operations per second
.pct_of_peak_sustained_active% of peak sustained rate achieved during unit active cycles
.pct_of_peak_sustained_elapsed% of peak sustained rate achieved during unit elapsed cycles
.pct_of_peak_sustained_region% of peak sustained rate achieved over a user-specified “range” time
.pct_of_peak_sustained_frame% of peak sustained rate achieved over a user-specified “frame” time
* sub-metrics added in CUPTI 11.3.
Counters may be either a raw counter from the GPU, or a calculated counter value. Every counter has four sub-metrics under it, which are also called roll-ups:
.sumThe sum of counter values across all unit instances.
.avgThe average counter value across all unit instances.
.minThe minimum counter value across all unit instances.
.maxThe maximum counter value across all unit instances.
Ratios have three sub-metrics under it:
.pctThe value expressed as a percentage.
.ratioThe value expressed as a ratio.
.max_rateThe ratio’s maximum value.
Throughputs indicate how close a portion of the GPU reached to peak rate. Every throughput has the following sub-metrics:
.pct_of_peak_sustained_active% of peak sustained rate achieved during unit active cycles
.pct_of_peak_sustained_elapsed% of peak sustained rate achieved during unit elapsed cycles
.pct_of_peak_sustained_region% of peak sustained rate achieved over a user-specified “range” time
.pct_of_peak_sustained_frame% of peak sustained rate achieved over a user-specified “frame” time
At the configuration step, you must specify metric names. Counters, ratios, and throughputs are not directly schedulable.
Note: Burst metrics are only supported with MetricsContext APIs.
From CUPTI 11.3 onwards, due to not being useful for performance optimization following counter sub-metrics are not present in MetricEvaluator APIs and are only supported with MetricsContext APIs:
|
the peak burst rate |
|
% of peak burst rate achieved during unit active cycles |
|
% of peak burst rate achieved during unit elapsed cycles |
|
% of peak burst rate achieved over a user-specified “range” |
|
% of peak burst rate achieved over a user-specified “frame” |
From CUPTI 11.3 onwards, due to not being useful for performance optimization following throughput sub-metrics are not present in MetricEvaluator APIs and are only supported with MetricsContext APIs:
|
% of peak burst rate achieved during unit active cycles |
|
% of peak burst rate achieved during unit elapsed cycles |
|
% of peak burst rate achieved over a user-specified “range” time |
|
% of peak burst rate achieved over a user-specified “frame” time |
Metrics Examples
## non-metric names -- *not* directly evaluable
sm__inst_executed                   # counter
smsp__average_warp_latency          # ratio
sm__throughput                      # throughput

## a counter's four roll-ups as sub-metrics -- all evaluable
sm__inst_executed.sum               # metric
sm__inst_executed.avg               # metric
sm__inst_executed.min               # metric
sm__inst_executed.max               # metric

## all names below are metrics -- all evaluable
l1tex__data_bank_conflicts_pipe_lsu.sum
l1tex__data_bank_conflicts_pipe_lsu.sum.peak_burst
l1tex__data_bank_conflicts_pipe_lsu.sum.peak_sustained
l1tex__data_bank_conflicts_pipe_lsu.sum.per_cycle_active
l1tex__data_bank_conflicts_pipe_lsu.sum.per_cycle_elapsed
l1tex__data_bank_conflicts_pipe_lsu.sum.per_cycle_in_region
l1tex__data_bank_conflicts_pipe_lsu.sum.per_cycle_in_frame
l1tex__data_bank_conflicts_pipe_lsu.sum.per_second
l1tex__data_bank_conflicts_pipe_lsu.sum.pct_of_peak_sustained_active
l1tex__data_bank_conflicts_pipe_lsu.sum.pct_of_peak_sustained_elapsed
l1tex__data_bank_conflicts_pipe_lsu.sum.pct_of_peak_sustained_region
l1tex__data_bank_conflicts_pipe_lsu.sum.pct_of_peak_sustained_frame
Metrics Naming Conventions
Counters and metrics _generally_ obey the naming scheme:
Unit-Level Counter :
unit__(subunit?)_(pipestage?)_quantity_(qualifiers?)Interface Counter :
unit__(subunit?)_(pipestage?)_(interface)_quantity_(qualifiers?)Unit Metric :
(counter_name).(rollup_metric)Sub-Metric :
(counter_name).(rollup_metric).(submetric)
where
unit: A logical of physical unit of the GPU
subunit: The subunit within the unit where the counter was measured. Sometimes this is a pipeline mode instead.
pipestage: The pipeline stage within the subunit where the counter was measured.
quantity: What is being measured. Generally matches the “dimensional units”.
qualifiers: Any additional predicates or filters applied to the counter. Often, an unqualified counter can be broken down into several qualified sub-components.
interface: Of the form
sender2receiver, wheresenderis the source-unit andreceiveris the destination-unit.rollup_metric: One of sum,avg,min,max.
submetric: refer to section Metric Entities
Components are not always present. Most top-level counters have no qualifiers. Subunit and pipestage may be absent where irrelevant, or there may be many subunit specifiers for detailed counters.
Cycle Metrics
Counters using the term cycles in the name report the number of cycles in the unit’s clock domain. Unit-level cycle metrics include:
unit__cycles_elapsed: The number of cycles within a range. The cycles’ DimUnits are specific to the unit’s clock domain.unit__cycles_active: The number of cycles where the unit was processing data.unit__cycles_stalled: The number of cycles where the unit was unable to process new data because its output interface was blocked.unit__cycles_idle: The number of cycles where the unit was idle.
Interface-level cycle counters are often (not always) available in the following variations:
unit__(interface)_active: Cycles where data was transferred from source-unit to destination-unit.unit__(interface)_stalled: Cycles where the source-unit had data, but the destination-unit was unable to accept data.
2.15.2. Raw Metrics#
The raw metrics layer contains a list of low-level GPU counters, and the “scheduling” logic needed to program the hardware. The binary output files (ConfigImage and CounterDataPrefix) can be generated offline, stored on disk, and used on any compatible GPU. They do not need to be generated on a machine where a GPU is available.
Refer to Metrics Configuration to see where Raw Metrics fit into the overall data flow of the profiler.
2.15.3. Metrics Mapping Table#
The table below lists the CUPTI metrics for devices with compute capability 7.0. For each CUPTI metric the closest equivalent Perfworks metric or formula is given. If no equivalent Perfworks metric is available the column is left blank. Note that there can be some difference in the metric values between the CUPTI metric and the Perfworks metrics.
Perfworks metrics starting with sm__ are collected per-SM. Metrics starting with smsp__ are collected per-SM subpartition. However, all corresponding CUPTI metrics are collected per-SM, only.
CUPTI Metric |
Perfworks Metric or Formula |
|---|---|
achieved_occupancy |
sm__warps_active.avg.pct_of_peak_sustained_active |
atomic_transactions |
l1tex__t_set_accesses_pipe_lsu_mem_global_op_atom.sum + l1tex__t_set_accesses_pipe_lsu_mem_global_op_red.sum |
atomic_transactions_per_request |
(l1tex__t_sectors_pipe_lsu_mem_global_op_atom.sum + l1tex__t_sectors_pipe_lsu_mem_global_op_red.sum) / (l1tex__t_requests_pipe_lsu_mem_global_op_atom.sum + l1tex__t_requests_pipe_lsu_mem_global_op_red.sum) |
branch_efficiency |
smsp__sass_average_branch_targets_threads_uniform.pct |
cf_executed |
smsp__inst_executed_pipe_cbu.sum + smsp__inst_executed_pipe_adu.sum |
cf_fu_utilization |
|
cf_issued |
|
double_precision_fu_utilization |
smsp__inst_executed_pipe_fp64.avg.pct_of_peak_sustained_active |
dram_read_bytes |
dram__bytes_read.sum |
dram_read_throughput |
dram__bytes_read.sum.per_second |
dram_read_transactions |
dram__sectors_read.sum |
dram_utilization |
dram__throughput.avg.pct_of_peak_sustained_elapsed |
dram_write_bytes |
dram__bytes_write.sum |
dram_write_throughput |
dram__bytes_write.sum.per_second |
dram_write_transactions |
dram__sectors_write.sum |
eligible_warps_per_cycle |
smsp__warps_eligible.sum.per_cycle_active |
flop_count_dp |
smsp__sass_thread_inst_executed_op_dadd_pred_on.sum + smsp__sass_thread_inst_executed_op_dmul_pred_on.sum + smsp__sass_thread_inst_executed_op_dfma_pred_on.sum * 2 |
flop_count_dp_add |
smsp__sass_thread_inst_executed_op_dadd_pred_on.sum |
flop_count_dp_fma |
smsp__sass_thread_inst_executed_op_dfma_pred_on.sum |
flop_count_dp_mul |
smsp__sass_thread_inst_executed_op_dmul_pred_on.sum |
flop_count_hp |
smsp__sass_thread_inst_executed_op_hadd_pred_on.sum + smsp__sass_thread_inst_executed_op_hmul_pred_on.sum + smsp__sass_thread_inst_executed_op_hfma_pred_on.sum * 2 |
flop_count_hp_add |
smsp__sass_thread_inst_executed_op_hadd_pred_on.sum |
flop_count_hp_fma |
smsp__sass_thread_inst_executed_op_hfma_pred_on.sum |
flop_count_hp_mul |
smsp__sass_thread_inst_executed_op_hmul_pred_on.sum |
flop_count_sp |
smsp__sass_thread_inst_executed_op_fadd_pred_on.sum + smsp__sass_thread_inst_executed_op_fmul_pred_on.sum + smsp__sass_thread_inst_executed_op_ffma_pred_on.sum * 2 |
flop_count_sp_add |
smsp__sass_thread_inst_executed_op_fadd_pred_on.sum |
flop_count_sp_fma |
smsp__sass_thread_inst_executed_op_ffma_pred_on.sum |
flop_count_sp_mul |
smsp__sass_thread_inst_executed_op_fmul_pred_on.sum |
flop_count_sp_special |
|
flop_dp_efficiency |
smsp__sass_thread_inst_executed_ops_dadd_dmul_dfma_pred_on.avg.pct_of_peak_sustained_elapsed |
flop_hp_efficiency |
smsp__sass_thread_inst_executed_ops_hadd_hmul_hfma_pred_on.avg.pct_of_peak_sustained_elapsed |
flop_sp_efficiency |
smsp__sass_thread_inst_executed_ops_fadd_fmul_ffma_pred_on.avg.pct_of_peak_sustained_elapsed |
gld_efficiency |
smsp__sass_average_data_bytes_per_sector_mem_global_op_ld.pct |
gld_requested_throughput |
|
gld_throughput |
l1tex__t_bytes_pipe_lsu_mem_global_op_ld.sum.per_second |
gld_transactions |
l1tex__t_sectors_pipe_lsu_mem_global_op_ld.sum |
gld_transactions_per_request |
l1tex__average_t_sectors_per_request_pipe_lsu_mem_global_op_ld.ratio |
global_atomic_requests |
l1tex__t_requests_pipe_lsu_mem_global_op_atom.sum |
global_hit_rate |
l1tex__t_sectors_pipe_lsu_mem_global_op_{op}_lookup_hit.sum / l1tex__t_sectors_pipe_lsu_mem_global_op_{op}.sum |
global_load_requests |
l1tex__t_requests_pipe_lsu_mem_global_op_ld.sum |
global_reduction_requests |
l1tex__t_requests_pipe_lsu_mem_global_op_red.sum |
global_store_requests |
l1tex__t_requests_pipe_lsu_mem_global_op_st.sum |
gst_efficiency |
smsp__sass_average_data_bytes_per_sector_mem_global_op_st.pct |
gst_requested_throughput |
|
gst_throughput |
l1tex__t_bytes_pipe_lsu_mem_global_op_st.sum.per_second |
gst_transactions |
l1tex__t_bytes_pipe_lsu_mem_global_op_st.sum |
gst_transactions_per_request |
l1tex__average_t_sectors_per_request_pipe_lsu_mem_global_op_st.ratio |
half_precision_fu_utilization |
smsp__inst_executed_pipe_fp16.avg.pct_of_peak_sustained_active |
inst_bit_convert |
smsp__sass_thread_inst_executed_op_conversion_pred_on.sum |
inst_compute_ld_st |
smsp__sass_thread_inst_executed_op_memory_pred_on.sum |
inst_control |
smsp__sass_thread_inst_executed_op_control_pred_on.sum |
inst_executed |
smsp__inst_executed.sum |
inst_executed_global_atomics |
smsp__sass_inst_executed_op_global_atom.sum |
inst_executed_global_loads |
smsp__inst_executed_op_global_ld.sum |
inst_executed_global_reductions |
smsp__inst_executed_op_global_red.sum |
inst_executed_global_stores |
smsp__inst_executed_op_global_st.sum |
inst_executed_local_loads |
smsp__inst_executed_op_local_ld.sum |
inst_executed_local_stores |
smsp__inst_executed_op_local_st.sum |
inst_executed_shared_atomics |
smsp__inst_executed_op_shared_atom.sum + smsp__inst_executed_op_shared_atom_dot_alu.sum + smsp__inst_executed_op_shared_atom_dot_cas.sum |
inst_executed_shared_loads |
smsp__inst_executed_op_shared_ld.sum |
inst_executed_shared_stores |
smsp__inst_executed_op_shared_st.sum |
inst_executed_surface_atomics |
smsp__inst_executed_op_surface_atom.sum |
inst_executed_surface_loads |
smsp__inst_executed_op_surface_ld.sum + smsp__inst_executed_op_shared_atom_dot_alu.sum + smsp__inst_executed_op_shared_atom_dot_cas.sum |
inst_executed_surface_reductions |
smsp__inst_executed_op_surface_red.sum |
inst_executed_surface_stores |
smsp__inst_executed_op_surface_st.sum |
inst_executed_tex_ops |
smsp__inst_executed_op_texture.sum |
inst_fp_16 |
smsp__sass_thread_inst_executed_op_fp16_pred_on.sum |
inst_fp_32 |
smsp__sass_thread_inst_executed_op_fp32_pred_on.sum |
inst_fp_64 |
smsp__sass_thread_inst_executed_op_fp64_pred_on.sum |
inst_integer |
smsp__sass_thread_inst_executed_op_integer_pred_on.sum |
inst_inter_thread_communication |
smsp__sass_thread_inst_executed_op_inter_thread_communication_pred_on.sum |
inst_issued |
smsp__inst_issued.sum |
inst_misc |
smsp__sass_thread_inst_executed_op_misc_pred_on.sum |
inst_per_warp |
smsp__average_inst_executed_per_warp.ratio |
inst_replay_overhead |
|
ipc |
smsp__inst_executed.avg.per_cycle_active |
issue_slot_utilization |
smsp__issue_active.avg.pct_of_peak_sustained_active |
issue_slots |
smsp__inst_issued.sum |
issued_ipc |
smsp__inst_issued.avg.per_cycle_active |
l2_atomic_throughput |
lts__t_sectors_srcunit_l1_op_atom.sum.per_second |
l2_atomic_transactions |
lts__t_sectors_srcunit_l1_op_atom.sum |
l2_global_atomic_store_bytes |
lts__t_bytes_equiv_l1sectormiss_pipe_lsu_mem_global_op_atom.sum |
l2_global_load_bytes |
lts__t_bytes_equiv_l1sectormiss_pipe_lsu_mem_global_op_ld.sum |
l2_local_global_store_bytes |
lts__t_bytes_equiv_l1sectormiss_pipe_lsu_mem_local_op_st.sum + lts__t_bytes_equiv_l1sectormiss_pipe_lsu_mem_global_op_st.sum |
l2_local_load_bytes |
lts__t_bytes_equiv_l1sectormiss_pipe_lsu_mem_local_op_ld.sum |
l2_read_throughput |
lts__t_sectors_op_read.sum.per_second |
l2_read_transactions |
lts__t_sectors_op_read.sum |
l2_surface_load_bytes |
lts__t_bytes_equiv_l1sectormiss_pipe_tex_mem_surface_op_ld.sum |
l2_surface_store_bytes |
lts__t_bytes_equiv_l1sectormiss_pipe_tex_mem_surface_op_st.sum |
l2_tex_hit_rate |
lts__t_sector_hit_rate.pct |
l2_tex_read_hit_rate |
lts__t_sector_op_read_hit_rate.pct |
l2_tex_read_throughput |
lts__t_sectors_srcunit_tex_op_read.sum.per_second |
l2_tex_read_transactions |
lts__t_sectors_srcunit_tex_op_read.sum |
l2_tex_write_hit_rate |
lts__t_sector_op_write_hit_rate.pct |
l2_tex_write_throughput |
lts__t_sectors_srcunit_tex_op_read.sum.per_second |
l2_tex_write_transactions |
lts__t_sectors_srcunit_tex_op_read.sum |
l2_utilization |
lts__t_sectors.avg.pct_of_peak_sustained_elapsed |
l2_write_throughput |
lts__t_sectors_op_write.sum.per_second |
l2_write_transactions |
lts__t_sectors_op_write.sum |
ldst_executed |
|
ldst_fu_utilization |
smsp__inst_executed_pipe_lsu.avg.pct_of_peak_sustained_active |
ldst_issued |
|
local_hit_rate |
|
local_load_requests |
l1tex__t_requests_pipe_lsu_mem_local_op_ld.sum |
local_load_throughput |
l1tex__t_bytes_pipe_lsu_mem_local_op_ld.sum.per_second |
local_load_transactions |
l1tex__t_sectors_pipe_lsu_mem_local_op_ld.sum |
local_load_transactions_per_request |
l1tex__average_t_sectors_per_request_pipe_lsu_mem_local_op_ld.ratio |
local_memory_overhead |
|
local_store_requests |
l1tex__t_requests_pipe_lsu_mem_local_op_st.sum |
local_store_throughput |
l1tex__t_sectors_pipe_lsu_mem_local_op_st.sum.per_second |
local_store_transactions |
l1tex__t_sectors_pipe_lsu_mem_local_op_st.sum |
local_store_transactions_per_request |
l1tex__average_t_sectors_per_request_pipe_lsu_mem_local_op_st.ratio |
nvlink_data_receive_efficiency |
|
nvlink_data_transmission_efficiency |
|
nvlink_overhead_data_received |
|
nvlink_overhead_data_transmitted |
|
nvlink_receive_throughput |
|
nvlink_total_data_received |
|
nvlink_total_data_transmitted |
|
nvlink_total_nratom_data_transmitted |
|
nvlink_total_ratom_data_transmitted |
|
nvlink_total_response_data_received |
|
nvlink_total_write_data_transmitted |
|
nvlink_transmit_throughput |
|
nvlink_user_data_received |
|
nvlink_user_data_transmitted |
|
nvlink_user_nratom_data_transmitted |
|
nvlink_user_ratom_data_transmitted |
|
nvlink_user_response_data_received |
|
nvlink_user_write_data_transmitted |
|
pcie_total_data_received |
pcie__read_bytes.sum |
pcie_total_data_transmitted |
pcie__write_bytes.sum |
shared_efficiency |
smsp__sass_average_data_bytes_per_wavefront_mem_shared.pct |
shared_load_throughput |
l1tex__data_pipe_lsu_wavefronts_mem_shared_op_ld.sum.per_second |
shared_load_transactions |
l1tex__data_pipe_lsu_wavefronts_mem_shared_op_ld.sum |
shared_load_transactions_per_request |
|
shared_store_throughput |
l1tex__data_pipe_lsu_wavefronts_mem_shared_op_st.sum.per_second |
shared_store_transactions |
l1tex__data_pipe_lsu_wavefronts_mem_shared_op_st.sum |
shared_store_transactions_per_request |
|
shared_utilization |
l1tex__data_pipe_lsu_wavefronts_mem_shared.avg.pct_of_peak_sustained_elapsed |
single_precision_fu_utilization |
smsp__pipe_fma_cycles_active.avg.pct_of_peak_sustained_active |
sm_efficiency |
smsp__cycles_active.avg.pct_of_peak_sustained_elapsed |
sm_tex_utilization |
l1tex__texin_sm2tex_req_cycles_active.avg.pct_of_peak_sustained_elapsed |
special_fu_utilization |
smsp__inst_executed_pipe_xu.avg.pct_of_peak_sustained_active |
stall_constant_memory_dependency |
smsp__warp_issue_stalled_imc_miss_per_warp_active.pct |
stall_exec_dependency |
smsp__warp_issue_stalled_short_scoreboard_per_warp_active.pct + smsp__warp_issue_stalled_wait_per_warp_active.pct |
stall_inst_fetch |
smsp__warp_issue_stalled_no_instruction_per_warp_active.pct |
stall_memory_dependency |
smsp__warp_issue_stalled_long_scoreboard_per_warp_active.pct |
stall_memory_throttle |
smsp__warp_issue_stalled_drain_per_warp_active.pct + smsp__warp_issue_stalled_lg_throttle_per_warp_active.pct |
stall_not_selected |
smsp__warp_issue_stalled_not_selected_per_warp_active.pct |
stall_other |
smsp__warp_issue_stalled_misc_per_warp_active.pct + smsp__warp_issue_stalled_dispatch_stall_per_warp_active.pct |
stall_pipe_busy |
smsp__warp_issue_stalled_mio_throttle_per_warp_active.pct + smsp__warp_issue_stalled_math_pipe_throttle_per_warp_active.pct |
stall_sleeping |
smsp__warp_issue_stalled_sleeping_per_warp_active.pct |
stall_sync |
smsp__warp_issue_stalled_membar_per_warp_active.pct + smsp__warp_issue_stalled_barrier_per_warp_active.pct |
stall_texture |
smsp__warp_issue_stalled_tex_throttle_per_warp_active.pct |
surface_atomic_requests |
l1tex__t_requests_pipe_tex_mem_surface_op_atom.sum |
surface_load_requests |
l1tex__t_requests_pipe_tex_mem_surface_op_ld.sum |
surface_reduction_requests |
l1tex__t_requests_pipe_tex_mem_surface_op_red.sum |
surface_store_requests |
l1tex__t_requests_pipe_tex_mem_surface_op_st.sum |
sysmem_read_bytes |
lts__t_sectors_aperture_sysmem_op_read* 32 |
sysmem_read_throughput |
lts__t_sectors_aperture_sysmem_op_read.sum.per_second |
sysmem_read_transactions |
lts__t_sectors_aperture_sysmem_op_read.sum |
sysmem_read_utilization |
|
sysmem_utilization |
|
sysmem_write_bytes |
lts__t_sectors_aperture_sysmem_op_write * 32 |
sysmem_write_throughput |
lts__t_sectors_aperture_sysmem_op_write.sum.per_second |
sysmem_write_transactions |
lts__t_sectors_aperture_sysmem_op_write.sum |
sysmem_write_utilization |
|
tensor_precision_fu_utilization |
sm__pipe_tensor_cycles_active.avg.pct_of_peak_sustained_active |
tex_cache_hit_rate |
l1tex__t_sector_hit_rate.pct |
tex_cache_throughput |
|
tex_cache_transactions |
l1tex__lsu_writeback_active.avg.pct_of_peak_sustained_active + l1tex__tex_writeback_active.avg.pct_of_peak_sustained_active |
tex_fu_utilization |
smsp__inst_executed_pipe_tex.avg.pct_of_peak_sustained_active |
tex_sm_tex_utilization |
l1tex__f_tex2sm_cycles_active.avg.pct_of_peak_sustained_elapsed |
tex_sm_utilization |
sm__mio2rf_writeback_active.avg.pct_of_peak_sustained_elapsed |
tex_utilization |
|
texture_load_requests |
l1tex__t_requests_pipe_tex_mem_texture.sum |
warp_execution_efficiency |
smsp__thread_inst_executed_per_inst_executed.ratio |
warp_nonpred_execution_efficiency |
smsp__thread_inst_executed_per_inst_executed.pct |
2.15.4. Events Mapping Table#
The table below lists the CUPTI events for devices with compute capability 7.0. For each CUPTI event the closest equivalent Perfworks metric or formula is given. If no equivalent Perfworks metric is available the column is left blank. Note that there can be some difference in the values between the CUPTI event and the Perfworks metrics.
Perfworks metrics starting with sm__ are collected per-SM. Metrics starting with smsp__ are collected per-SM subpartition. However, all corresponding CUPTI events are collected per-SM, only.
CUPTI Event |
Perfworks Metric or Formula |
|---|---|
active_cycles |
sm__cycles_active.sum |
active_cycles_pm |
sm__cycles_active.sum |
active_cycles_sys |
sys__cycles_active.sum |
active_warps |
sm__warps_active.sum |
active_warps_pm |
sm__warps_active.sum |
atom_count |
smsp__inst_executed_op_generic_atom_dot_alu.sum |
elapsed_cycles_pm |
sm__cycles_elapsed.sum |
elapsed_cycles_sm |
sm__cycles_elapsed.sum |
elapsed_cycles_sys |
sys__cycles_elapsed.sum |
fb_subp0_read_sectors |
dram__sectors_read.sum |
fb_subp1_read_sectors |
dram__sectors_read.sum |
fb_subp0_write_sectors |
dram__sectors_write.sum |
fb_subp1_write_sectors |
dram__sectors_write.sum |
global_atom_cas |
smsp__inst_executed_op_generic_atom_dot_cas.sum |
gred_count |
smsp__inst_executed_op_global_red.sum |
inst_executed |
sm__inst_executed.sum |
inst_executed_fma_pipe_s0 |
smsp__inst_executed_pipe_fma.sum |
inst_executed_fma_pipe_s1 |
smsp__inst_executed_pipe_fma.sum |
inst_executed_fma_pipe_s2 |
smsp__inst_executed_pipe_fma.sum |
inst_executed_fma_pipe_s3 |
smsp__inst_executed_pipe_fma.sum |
inst_executed_fp16_pipe_s0 |
smsp__inst_executed_pipe_fp16.sum |
inst_executed_fp16_pipe_s1 |
smsp__inst_executed_pipe_fp16.sum |
inst_executed_fp16_pipe_s2 |
smsp__inst_executed_pipe_fp16.sum |
inst_executed_fp16_pipe_s3 |
smsp__inst_executed_pipe_fp16.sum |
inst_executed_fp64_pipe_s0 |
smsp__inst_executed_pipe_fp64.sum |
inst_executed_fp64_pipe_s1 |
smsp__inst_executed_pipe_fp64.sum |
inst_executed_fp64_pipe_s2 |
smsp__inst_executed_pipe_fp64.sum |
inst_executed_fp64_pipe_s3 |
smsp__inst_executed_pipe_fp64.sum |
inst_issued1 |
sm__inst_issued.sum |
l2_subp0_read_sector_misses |
lts__t_sectors_op_read_lookup_miss.sum |
l2_subp1_read_sector_misses |
lts__t_sectors_op_read_lookup_miss.sum |
l2_subp0_read_sysmem_sector_queries |
lts__t_sectors_aperture_sysmem_op_read.sum |
l2_subp1_read_sysmem_sector_queries |
lts__t_sectors_aperture_sysmem_op_read.sum |
l2_subp0_read_tex_hit_sectors |
lts__t_sectors_srcunit_tex_op_read_lookup_hit.sum |
l2_subp1_read_tex_hit_sectors |
lts__t_sectors_srcunit_tex_op_read_lookup_hit.sum |
l2_subp0_read_tex_sector_queries |
lts__t_sectors_srcunit_tex_op_read.sum |
l2_subp1_read_tex_sector_queries |
lts__t_sectors_srcunit_tex_op_read.sum |
l2_subp0_total_read_sector_queries |
lts__t_sectors_op_read.sum + lts__t_sectors_op_atom.sum + lts__t_sectors_op_red.sum |
l2_subp1_total_read_sector_queries |
lts__t_sectors_op_read.sum + lts__t_sectors_op_atom.sum + lts__t_sectors_op_red.sum |
l2_subp0_total_write_sector_queries |
lts__t_sectors_op_write.sum + lts__t_sectors_op_atom.sum + lts__t_sectors_op_red.sum |
l2_subp1_total_write_sector_queries |
lts__t_sectors_op_write.sum + lts__t_sectors_op_atom.sum + lts__t_sectors_op_red.sum |
l2_subp0_write_sector_misses |
lts__t_sectors_op_write_lookup_miss.sum |
l2_subp1_write_sector_misses |
lts__t_sectors_op_write_lookup_miss.sum |
l2_subp0_write_sysmem_sector_queries |
lts__t_sectors_aperture_sysmem_op_write.sum |
l2_subp1_write_sysmem_sector_queries |
lts__t_sectors_aperture_sysmem_op_write.sum |
l2_subp0_write_tex_hit_sectors |
lts__t_sectors_srcunit_tex_op_write_lookup_hit.sum |
l2_subp1_write_tex_hit_sectors |
lts__t_sectors_srcunit_tex_op_write_lookup_hit.sum |
l2_subp0_write_tex_sector_queries |
lts__t_sectors_srcunit_tex_op_write.sum |
l2_subp1_write_tex_sector_queries |
lts__t_sectors_srcunit_tex_op_write.sum |
not_predicated_off_thread_inst_executed |
smsp__thread_inst_executed_pred_on.sum |
pcie_rx_active_pulse |
|
pcie_tx_active_pulse |
|
prof_trigger_00 |
|
prof_trigger_01 |
|
prof_trigger_02 |
|
prof_trigger_03 |
|
prof_trigger_04 |
|
prof_trigger_05 |
|
prof_trigger_06 |
|
prof_trigger_07 |
|
inst_issued0 |
smsp__issue_inst0.sum |
sm_cta_launched |
sm__ctas_launched.sum |
shared_load |
smsp__inst_executed_op_shared_ld.sum |
shared_store |
smsp__inst_executed_op_shared_st.sum |
generic_load |
smsp__inst_executed_op_generic_ld.sum |
generic_store |
smsp__inst_executed_op_generic_st.sum |
global_load |
smsp__inst_executed_op_global_ld.sum |
global_store |
smsp__inst_executed_op_global_st.sum |
local_load |
smsp__inst_executed_op_local_ld.sum |
local_store |
smsp__inst_executed_op_local_st.sum |
shared_atom |
smsp__inst_executed_op_shared_atom.sum |
shared_atom_cas |
smsp__inst_executed_op_shared_atom_dot_cas.sum |
shared_ld_bank_conflict |
l1tex__data_bank_conflicts_pipe_lsu_mem_shared_op_ld.sum |
shared_st_bank_conflict |
l1tex__data_bank_conflicts_pipe_lsu_mem_shared_op_st.sum |
shared_ld_transactions |
l1tex__data_pipe_lsu_wavefronts_mem_shared_op_ld.sum |
shared_st_transactions |
l1tex__data_pipe_lsu_wavefronts_mem_shared_op_st.sum |
tensor_pipe_active_cycles_s0 |
smsp__pipe_tensor_cycles_active.sum |
tensor_pipe_active_cycles_s1 |
smsp__pipe_tensor_cycles_active.sum |
tensor_pipe_active_cycles_s2 |
smsp__pipe_tensor_cycles_active.sum |
tensor_pipe_active_cycles_s3 |
smsp__pipe_tensor_cycles_active.sum |
thread_inst_executed |
smsp__thread_inst_executed.sum |
warps_launched |
smsp__warps_launched.sum |
2.16. Evolution of the profiling APIs#
GPU performance metric collection has evolved through several profiling API generations, each addressing architectural changes and usability requirements. Initially, the CUPTI Event API (see CUPTI 12.9 doc) and CUPTI Metric API (see CUPTI 12.9 doc) were used, but these were not supported on Turing and later GPU architectures. These APIs are dropped in the CUDA 13.0 release.
With the CUDA 10.0 release, the CUPTI Profiling API for target APIs and the Perfworks Metric API for host APIs were introduced to provide low and deterministic profiling overhead. The Perfworks API is low-level and subject to interface-level changes. These APIs are supported from Turing to Blackwell GPU architectures but will not support future GPU architectures. The CUPTI Profiling API and the Perfworks Metric API are deprecated in the CUDA 13.0 release.
As CUPTI has evolved, there was a need to introduce a new set of profiling APIs to simplify usage, shield users
from low-level concepts, and ease adaptation to changes in the Perfworks Metric API. Consequently, CUPTI added a new
set of host APIs around the Perfworks Metric API in the CUDA 12.6 GA release. These host APIs are provided in the header
cupti_profiler_host.h and are referred to as the CUPTI Profiler Host API.
Complementing this, a new set of target APIs was added in CUDA 12.6 Update 2 to simplify profiling for new users
and align the call structure with other profiling APIs for faster learning and better adaptability. These target
APIs are provided in the header cupti_range_profiler.h and are referred to as the
CUPTI Range Profiling API.
For range profiling, it is strongly recommended that users utilize the new
host and target APIs introduced in CUDA 12.6. The introduction of the new CUPTI Range Profiling API was necessary to
address the limitations of the existing Profiling APIs and to provide a more user-friendly and adaptable profiling
experience. The CUPTI Profiling API is deprecated in the CUDA 13.0 release.
Therefore, transitioning to the new host and target APIs will ensure continued support,
compatibility with the latest hardware, and access to enhanced profiling capabilities.
GPU architectures supported by different CUPTI APIs are listed at the table. It is important to note that one cannot mix the usage of different sets of profiling APIs.
2.17. CUPTI overhead#
CUPTI incurs overhead when used for tracing or profiling of the CUDA application. Overhead can vary significantly from one application to another. It largely depends on the density of the CUDA activities in the application; lesser the CUDA activities, less the CUPTI overhead. In general overhead of tracing i.e. activity APIs is much lesser than the metrics profiling APIs.
2.17.1. Tracing Overhead#
One of the goal of the tracing APIs is to provide a non-invasive collection of the timing information of the CUDA activities. Tracing is a low-overhead mechanism for collecting fine-grained runtime information.
2.17.1.1. Execution overhead#
Consider below points which can affect the execution overhead of the application:
Enable only the activities and callbacks which are of interest.
Return from the callbacks as early as possible. Callbacks are issued from the host, these can block the work submission on the GPU if not returned early since CUPTI and thus the CUDA driver can’t make the forward progress on the host thread which issues the callback.
APIs
cuptiActivityEnableDriverApiandcuptiActivityEnableRuntimeApican be used to limit the tracing of CUDA APIs that are of interest.For CUDA Graphs, if node level visibility is not desired, switching to the graph-level tracing from node-level tracing can help in reducing the collection overhead significantly. Use activity kind
CUPTI_ACTIVITY_KIND_GRAPH_TRACEto enable graph-level tracing.For activity buffer requested callback, the client should return the buffer as quickly as possible as this callback is issued from the application thread. Client can pre-allocate a pool of activity buffers and return an empty buffer from the pool when requested by CUPTI.
CUPTI initializes the new activity buffer with zero values using the memset call before using it. This operation can be skipped if user provides the zero value buffer and sets the attribute
CUPTI_ACTIVITY_ATTR_ZEROED_OUT_ACTIVITY_BUFFERof the enumCUpti_ActivityAttribute.Client can request CUPTI to maintain the activity buffers at the thread level instead of global buffers. This can be achieved by setting the option
CUPTI_ACTIVITY_ATTR_PER_THREAD_ACTIVITY_BUFFERof the enumCUpti_ActivityAttribute. This can help in reducing the collection overhead for applications which launch CUDA activities from multiple host threads. Starting from CUDA 13.0, this option is enabled by default.Reduce the frequency of buffer flushing as it can be an expensive operation. This can be achieved by setting a high flush period using the API
cuptiActivityFlushPeriodto avoid internal flushing done by CUPTI and by reducing the frequency of the APIcuptiActivityFlushAll. This approach might result in increased memory footprint on host and device.For device buffers, CUPTI allocates a new buffer when it runs out of the buffers from the pool, and this happens in the main application thread, which might result in stalls in the critical path. This can be avoided by either pre-allocating more device buffers or increasing the size of the device buffer using the attributes
CUPTI_ACTIVITY_ATTR_DEVICE_BUFFER_POOL_LIMITandCUPTI_ACTIVITY_ATTR_DEVICE_BUFFER_SIZErespectively from the enumCUpti_ActivityAttribute.Serial kernel trace enabled using the activity kind
CUPTI_ACTIVITY_KIND_KERNELcan significantly change the overall performance characteristics of the application because all kernel executions are serialized on the GPU. For applications which use only a single CUDA stream and therefore cannot have concurrent kernel execution, this mode can be useful as it usually (not always) incurs less profiling overhead compared to the concurrent kernel mode.Concurrent kernel trace enabled using the activity kind
CUPTI_ACTIVITY_KIND_CONCURRENT_KERNELdoesn’t affect the concurrency of the kernels in the application. In this mode, CUPTI instruments the kernel code to collect the timing information. A single instrumentation code is generated at the time of loading the CUDA module and applied to each kernel during the kernel execution. Instrumentation code generation overhead is attributed asCUPTI_ACTIVITY_OVERHEAD_CUPTI_INSTRUMENTATIONin the activity recordCUpti_ActivityOverhead2.Due to the code instrumentation, concurrent kernel mode can add significant runtime overhead if used on kernels that execute a large number of blocks and that have short execution duration. Making use of HES feature can resolve this issue as it does not use code instrumentation.
2.17.1.2. Memory overhead#
CUPTI allocates device and pinned system memory for storing the tracing information:
Static memory allocation: CUPTI allocates 3 buffers of 3 MB each in the pinned system memory for each CUDA context by default during the context creation phase. This is used for storing the concurrent kernel, serial kernel, memcopy and memset tracing information and these buffers are sufficient for storing information for about 300K such activities. The number of buffers is controlled using the attribute
CUPTI_ACTIVITY_ATTR_DEVICE_BUFFER_PRE_ALLOCATE_VALUEand the size of the buffer is determined by the attributeCUPTI_ACTIVITY_ATTR_DEVICE_BUFFER_SIZE. User can change the buffer size at any time during the profiling session, but this setting takes effect only for new buffer allocations. It is recommended to adjust the buffer size before the creation of any CUDA context to make sure that all the pre-allocated buffers are of the adjusted size.Dynamic memory allocation: Once profiling buffers to store the tracing information are exhausted, CUPTI allocates another buffer of the same size. Note that memory footprint will not always scale with the kernel, memcopy, memset count because CUPTI reuses the buffer after processing all the records in the buffer. For applications with a high density of these activities CUPTI may allocate more buffers.
All of the CUPTI allocated memory associated with a context is freed when the context is destroyed. Memory allocation overhead is attributed as CUPTI_ACTIVITY_OVERHEAD_CUPTI_RESOURCE in the activity record CUpti_ActivityOverhead2. If there are no CUDA contexts created then CUPTI will not allocate corresponding buffers.
CUPTI allocates memory to store unique kernel names, NVTX ranges, CUDA module cubin:
Kernel trace: For kernel tracing enabled using the activity kind
CUPTI_ACTIVITY_KIND_KERNELorCUPTI_ACTIVITY_KIND_CONCURRENT_KERNELCUPTI allocates memory to store the kernel name in the records. It is recommended to not free the memory allocated for the kernel name in the kernel activity record as the kernel name memory space might be common across all kernel records having the same kernel name.NVTX ranges: For NVTX enabled using the activity kind
CUPTI_ACTIVITY_KIND_MARKERCUPTI allocates memory to store the range name in the records. It is recommended to not free the memory allocated for the NVTX range name in the marker activity record as the NVTX range name memory space will be common across all NVTX range records having the same name.CUDA module cubin: CUPTI caches copies of cubin images at the time of loading CUDA modules. This is done only for the profiling features that need it are enabled. All of the CUPTI allocated memory associated with the cubin image of the module is freed when the module is unloaded.
Device Activity: For device activity tracing enabled using the activity kind
CUPTI_ACTIVITY_KIND_DEVICECUPTI allocates memory to store the device name in the records. It is recommended to free the memory allocated for thenamefield after reading eachCUpti_ActivityDevice5record.
2.17.2. Profiling Overhead#
Metrics collection using CUPTI incurs runtime overhead. This overhead depends on the number and type of metrics selected. Since each metric is computed from one or more counter, metric overhead depends on the number and type of underlying counters. The overhead includes time spent in configuration of counters and reading of counter values.
Factors affecting the execution overhead under profiling are:
Overhead is less for hardware provided metrics. Metrics which don’t have string “sass” in the name fall in this category.
Software instrumented metrics are expensive as CUPTI needs to instrument the kernel to collect these. Further these metrics cannot be combined with any other metric in the same pass as otherwise instrumented code will also contribute to the metric value. Metrics which have string “sass” in the name fall in this category.
In the serial mode, profiling may significantly change the overall performance characteristics of the application because all kernel executions are serialized on the GPU. This is done to enable tight metric collection around each kernel. The auto range mode serializes all kernel executions on the GPU. On the other hand, kernel concurrency can be maintained by using the user range mode.
When all the requested metrics cannot be collected in the single pass due to hardware or software limitations, one needs to replay the exact same set of GPU workloads multiple times. This can be achieved at the kernel granularity by replaying kernel multiple times or by launching the entire application multiple times. CUPTI provides support for kernel replay only. Application replay can be done by the CUPTI client.
When kernel replay is used the overhead to save and restore kernel state for each replay pass depends on the amount of device memory used by the kernel. Application replay is expected to perform better than kernel replay for the case when the size of device memory used by the kernel is high.
2.18. Reproducibility#
Some CUPTI APIs are not guaranteed to return perfectly reproducible results between runs. Numerous factors introduce measurable run-to-run variation in software and hardware performance. There are several suggestions for users who want more reproducible results.
2.18.1. Fixed Clock Rate#
Many metrics are directly affected by GPU SM and memory clock frequencies. By default, the GPU keeps clock rates low until work is launched, but clock rates do not boost to full speed immediately, so initial work launched after an idle period may run at low clock speed. Additionally, the target clock rates may vary based on power, thermal, and other factors. Complex interactions between different part of the system mean that these dynamic clock rates may not be reproducible between runs.
To reduce the effect of dynamic clock rates, it is possible to set a fixed clock rate. The GPU will no longer opportunistically boost clock rates above this rate, but it will eliminate the variability after GPU idle and effects of power and thermal variation. Several different methods exist to fix the SM or memory clock rates. The simplest may be nvidia-smi, but see this NVIDIA blog entry for more suggestions.
2.18.2. Serialization#
Work may be submitted to the GPU which can run asynchronously and concurrently. This improves performance by using more of the GPU resources at once, but complicates profiling in two ways - first, kernels running concurrently can impact each other through contention for shared resources. Measurements of these shared resources will include the impact of any concurrently kernels, and it may not be possible to determine the particular impact of any given kernel. Second, by contending for resources with other kernels that are running without precisely guaranteed timing, the timing for a given kernel may be impacted in irreproducible ways.
When CUPTI_ACTIVITY_KIND_CONCURRENT_KERNEL is used to measure kernel timing, kernels are allowed to run concurrently on device. CUPTI_ACTIVITY_KIND_KERNEL may be used instead to measure serialized kernel timing. This will eliminate GPU concurrency within this process, and should provide better run-to-run reproducibility, but the timing may not be as realistic in this mode - kernels will not have to contend for shared resources, which can impact their performance.
2.18.3. Other Issues#
Beyond variable clock rates and concurrent kernel execution, several other factors can affect application and kernel performance.
The driver normally does not stay loaded when not in use. It takes some time to load and initialize the driver, which may affect performance in noticeable and somewhat irreproducible ways. It is possible to keep the driver persistently loaded which will eliminate this initialization overhead. nvidia-persistenced is one tool to configure this; it can also be configured through nvidia-smi.
2.19. Logging Using NVLOG#
This section describes how to enable and control logging in your CUPTI-based tool using the NVLOG system.
Quick Start
Follow these simple steps to get NVLOG output from your tool:
Create a Configuration File
Create a file named
nvlog.configand add the following content:# Enable all info/warn/error/fatal logs for Cupti_Public + 100iI 100wW 100eE 100fF Cupti_Public # Set log output file $ cupti-nvlog.txt # Also print logs to console UseStdout # Force log flushing for real-time debugging (optional) ForceFlush # Recommended log format Format $sevc$time| ${name:0} | $proc:${tid:8} | ${file:0}:${line:0} [${sfunc:0}]: $textSet the Environment Variable
NVLOG looks for the configuration using the
NVLOG_CONFIG_FILEenvironment variable.On Linux, run:
export NVLOG_CONFIG_FILE=/path/to/nvlog.config
On Windows, run:
set NVLOG_CONFIG_FILE=C:\path\to\nvlog.config
Run Your CUPTI Tool
Once configured, your tool will begin logging to both the terminal and the
cupti-nvlog.txtfile.
Advanced Configuration
To reduce verbosity and only show warnings and higher:
+ 0iI 100wW 100eE 100fF Cupti_Public
For deterministic log output (useful for comparisons between runs):
Format | $sev:$level | $file($line) | $sfunc | $text
Troubleshooting
If no logs appear, verify:
The environment variable is correctly set.
The logger domain is
Cupti_Public.Your config file has no syntax errors.
2.20. Samples#
The CUPTI installation includes several samples that demonstrate the use of the CUPTI APIs. These samples are located under <CUDA_TOOLKIT_DIR>/extras/CUPTI/samples when CUPTI is installed using the CUDA Toolkit.
These samples can be referred to for the usage of different APIs supported by CUPTI. Note that a sample might not be supported on all GPU architectures. Please refer to the section GPU Support for the GPU architectures supported by different CUPTI APIs used in the samples.
The samples include:
Activity API
- activity_trace_async
This sample shows how to collect a trace of CPU and GPU activity using the new asynchronous activity buffer APIs.
- callback_timestamp
This sample shows how to use the callback API to record a trace of API start and stop times.
- cuda_graphs_trace
This sample shows how to collect the trace of CUDA graphs and correlate the graph node launch to the node creation API using CUPTI callbacks.
- cuda_memory_trace
This sample shows how to collect the trace of CUDA memory operations. The sample also traces CUDA memory operations done via default memory pool.
- cupti_correlation
This sample shows how to do the correlation between CUDA APIs and corresponding GPU activities.
- cupti_external_correlation
This sample shows how to do the correlation of CUDA API activity records with external APIs.
- cupti_finalize
This sample shows how to use API
cuptiFinalize()to dynamically detach and attach CUPTI.
- cupti_nvtx
This sample shows how to receive NVTX callbacks and collect NVTX records in CUPTI.
- cupti_nvtx_ext_payload
This sample shows how to collect NVTX records and parse/decode NVTX extended payloads from CUPTI activity records.
- cupti_trace_injection
This sample shows how to build an injection library using the CUPTI activity and callback APIs. It can be used to trace CUDA APIs and GPU activities for any CUDA application. It does not require the CUDA application to be modified.
- cupti_user_defined_records
This sample shows how to use the CUPTI user-defined records feature to define and collect custom activity records with only the fields needed for analysis.
- nvlink_bandwidth
This sample shows how to collect NVLink topology and NVLink throughput metrics in continuous mode.
- openacc_trace
This sample shows how to use CUPTI APIs for OpenACC data collection.
Host Profiling API
- cupti_metric_properties
This sample shows how to query various properties of metrics using the Host Profiling APIs. The sample shows collection method (hardware or software) and number of passes required to collect a list of metrics.
Range Profiling API
- callback_profiling
This sample shows how to use callback and range profiling APIs to collect the metrics during the execution of a kernel. It shows how to use different phases of profiling i.e. enumeration, configuration, collection and evaluation in the appropriate callbacks.
- concurrent_profiling
This sample shows how to use the range profiling API to record metrics from concurrent kernels launched in two different ways - using multiple streams on a single device, and using multiple threads with multiple devices.
- profiling_injection
This sample for Linux systems shows how to build an injection library which can automatically enable range profiling API using Auto Ranges with Kernel Replay mode. It can attach to an application which was not instrumented using CUPTI and profile any kernel launches.
- range_profiling
This sample shows how to use range profiling APIs to collect metrics using different range modes - auto and user, and replay modes - kernel and user.
PC Sampling API
- pc_sampling_continuous
This injection sample shows how to collect PC Sampling profiling information using the PC Sampling APIs. A perl script libpc_sampling_continuous.pl is provided to run the CUDA application with different PC sampling options. Use the command ./libpc_sampling_continuous.pl –help to list all the options. The CUDA application code does not need to be modified. Refer the README.txt file shipped with the sample for instructions to build and use the injection library.
- pc_sampling_start_stop
This sample shows how to collect PC Sampling profiling information for kernels within a range using the PC Sampling start/stop APIs.
- pc_sampling_utility
This utility takes the pc sampling data file generated by the pc_sampling_continuous injection library as input. It prints the stall reason counter values at the GPU assembly instruction level. It also does GPU assembly to CUDA-C source correlation and shows the CUDA-C source file name and line number. Refer the README.txt file shipped with the sample for instructions to build and run the utility.
PM Sampling API
- pm_sampling
This sample shows the usage of the PM sampling APIs for collecting sampling data for a list of metrics for kernels launched within a range using the PM sampling start/stop APIs.
SASS Metric API
- sass_metric
This sample shows how to use the SASS metric API to enumerate metrics supported by a device and how to collect metrics at the source level using SASS patching.
Profiling API
- extensions
This includes utilities used in some of the samples.
- autorange_profiling
This sample shows how to use profiling APIs to collect metrics in autorange mode.
- nested_range_profiling
This sample shows how to profile nested ranges using the Profiling APIs.
- userrange_profiling
This sample shows how to use profiling APIs to collect metrics in user specified range mode.
Checkpoint API
- checkpoint_kernels
This sample shows how to use the Checkpoint API to restore device memory, allowing a kernel to be replayed, even if it modifies its input data.
2.21. Troubleshooting#
Troubleshooting CUPTI issues involves a combination of environment setup, code review, and use of specific CUPTI APIs for diagnostics. Here are key steps and considerations for effective troubleshooting:
Verify Environment and Installation
Check CUPTI Library Path: Ensure that the CUPTI library directory is included in your system’s PATH (on Windows) or LD_LIBRARY_PATH (on Linux). Missing or misconfigured paths are a common source of errors like “CUPTI could not be loaded or symbol could not be found”.
CUDA Compatibility: Confirm that the CUPTI version matches your installed CUDA toolkit and driver versions. It’s essential to refer to the CUDA Toolkit and Corresponding Driver Versions table in the CUDA Toolkit Release Notes to determine the minimum CUDA driver version required for each release of CUPTI corresponding to a CUDA Toolkit release. Attempting to use CUPTI calls with an incompatible CUDA driver version will result in a
CUPTI_ERROR_NOT_INITIALIZEDerror code.
Code and Integration Issues
Consistent API Usage: When porting CUPTI code between projects, ensure all initialization and configuration steps are replicated. Inconsistent or missing setup can result in all-zero metric values or missing data.
Sample Code Reference: For proper CUPTI API usage, consult the official NVIDIA samples included with the CUDA Toolkit (extras/CUPTI/samples for C/C++ and cupti-python-samples for Python). These demonstrate CUPTI API flow and reliable patterns for profiling—review and adapt them to ensure your code is robust and compatible with current CUDA standards.
CUPTI supports the NVLOG interface for logging and debugging purposes. NVLOG provides a standardized and configurable logging and error-reporting library, enabling detailed logging with various severity levels (Info, Warning, Error, Fatal) and output options including files and stdout. For more details, refer to the section Logging Using NVLOG.
Obfuscated symbols are provided for Linux x86_64 platform, it helps us in speeding up the debug process for issues like crash, hang etc. See https://developer.nvidia.com/blog/cuda-toolkit-symbol-server/ for information on how to use obfuscated symbols. Symbol server address is: https://cudatoolkit-symbols.nvidia.com/.
Common issues associated with error codes:
CUPTI_ERROR_MULTIPLE_SUBSCRIBERS_NOT_SUPPORTED - CUPTI only allows one callback subscriber (profiler or tool) to be active at a time within a process. This error occurs when another CUPTI client—such as a different profiling tool (e.g., Nsight Systems), a monitoring service, or a framework with CUPTI integration (like PyTorch or TensorFlow) is already subscribed. Trying to start a new CUPTI profiling session while another is active will trigger this error, so you should ensure that only one CUPTI-based tool accesses the profiling API at any time in your environment. This error can also occur when another NVIDIA developer tool such as Nsight Compute, CUDA-GDB, or Compute Sanitizer is already active.
CUPTI_ERROR_NOT_INITIALIZED - CUPTI was unable to initialize. This can occur if the CUDA driver version is not compatible with the installed CUPTI version, if CUPTI is missing, or if there are environment configuration issues. When returned from the profiling APIs (such as
cuptiProfilerInitializeorcuptiProfilerHostInitialize), it may also indicate that CUPTI could not dynamically load the nvperf* libraries. Ensure thatlibnvperf_host.soandlibnvperf_target.so, which ship alongsidelibcupti.so, are discoverable by the dynamic linker (for example, by adding their directory toLD_LIBRARY_PATH).CUPTI_ERROR_INSUFFICIENT_PRIVILEGES - The application does not have sufficient privileges to perform the requested profiling operation. This often happens when the user lacks administrative rights or required capabilities (such as CAP_SYS_ADMIN) on the system.
CUPTI_ERROR_HARDWARE_BUSY - The performance monitoring hardware is currently in use by another client, preventing CUPTI from accessing it for profiling.
CUPTI_ERROR_INVALID_DEVICE - The specified device is not a valid CUDA device, which may be due to an incorrect device ID or a device not supported by CUPTI.
Profiling may significantly change the overall performance characteristics of the application. Refer to the section CUPTI Overhead for more details.
Keep your CUPTI version up to date to benefit from the latest features and bug fixes.