Integrating with DCGM
Integrating with DCGM Reader
DcgmReader.py is a class meant to facilitate gathering telemetry from DCGM so that the information can be viewed directly or integrated elsewhere. The sdk_samples directory contains a simple script which uses DcgmReader in DcgmReaderExample.py. The directory also contains other examples of how DcgmReader can be used to integrate into tools such as collectd (dcgm_collectd.py), Prometheus (dcgm_prometheus.py).
This section will walk through two simple ways of using DcgmReader to easily gather information from DCGM.
First, let's imagine that you want to publish some telemetry from DCGM on a message bus such as ZMQ. We can access this through two simple methods, the first of which asks for a dictionary.
All examples here assume that you have DCGM installed and nv-hostengine active locally.
Reading Using the Dictionary
# dictionary_reader_example.py
from DcgmReader import DcgmReader
import zmq
import time

def main():
        dr = DcgmReader()
        context = zmq.Context()
        socket = context.socket(zmq.PUB)
        socket.bind(“tcp://*:4096”)
        while True:
                ‘’’
                GetLatestGpuValuesAsFieldDict() gives us a dictionary that maps gpu ids to
                the GPU value dictionary. The GPU value dictionary maps each field name to
                the value for that field. This will publish each in the format
                GPU:<GPU ID>:fieldTag=value
                NOTE: if you prefer to use field ids instead of field tags (names) see
                GetLatestGpuValueAsFieldIdDict()
                ‘’’
                data = dr.GetLatestGpuValuesAsFieldDict()
                for gpuId in data:
                           for fieldTag in data[gpuId]:
                                  msg = "GPU:%s:%s=%s" % (str(gpuId), fieldTag, val.value)
                                  self.m_zmqSocket.send("%s %s" % (fieldTag, message))
if __name__ == ‘__main__’:
        main()
This method permits you to use DcgmReader without learning much about it.
Reading Using Inheritance
Using inheritance allows finer-grained controls.
# inheritance_reader_example.py
from DcgmReader import DcgmReader
import zmq
import time

class DcgmPublisher(DcgmReader):
    # Have our constructor also open a ZMQ socket for publishing.
    def __init__(self, port=4096):
        DcgmReader.__init__(self)
        context = zmq.Context()
        self.m_zmqSocket = context.socket(zmq.PUB)
        self.m_zmqSocket.bind("tcp://*:%d" % (port))

        '''
        Publish the fieldTag as the topic and the message data as
        "GPU:<GPU ID>:fieldTag=value"
        This overrides the method in DcgmReader for what to do with each
        field. If you want additional controls, consider overriding
        CustomDataHandler from the parent class.
        '''
        def CustomFieldHandler(self, gpuId, fieldId, fieldTag, val):
            topic = fieldTag
            message = "GPU:%s:%s=%s" % (str(gpuId), fieldTag, val.value)
            self.m_zmqSocket.send("%s %s" % (topic, message))

def main():
    dp = DcgmPublisher()

    while True:
        # Process is a method in DcgmReader that gets the data and starts
        # processing it, resulting in our version of CustomFieldHandler
        # getting called.
        dp.Process()
        time.sleep(15)

if __name__ == '__main__':
    main()
This method grants you more control over DcgmReader.
Completing the Proof of Concept
Either script – when run with DCGM installed and an active nv-hostengine - will publish data on port 4096. The following script will subscribe and print that data.
# subscriber_example.py
import zmq

port = 4096
context = zmq.Context()
socket = context.socket(zmq.SUB)
# Change localhost to the ip addr of the publisher if remote
socket.connect("tcp://localhost:%d" % (port))
socket.setsockopt(zmq.SUBSCRIBE, '')

while True:
    update = socket.recv()
    topic, message = update.split()
    print message
Additional Customization
DcgmReader gathers the following fields by default:
defaultFieldIds = [
    dcgm_fields.DCGM_FI_DRIVER_VERSION,
    dcgm_fields.DCGM_FI_NVML_VERSION,
    dcgm_fields.DCGM_FI_PROCESS_NAME,
    dcgm_fields.DCGM_FI_DEV_POWER_USAGE,
    dcgm_fields.DCGM_FI_DEV_GPU_TEMP,
    dcgm_fields.DCGM_FI_DEV_SM_CLOCK,
    dcgm_fields.DCGM_FI_DEV_GPU_UTIL,
    dcgm_fields.DCGM_FI_DEV_RETIRED_PENDING,
    dcgm_fields.DCGM_FI_DEV_RETIRED_SBE,
    dcgm_fields.DCGM_FI_DEV_RETIRED_DBE,
    dcgm_fields.DCGM_FI_DEV_ECC_SBE_VOL_TOTAL,
    dcgm_fields.DCGM_FI_DEV_ECC_DBE_VOL_TOTAL,
    dcgm_fields.DCGM_FI_DEV_ECC_SBE_AGG_TOTAL,
    dcgm_fields.DCGM_FI_DEV_ECC_DBE_AGG_TOTAL,
    dcgm_fields.DCGM_FI_DEV_FB_TOTAL,
    dcgm_fields.DCGM_FI_DEV_FB_FREE,
    dcgm_fields.DCGM_FI_DEV_FB_USED,
    dcgm_fields.DCGM_FI_DEV_PCIE_REPLAY_COUNTER,
    dcgm_fields.DCGM_FI_DEV_COMPUTE_PIDS,
    dcgm_fields.DCGM_FI_DEV_POWER_VIOLATION,
    dcgm_fields.DCGM_FI_DEV_THERMAL_VIOLATION,
    dcgm_fields.DCGM_FI_DEV_XID_ERRORS,
    dcgm_fields.DCGM_FI_DEV_NVLINK_CRC_FLIT_ERROR_COUNT_TOTAL,
    dcgm_fields.DCGM_FI_DEV_NVLINK_CRC_DATA_ERROR_COUNT_TOTAL,
    dcgm_fields.DCGM_FI_DEV_NVLINK_REPLAY_ERROR_COUNT_TOTAL,
    dcgm_fields.DCGM_FI_DEV_NVLINK_RECOVERY_ERROR_COUNT_TOTAL
    ]
There are hundreds more fields that DCGM provides, and you may be interested in monitoring different ones. You can control this in your script by instantiating DcgmReader with parameters:
# custom_fields_example.py
myFieldIds = [
    dcgm_fields.DCGM_FI_DEV_SM_CLOCK,
    dcgm_fields.DCGM_FI_DEV_MEM_CLOCK,
    dcgm_fields.DCGM_FI_DEV_APP_CLOCK,
    dcgm_fields.DCGM_FI_DEV_MEMORY_TEMP,
    dcgm_fields.DCGM_FI_DEV_GPU_TEMP,
    dcgm_fields.DCGM_FI_DEV_POWER_USAGE,
    dcgm_fields.DCGM_FI_DEV_GPU_UTIL,
    dcgm_fields.DCGM_FI_DEV_MEM_COPY_UTIL,
    dcgm_fields.DCGM_FI_DEV_COMPUTE_PIDS]
…
    # In main(), change the instantiation:
    dr = DcgmReader(fieldIds=myFieldIds)
…
- hostname: defaults to localhost. Controls the hostname[:port] where we connected to DCGM.
- fieldIds: explained above. Controls the fields we are going to watch and read in DCGM.
- updateFrequency: defaults to 10 seconds (specified in microseconds). Controls how often DCGM refreshes each field value.
- maxKeepAge: defaults to 1 hour (specified in seconds). Controls how long DCGM keeps data for each of the specified fields.
- ignoreList: defaults to an empty array. Specifies field ids that should be retrieved but should be ignored for processing. Usually used for metadata. • fieldGroupName: defaults to dcgm_fieldgroupData. Controls the name that DcgmReader gives to the group of fields we are watching. This is useful for running multiple instances of DcgmReader simultaneously
Integrating with Prometheus and Grafana
Starting the Prometheus Server
On the server side, configure Prometheus to read (scrape) the data being published by the dcgm_prometheus client. Just add a job to the scrape_configs section of the yaml Prometheus configuration file. See the following section of a working configuration:
# A scrape configuration containing exactly one endpoint to scrape:
scrape_configs:
  # The job name is added as a label `job=<job_name>` to any timeseries scraped from this config.
  - job_name: 'dcgm'

    # metrics_path defaults to '/metrics'
    # scheme defaults to 'http'.

    static_configs:
      - targets: ['hostnameWhereClientIsRunning:8000']
Replace 'hostnameWhereClientIsRunning' with the name or ip address of the host where the client is running, or localhost if both are executing on the same host.
Once the configure file has been updated, launch Prometheus with the specified configuration file:
$ ./prometheus --config.file=prometheus.yml
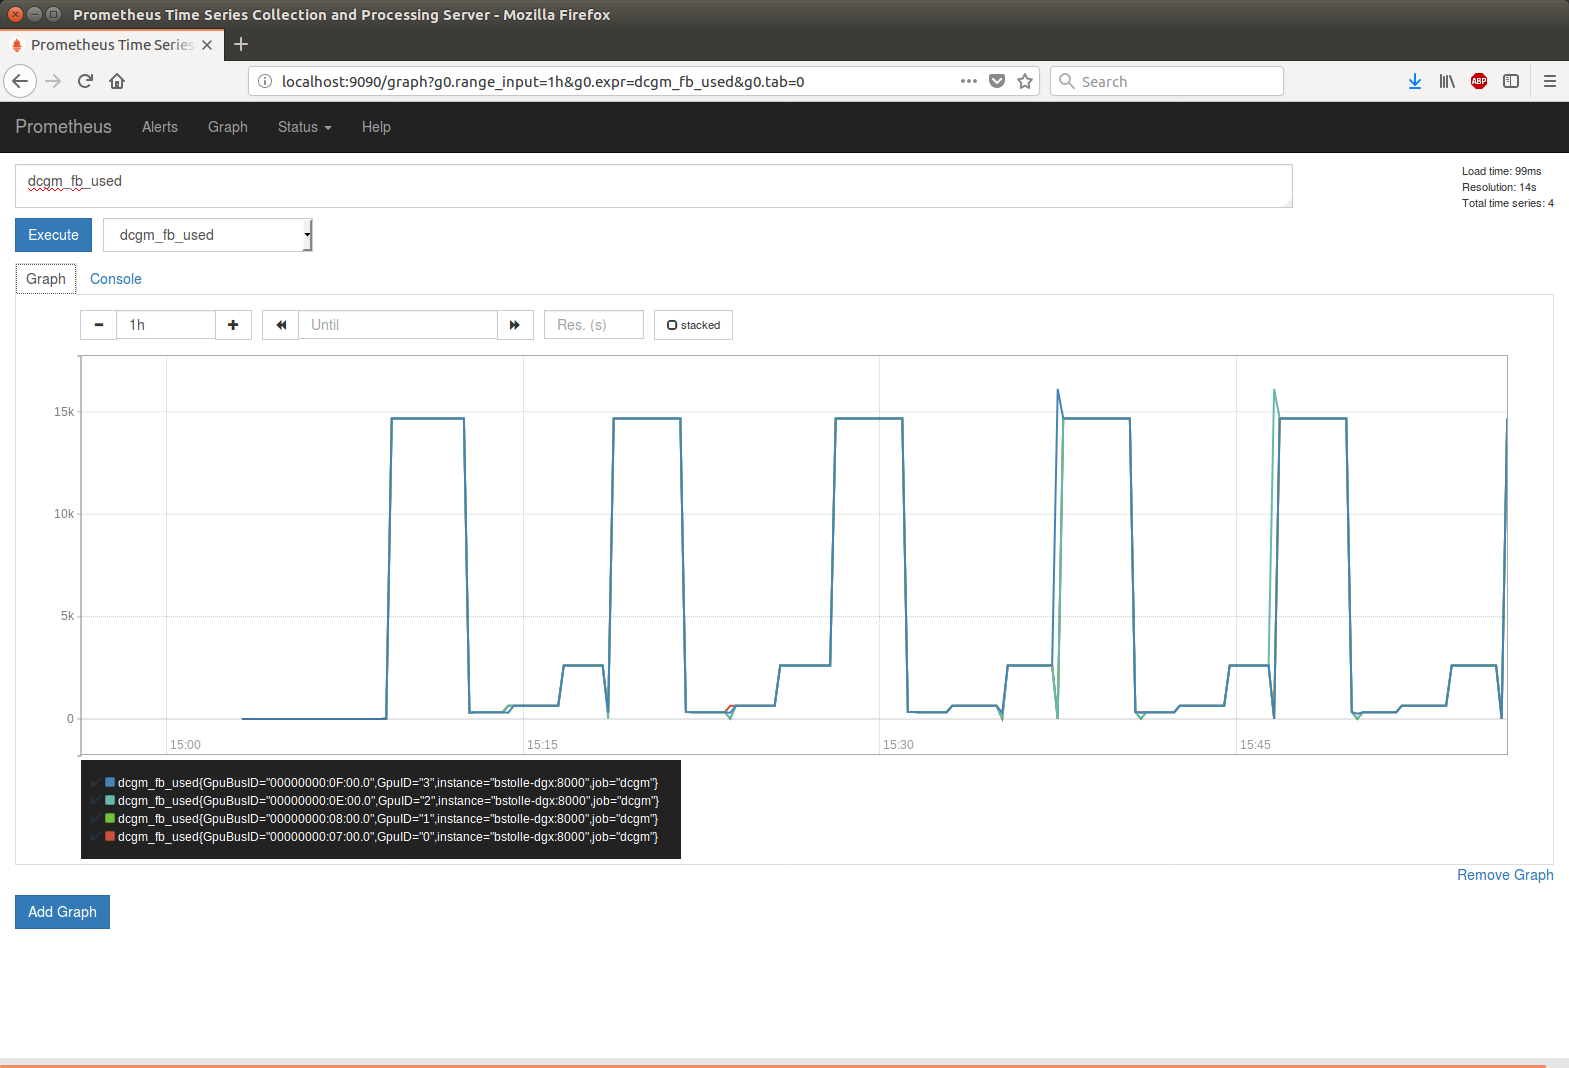
Verify that Prometheus is up and running by opening a browser to http://localhost:9090. Select a metric in the box next to the 'Execute' button, click the 'Execute' button, and then select the 'Graph' tab. The page should display:
Starting the Prometheus Client
The script dcgm_prometheus.py is provided as a fully functional Prometheus client that will publish timeseries data on a port to be read (scraped) by Prometheus. By default, this script will publish common fields read from a DCGM instance running locally every 10 seconds to localhost:8000. Information on controlling what is published, how often, and on what port will be in the section on customization.
On the client side, start this script. It can either connect to a standalone host engine or run on embedded in the script. To start an embedded host engine and check that it is publishing:
$ python dcgm_prometheus.py -e
$ curl localhost:8000 > tmp.txt
# HELP dcgm_sm_clock DCGM_PROMETHEUS
# TYPE dcgm_sm_clock gauge
dcgm_sm_clock{GpuBusID="00000000:08:00.0",GpuID="1"} 1480.0
dcgm_sm_clock{GpuBusID="00000000:07:00.0",GpuID="0"} 1480.0
dcgm_sm_clock{GpuBusID="00000000:0E:00.0",GpuID="2"} 1480.0
dcgm_sm_clock{GpuBusID="00000000:0F:00.0",GpuID="3"} 1480.0
# HELP dcgm_nvlink_flit_crc_error_count_total DCGM_PROMETHEUS
# TYPE dcgm_nvlink_flit_crc_error_count_total gauge
dcgm_nvlink_flit_crc_error_count_total{GpuBusID="00000000:08:00.0",GpuID="1"} 0.0
dcgm_nvlink_flit_crc_error_count_total{GpuBusID="00000000:0E:00.0",GpuID="2"} 0.0
dcgm_nvlink_flit_crc_error_count_total{GpuBusID="00000000:0F:00.0",GpuID="3"} 0.0
# HELP dcgm_power_usage DCGM_PROMETHEUS
# TYPE dcgm_power_usage gauge
dcgm_power_usage{GpuBusID="00000000:08:00.0",GpuID="1"} 294.969
dcgm_power_usage{GpuBusID="00000000:07:00.0",GpuID="0"} 273.121
dcgm_power_usage{GpuBusID="00000000:0E:00.0",GpuID="2"} 280.484
dcgm_power_usage{GpuBusID="00000000:0F:00.0",GpuID="3"} 281.301
# HELP dcgm_nvlink_data_crc_error_count_total DCGM_PROMETHEUS
# TYPE dcgm_nvlink_data_crc_error_count_total gauge
dcgm_nvlink_data_crc_error_count_total{GpuBusID="00000000:08:00.0",GpuID="1"} 0.0
dcgm_nvlink_data_crc_error_count_total{GpuBusID="00000000:0E:00.0",GpuID="2"} 0.0
dcgm_nvlink_data_crc_error_count_total{GpuBusID="00000000:0F:00.0",GpuID="3"} 0.0
...
The number of GPUs may vary, and the published field ids can be changed through configuration, but the output should conform to the above format.
Integrating with Grafana
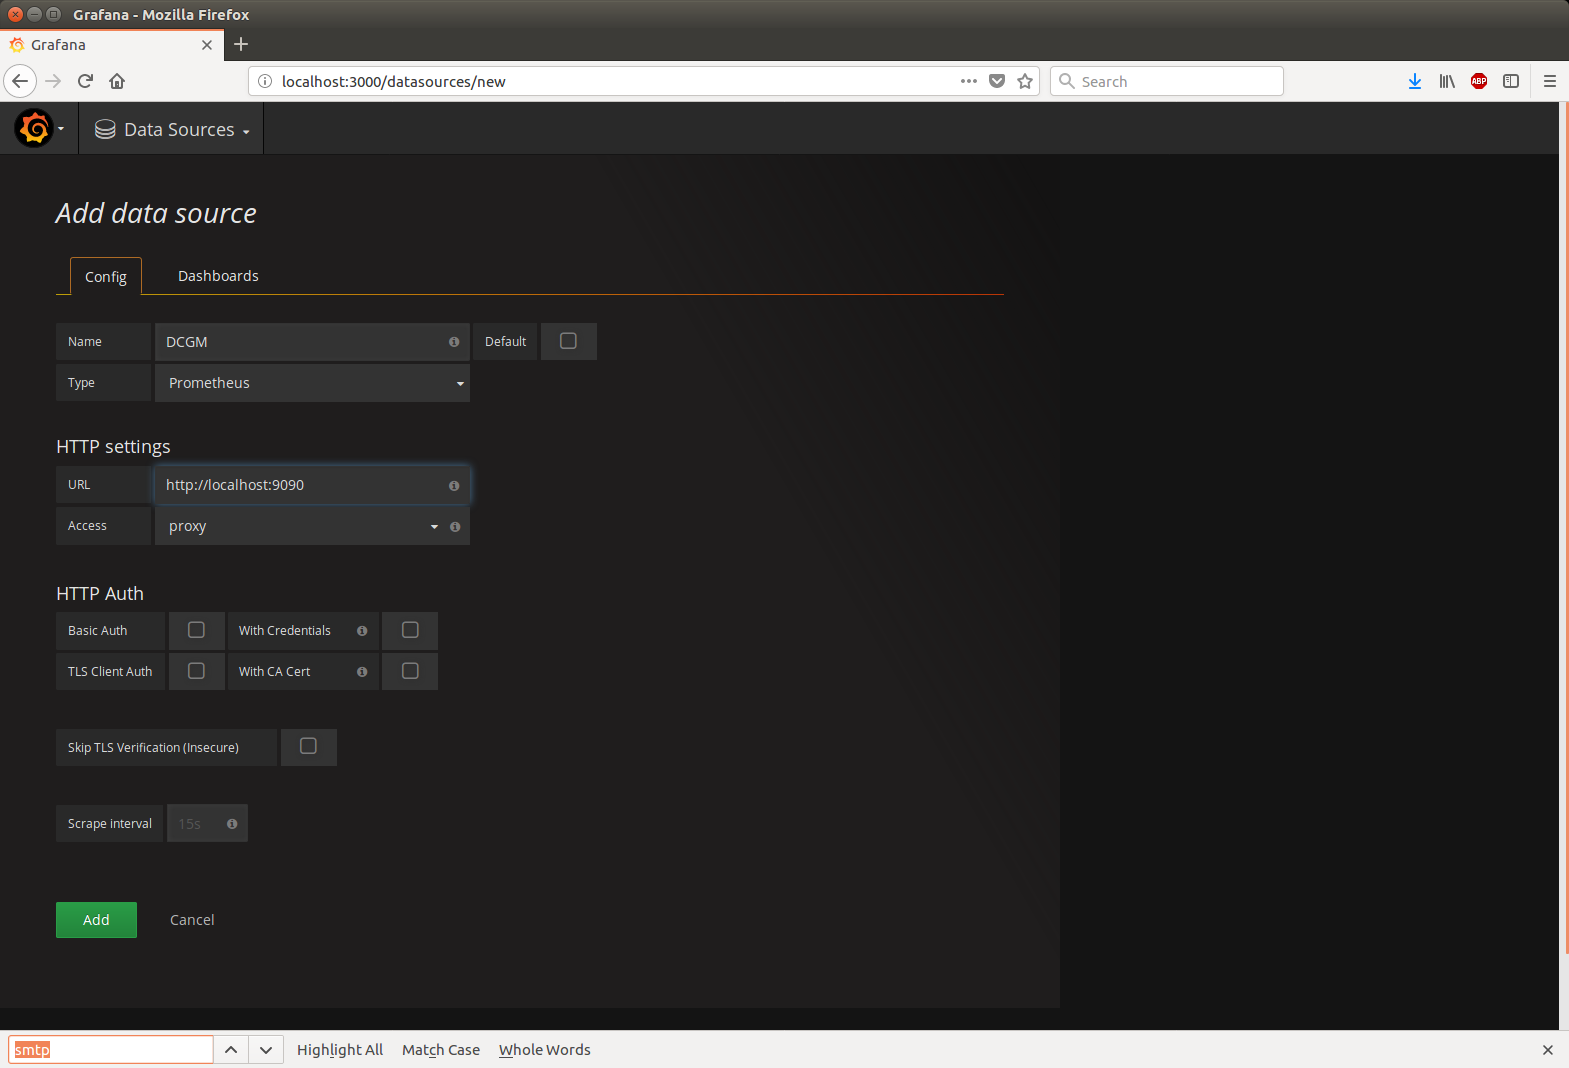
Grafana offers additional features such as configurable dashboards and integration with Grafana is straightforward. Install and launch Grafana, and then open a browser to http://localhost:3000. The default login / password is admin / admin. After logging in, clock on the Grafana icon and select the 'Data Sources' option. Configure the Prometheus server as a data source:
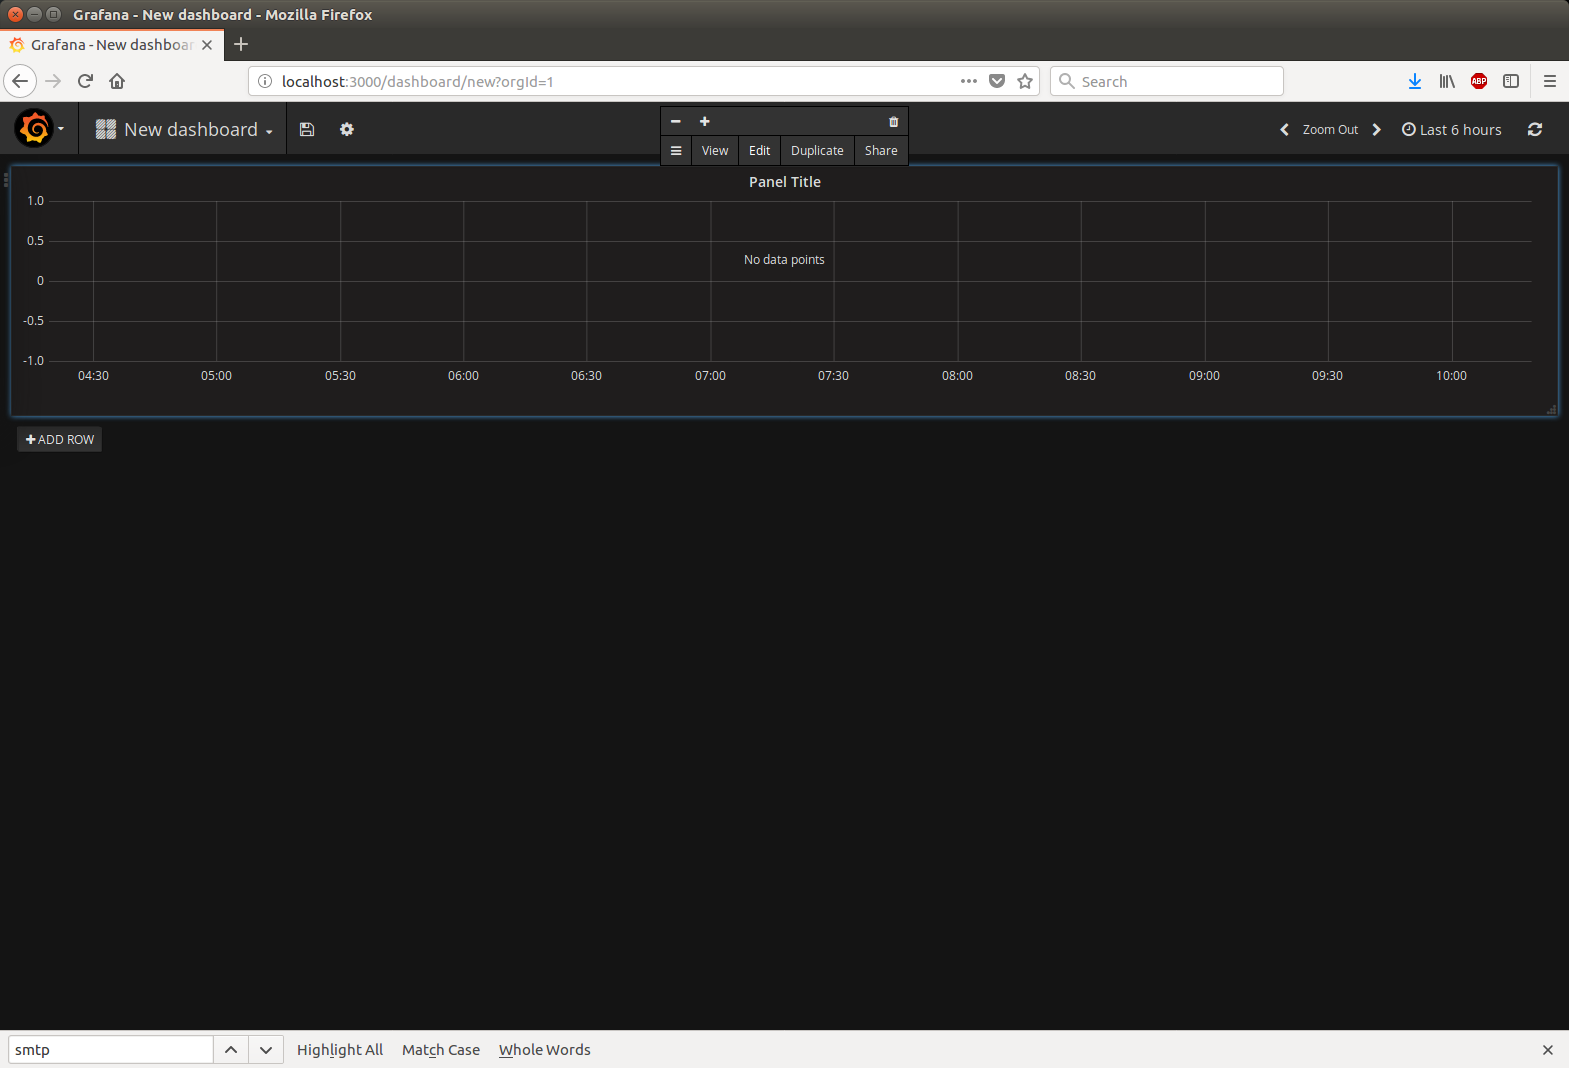
Click ‘Add’ and then create a dashboard using the data that is scraped from the DCGM Prometheus client. Click the Grafana icon again and then Dashboards -> New. There are a lot of ways to customize dashboards; to create a dashboard with graphs, click the 'Graph' option at the top. Select 'Panel Title' and then 'Edit':
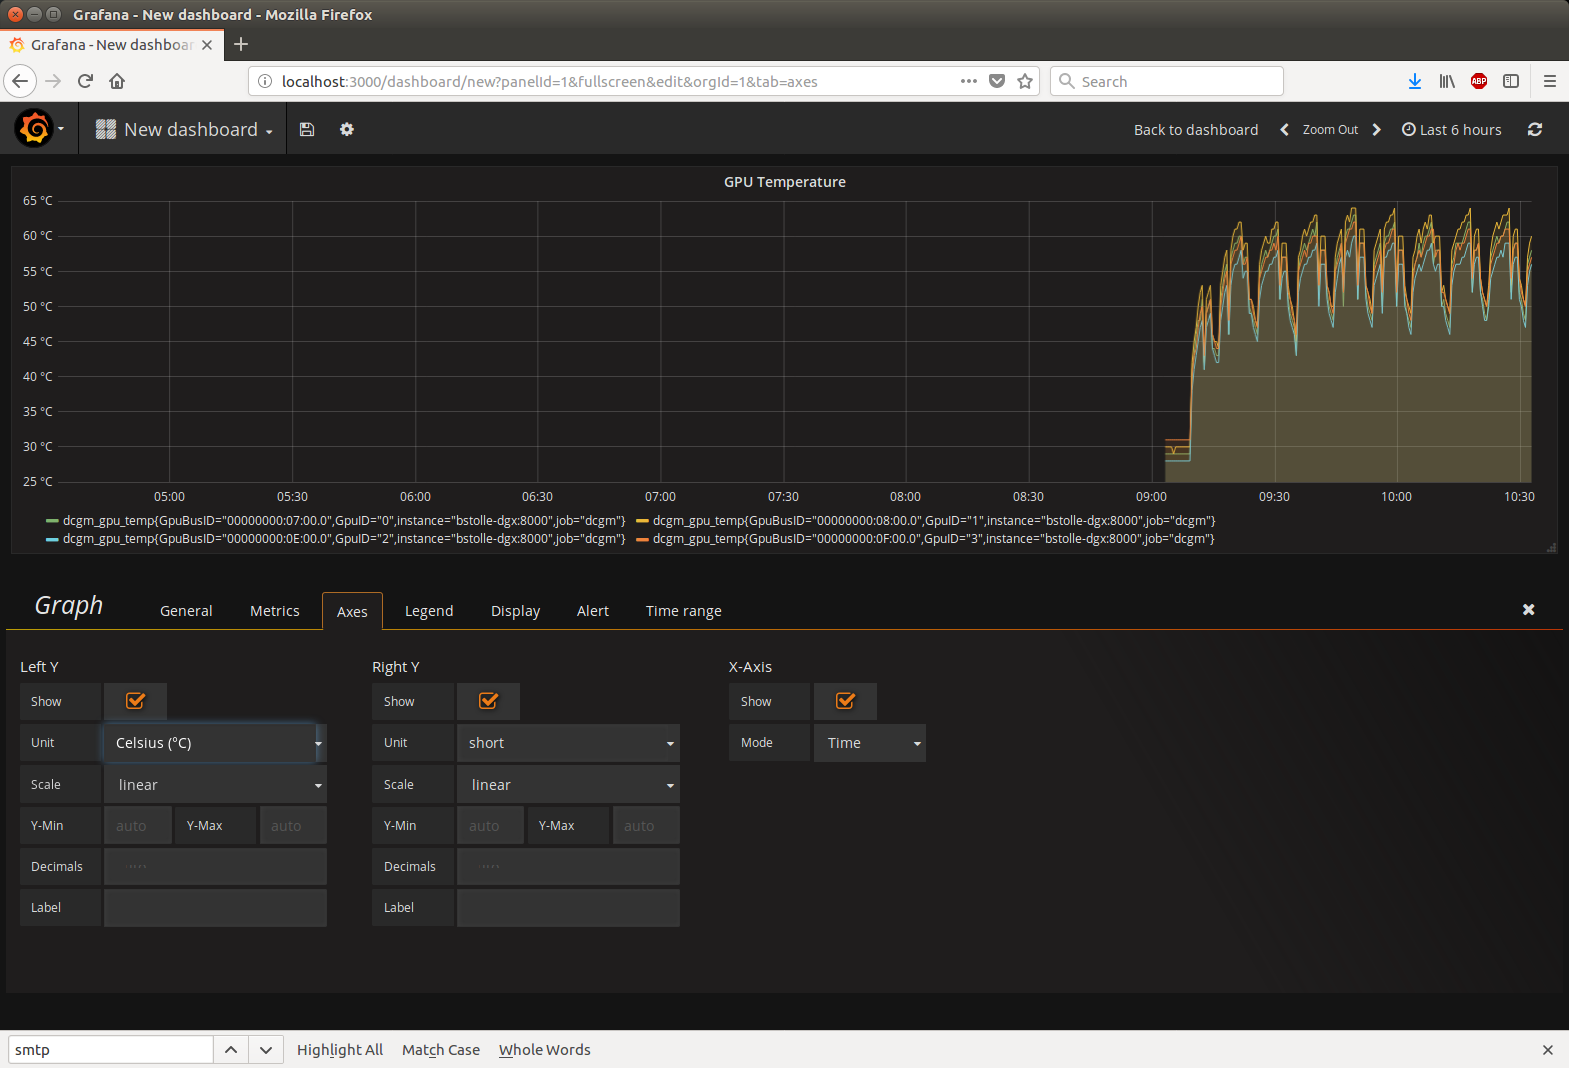
Type dcgm into the metric name box as shown below, and Grafana will offer you auto-completion options for the DCGM fields you have configured. If this doesn't happen, then the data source wasn't configured correctly, or Prometheus has stopped running.
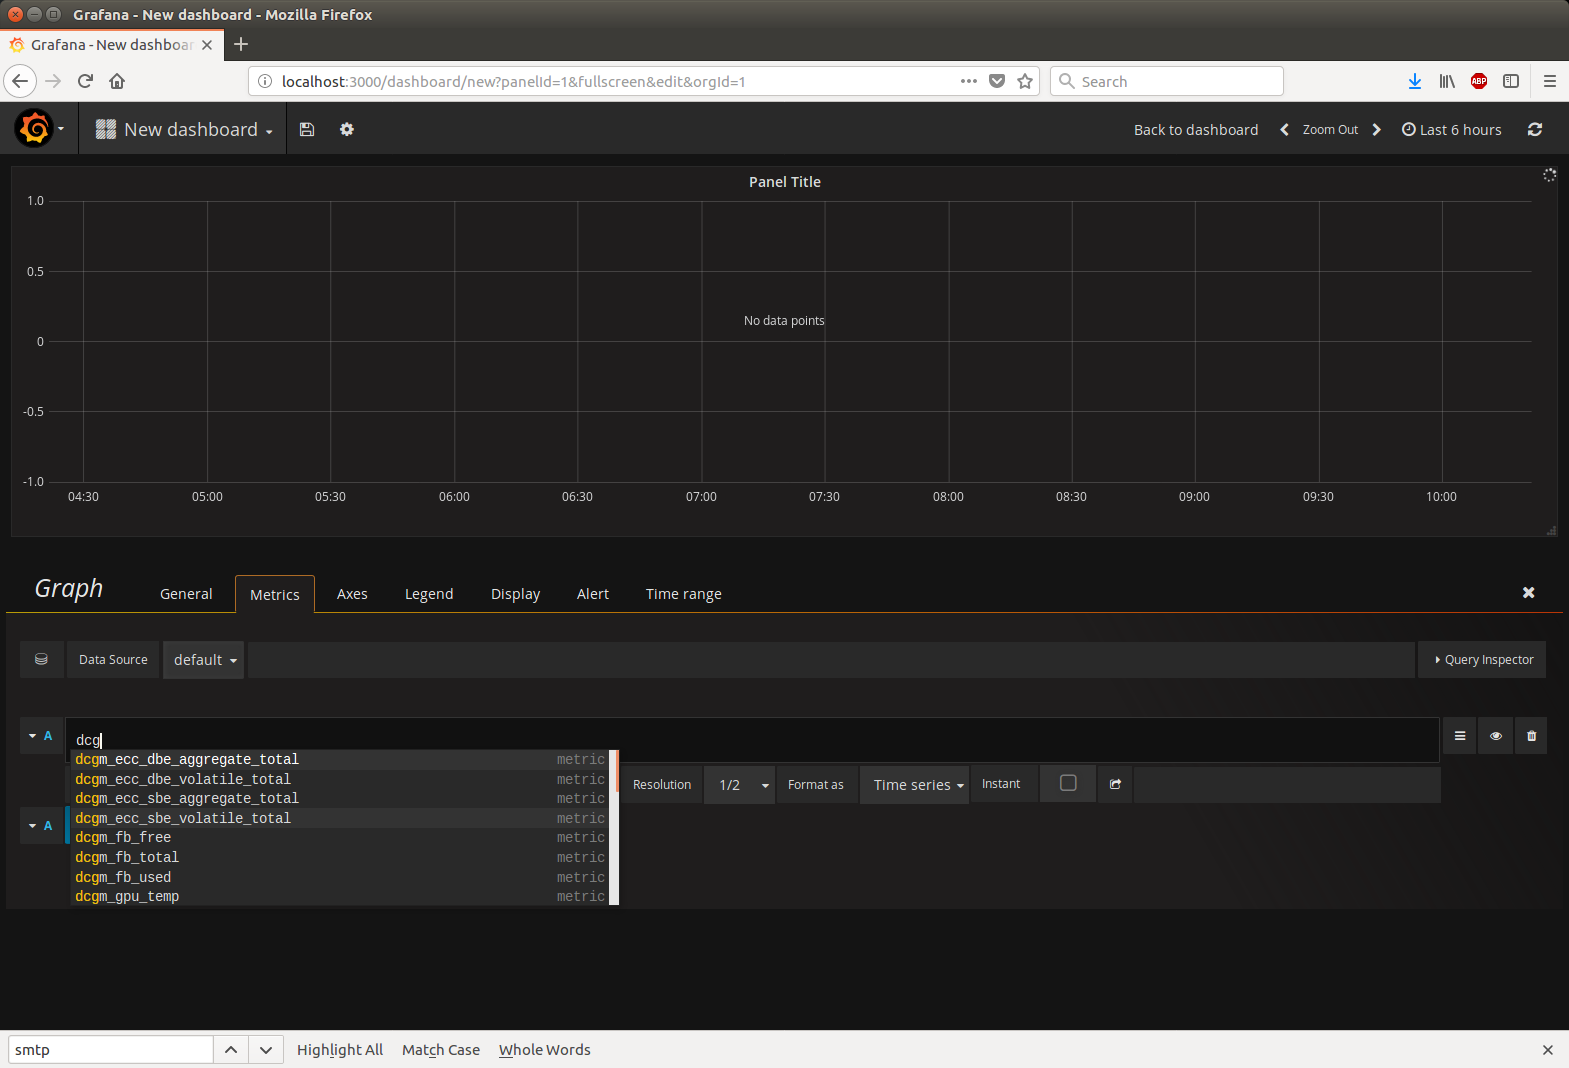
Use the different tabs to customize the graph as desired. This graph has the metric dcgm_gpu_temp selected, and the title changed via the 'General', plus the units set to Celsius via the Axes tab.
Customizing the Prometheus Client
- -n, --hostname: specifies the hostname of the DCGM instance we're querying for data. Default: localhost. Mutually exclusive with -e.
- -e, --embedded: start an embedded hostengine from this script instead of connecting to a standalone hostengine. Mutually exclusive with -n.
- -p, --publish-port: specifies the port where data is published. Default: 8000. Please note that if you change this you'll need to change the Prometheus configuration accordingly.
- -i, --interval: specifies the interval at which DCGM is queried and data is published in seconds. Default: 10.
- -l, --ignore-list: specifies fields queried but not published. Default: DCGM_FI_DEV_PCI_BUSID (57).
- --log-file: Specifies the path to a log file. If this is used without –log-level, then only critical information is logged.
- --log-level: One of CRITICAL (0), ERROR (1), WARNING (2), INFO (3), or DEBUG (4) to specify what kind of information should be logged. If this is used without –log-file, then the information is logged to stdout.
- -f, --field-ids: specifies the list of fields queried and published from DCGM.
Default:
DCGM_FI_DEV_PCI_BUSID (57)
DCGM_FI_DEV_POWER_USAGE (155)
DCGM_FI_DEV_GPU_TEMP (150)
DCGM_FI_DEV_SM_CLOCK (100)
DCGM_FI_DEV_GPU_UTIL (203)
DCGM_FI_DEV_RETIRED_PENDING (392)
DCGM_FI_DEV_RETIRED_SBE (390)
DCGM_FI_DEV_RETIRED_DBE (391)
DCGM_FI_DEV_ECC_SBE_AGG_TOTAL (312)
DCGM_FI_DEV_ECC_DBE_AGG_TOTAL (313)
DCGM_FI_DEV_FB_TOTAL (250)
DCGM_FI_DEV_FB_FREE (251)
DCGM_FI_DEV_FB_USED (252)
DCGM_FI_DEV_PCIE_REPLAY_COUNTER (202)
DCGM_FI_DEV_ECC_SBE_VOL_TOTAL (310)
DCGM_FI_DEV_ECC_DBE_VOL_TOTAL (311)
DCGM_FI_DEV_POWER_VIOLATION (240)
DCGM_FI_DEV_THERMAL_VIOLATION (241)
DCGM_FI_DEV_XID_ERRORS (230)
DCGM_FI_DEV_NVLINK_CRC_FLIT_ERROR_COUNT_TOTAL (409)
DCGM_FI_DEV_NVLINK_CRC_DATA_ERROR_COUNT_TOTAL (419)
DCGM_FI_DEV_NVLINK_REPLAY_ERROR_COUNT_TOTAL (429)
DCGM_FI_DEV_NVLINK_RECOVERY_ERROR_COUNT_TOTAL (439)
#Change the DCGM host to one named sel:
$ python dcgm\_prometheus.py -n sel
# Change the port:
$ python dcgm\_prometheus.py -p 10101
# Change the interval
$ python dcgm\_prometheus.py -i 20
# Change the ignore list and publish list:
$ python dcgm\_prometheus.py -l 523 -f 523,310,311,312