COCO Reader
Reader operator that reads a COCO dataset (or subset of COCO), which consists of an annotation file and the images directory.
DALI_EXTRA_PATH environment variable should point to the place where data from DALI extra repository is downloaded. Please make sure that the proper release tag is checked out.
[1]:
from nvidia.dali.pipeline import Pipeline
import nvidia.dali.ops as ops
import nvidia.dali.types as types
import numpy as np
from time import time
import os.path

test_data_root = os.environ['DALI_EXTRA_PATH']
file_root = os.path.join(test_data_root, 'db', 'coco', 'images')
annotations_file = os.path.join(test_data_root, 'db', 'coco', 'instances.json')

num_gpus = 1
batch_size = 16
[2]:
class COCOPipeline(Pipeline):
    def __init__(self, batch_size, num_threads, device_id):
        super(COCOPipeline, self).__init__(batch_size, num_threads, device_id, seed = 15)
        self.input = ops.COCOReader(file_root = file_root, annotations_file = annotations_file, polygon_masks=True,
                                    shard_id = device_id, num_shards = num_gpus, ratio=True)
        self.decode = ops.ImageDecoder(device = "mixed", output_type = types.RGB)

    def define_graph(self):
        inputs, bboxes, labels, polygons, vertices = self.input()
        images = self.decode(inputs)
        return (images, bboxes, labels, polygons, vertices)
[3]:
start = time()
pipes = [COCOPipeline(batch_size=batch_size, num_threads=2, device_id = device_id)  for device_id in range(num_gpus)]
for pipe in pipes:
    pipe.build()
total_time = time() - start
print("Computation graph built and dataset loaded in %f seconds." % total_time)
Computation graph built and dataset loaded in 0.758729 seconds.
[4]:
pipe_out = [pipe.run() for pipe in pipes]

images_cpu = pipe_out[0][0].as_cpu()
bboxes_cpu = pipe_out[0][1]
labels_cpu = pipe_out[0][2]
polygons_cpu = pipe_out[0][3]
vertices_cpu = pipe_out[0][4]
Bounding boxes returned by the operator are lists of floats containing composed of [x, y, width, height] (ltrb is set to False by default).
[5]:
bboxes = bboxes_cpu.at(4)
labels = labels_cpu.at(4)
for bbox, label in zip(bboxes, labels):
    x, y, width, height = bbox
    print(f"Bounding box (x={x}, y={y}, width={width}, height={height}), label={label}")
Bounding box (x=0.125, y=0.1794569045305252, width=0.3226562440395355, height=0.46871310472488403), label=1
The mask polygons are defined by two outputs: polygons and vertices. Each entry in polygons contains three integers, representing the mask index the polygon belongs to, the start vertex index and one past the last vertex index belonging to the polygon. Each entry in the vertices contains coordinates (x, y) representing a polygon vertex.
[6]:
polygons = polygons_cpu.at(4)
vertices = vertices_cpu.at(4)
print(polygons.shape, vertices.shape)
(1, 3) (26, 2)
[7]:
for polygon in polygons:
    mask_idx, start_vertex, end_vertex = polygon
    nvertices = end_vertex - start_vertex
    print(f"Polygon belonging to mask index {mask_idx} containing {nvertices} vertices:")
    polygon_vertices = vertices[start_vertex:end_vertex]
    for vertex_id in range(nvertices):
        x, y = vertices[vertex_id]
        print(f"Vertex {vertex_id}: x={x}, y={y}")
Polygon belonging to mask index 0 containing 26 vertices:
Vertex 0: x=0.17783120274543762, y=0.23328186571598053
Vertex 1: x=0.1417735069990158, y=0.29483649134635925
Vertex 2: x=0.12574785947799683, y=0.38767293095588684
Vertex 3: x=0.13042201101779938, y=0.48959121108055115
Vertex 4: x=0.15646366775035858, y=0.572336733341217
Vertex 5: x=0.19853098690509796, y=0.6238003969192505
Vertex 6: x=0.23392093181610107, y=0.6490277647972107
Vertex 7: x=0.3073717951774597, y=0.6460005044937134
Vertex 8: x=0.36479702591896057, y=0.6449913382530212
Vertex 9: x=0.41554489731788635, y=0.6016004085540771
Vertex 10: x=0.4435897469520569, y=0.5097730755805969
Vertex 11: x=0.44826388359069824, y=0.4018002450466156
Vertex 12: x=0.43223825097084045, y=0.31199103593826294
Vertex 13: x=0.39684829115867615, y=0.24034550786018372
Vertex 14: x=0.35611647367477417, y=0.20502729713916779
Vertex 15: x=0.3213942348957062, y=0.20200002193450928
Vertex 16: x=0.2986912429332733, y=0.20300911366939545
Vertex 17: x=0.30069443583488464, y=0.18585455417633057
Vertex 18: x=0.2960202991962433, y=0.17980000376701355
Vertex 19: x=0.2873397469520569, y=0.17980000376701355
Vertex 20: x=0.28600427508354187, y=0.1848454624414444
Vertex 21: x=0.2873397469520569, y=0.19695456326007843
Vertex 22: x=0.2893429398536682, y=0.20401820540428162
Vertex 23: x=0.2893429398536682, y=0.20906366407871246
Vertex 24: x=0.22123396396636963, y=0.22621823847293854
Vertex 25: x=0.21589210629463196, y=0.22016368806362152
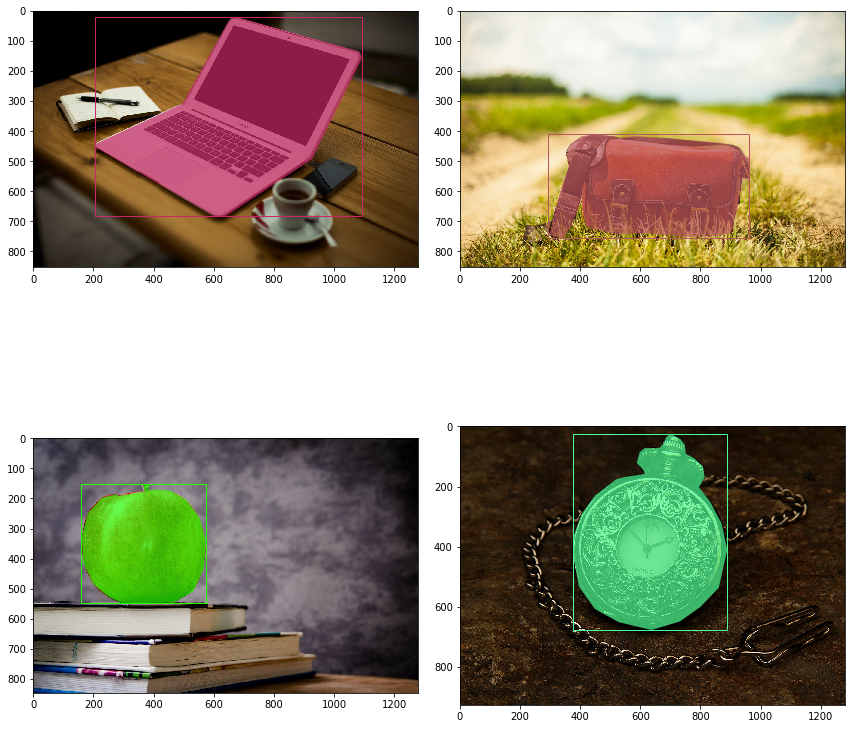
Let’s visualize some examples by drawing the ground truth bounding boxes and mask polygons on the image.
[8]:
import matplotlib.pyplot as plt
import matplotlib.patches as patches
import random

random.seed(1231243)

def plot_sample(img_index, ax):
    img = images_cpu.at(img_index)

    H = img.shape[0]
    W = img.shape[1]

    ax.imshow(img)
    bboxes = bboxes_cpu.at(img_index)
    labels = labels_cpu.at(img_index)
    polygons = polygons_cpu.at(img_index)
    vertices = vertices_cpu.at(img_index)
    categories_set = set()
    for label in labels:
        categories_set.add(label)

    category_id_to_color = dict([(cat_id , [random.uniform(0, 1), random.uniform(0, 1), random.uniform(0, 1)]) for cat_id in categories_set])

    for bbox, label in zip(bboxes, labels):
        rect = patches.Rectangle((bbox[0] * W,bbox[1] * H), bbox[2] * W,bbox[3] * H,
                                 linewidth=1, edgecolor=category_id_to_color[label], facecolor='none')
        ax.add_patch(rect)

    for polygon in polygons:
        mask_idx, start_vertex, end_vertex = polygon
        polygon_vertices = vertices[start_vertex:end_vertex]
        polygon_vertices = polygon_vertices * [W, H]
        poly = patches.Polygon(polygon_vertices, True, facecolor=category_id_to_color[label], alpha=0.7)
        ax.add_patch(poly, )

fig, ax = plt.subplots(2, 2, figsize=(12, 12))
fig.tight_layout()
plot_sample(2, ax[0, 0])
plot_sample(1, ax[0, 1])
plot_sample(4, ax[1, 0])
plot_sample(8, ax[1, 1])
plt.show()
[ ]: