Observability
DGX Cloud Lepton provides a comprehensive observability platform to help you monitor and troubleshoot your applications, including logs and audit logs.
Logs
Learn how to use real-time logs and advanced logs.
What are logs?
Logs are generated by the replica in a job and pod, including all standard output and error output (print or echo).
With real-time logs:
- Logs are real-time and can be viewed as soon as the replica in the deployment, job, and pod are running. Real-time logs will no longer be available once they are deleted or terminated.
- Real-time logs can only be read from the last 10,000 rows.
With advanced logs:
- Support search and filtering.
- View log context.
- Query at the deployment, job, pod and Workspace levels.
- Advanced logs can keep logs generated within 7 days at most.
Real-time Logs
To view real-time logs:
- From the dashboard, navigate to the deployment, job, or pod detail page.
- Select the replicas tab.
- Click the Logs button to view the real-time logs.
You can also click on the Live button on the right top corner to switch to live mode.
Advanced Logs
Advanced logs allow you to access and query logs across multiple replicas and historical data simultaneously. By default, advanced logs feature is disabled in your workspace. You need to enable it manually in the settings page.
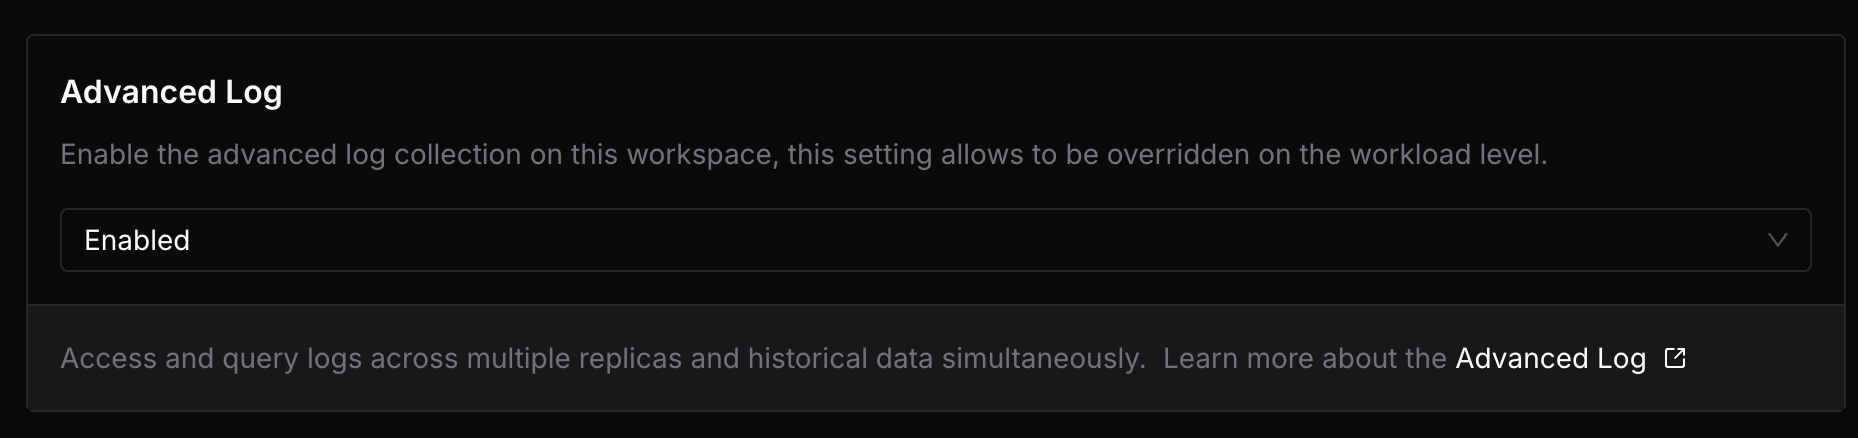
All the workloads created after enabling that feature will start collecting and storing advanced logs automatically.
You can also enable advanced logs for a specific deployment, job, or pod by enabling in the Advanced Configuration section while creating.
To view advanced logs:
- From the dashboard, select the Observability tab and select Logs.
- Or, select the Logs tab from the deployment, job, or pod detail page.
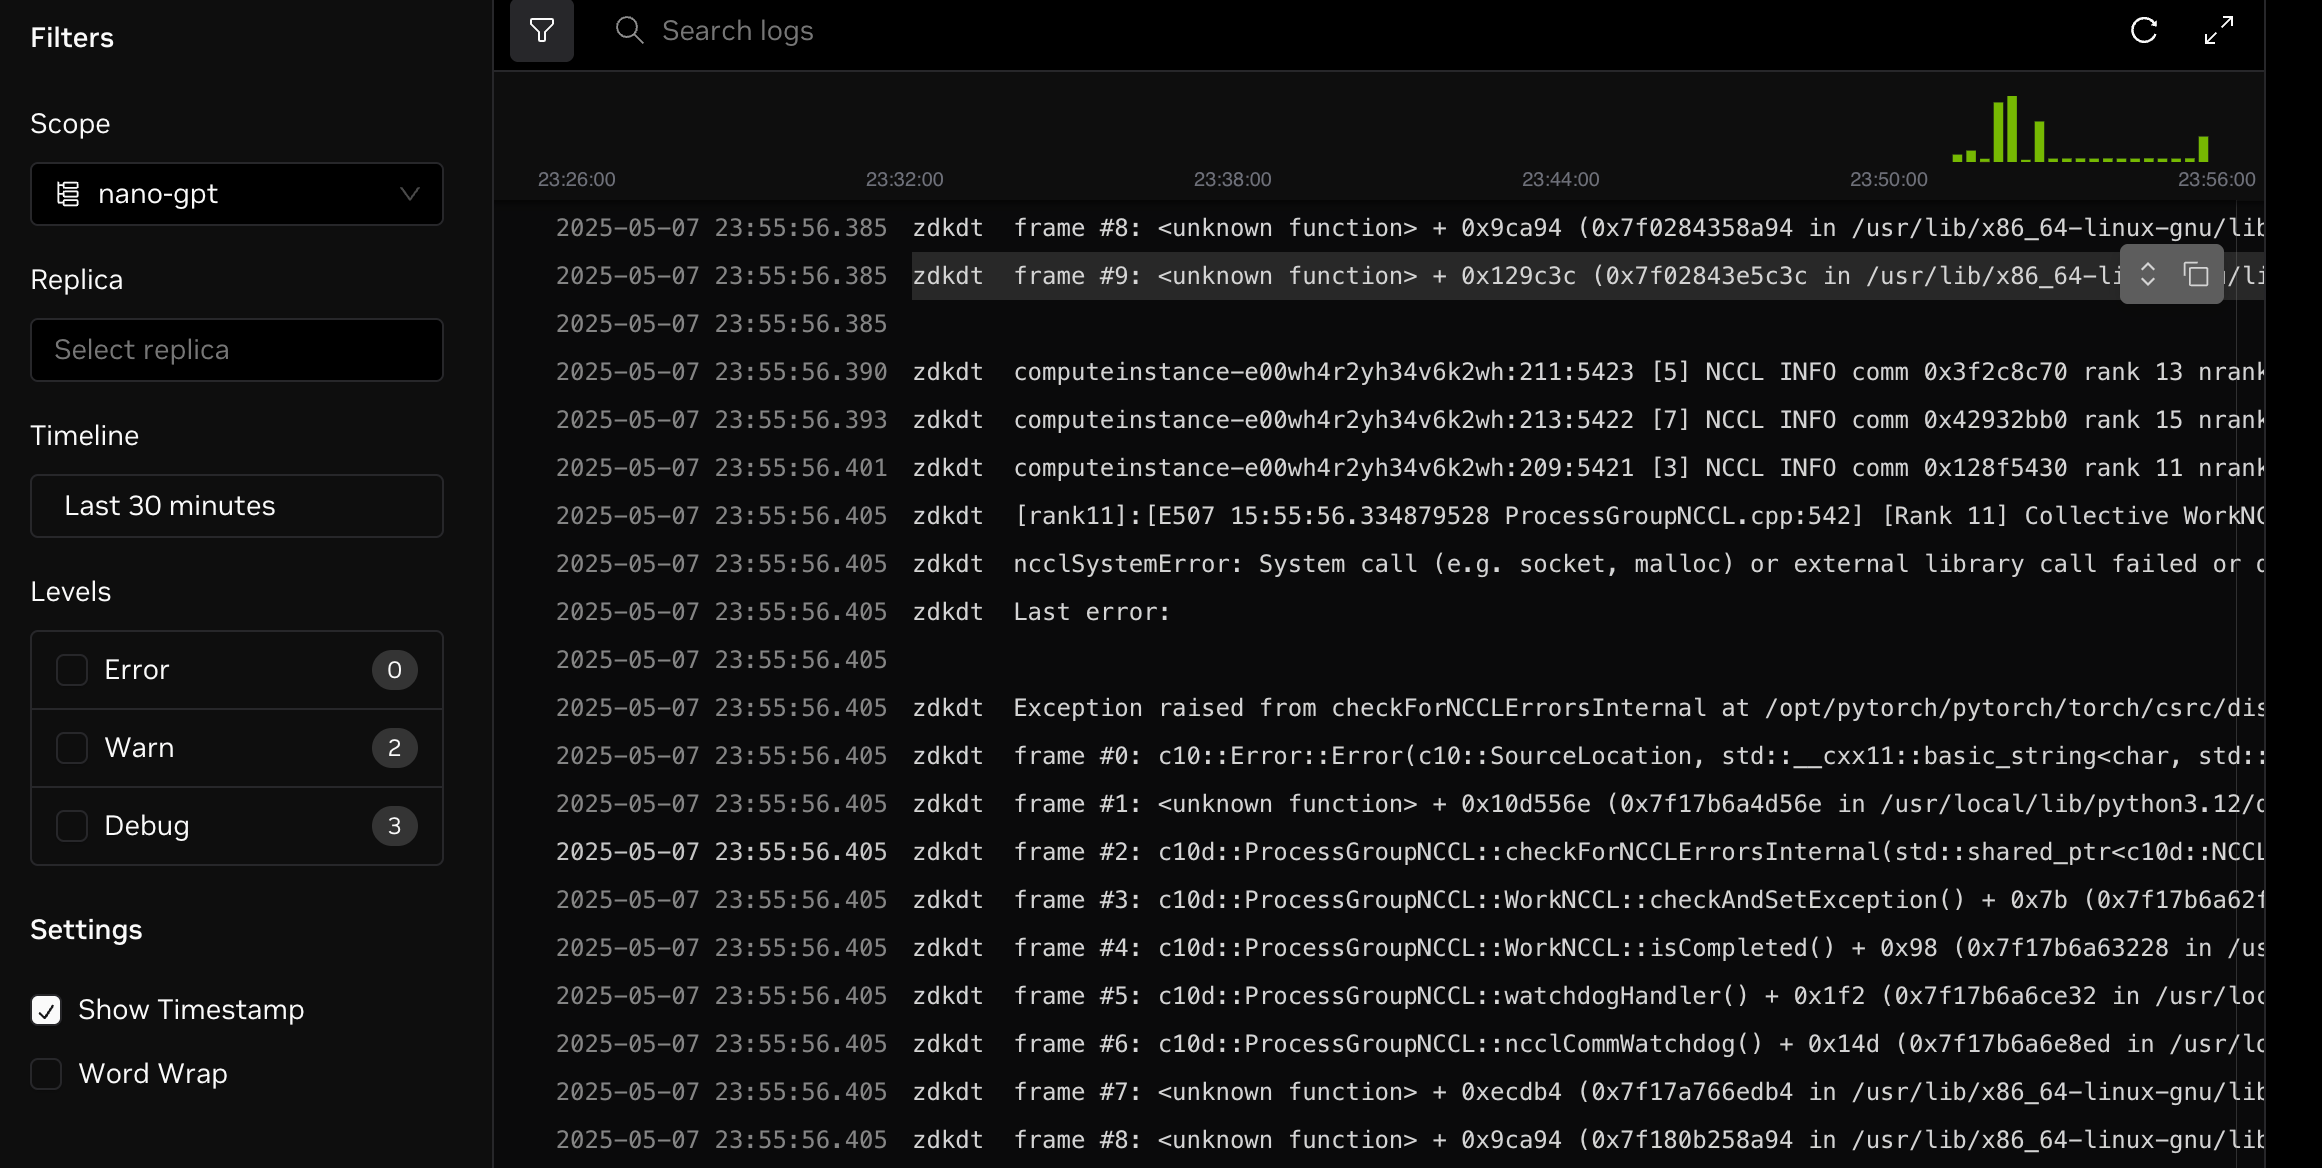
Filters
You can use the following filters from the left sidebar to get a refined search experience.
| Filter | Description |
|---|---|
| Timeline | Query logs by specific time, including the maximum (7 days) or a custom time range, default is most recent 24 hours. |
| Scope | Select or enter a deployment, job, or pod name to query the logs of all replicas within that scope. |
| replica | Select or enter a specific replica name to query the logs of that replica. |
Log Context
It is helpful to see the log context when the filter matches multiple time periods or scopes.
Mouse over the line whose context you want to view, and click the show context button to view the log context. In the log context dialog, the current line will also be highlighted, along with its context
Audit Logs
Learn how to view audit logs in DGX Cloud Lepton.
What are audit logs?
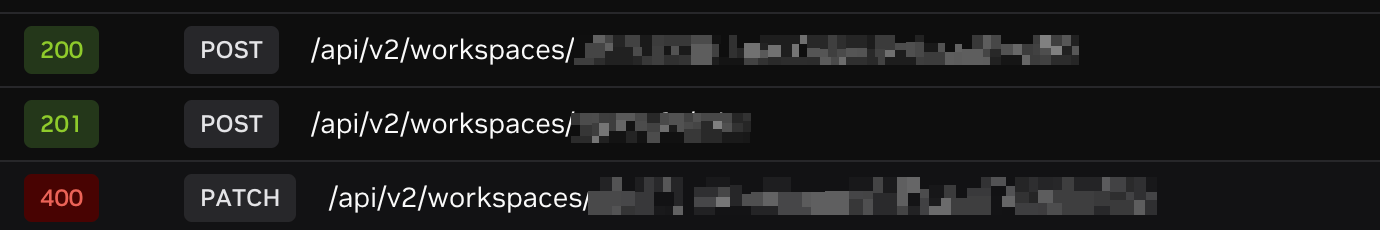
Audit logs record actions and API calls performed by members of your workspace. It helps you to track the changes made by members in your workspace.
View audit logs
From the dashboard, select the Observability tab and select Audit Logs.