Troubleshooting
Due to the complex nature of the underlying mechanisms that make arbitrary application analysis possible, there is the possibility of errors. NVIDIA Nsight Graphics offers a significant number of ways where you can discover opportunities to correct issues that you may encounter.
See the sections below for general tools as well as listings of common problems and possible solutions for them.
General Tools
This section provides troubleshooting tips for NVIDIA Nsight Graphics.
Output Messages
Throughout the operation of the tool, NVIDIA Nsight Graphics provides messages that inform on the status of operations as well as if any issues are encountered. This could provide some assistance when trying to determine why your application may not run, connect, or capture correctly. Error messages are indicated by a red flag in the bottom right of the application window. This flag may be double-clicked to open the Output Messages window. Alternatively this window may be accessed via Tools > Output Messages.
Crash Reporting
When an application crashes, a crash report can be one of the most valuable pieces of information in helping to fix the issue. Accordingly, if you have the ability to send a crash report, it would be greatly appreciated.
Automatic Crash Reports
NVIDIA Nsight Graphics's (target) is NVIDIA Nsight Graphics's (host and target) are configured to automatically send crash reports when they encounter an error. Submitting via the dialog is a good approach, but saving the minidump for explicit communication can be useful too. If you encounter a crash and do not have the option of sending a crash report, please let us know so that we can investigate why the dialog is not being generated.
Manual Crash Reports
Manual crash reports can always be collected by attaching to the crashing process with a debugger and manually creating a dump in the case of a crash. In Visual Studio, this can be accomplished by:
-
Start Visual Studio.
-
Follow the instructions for Debugging Your Application with a Debugger.
-
Start the application with NVIDIA Nsight Graphics.
-
Attach the Visual Studio debugger to it.
-
When you encounter the crash, use the Visual Studio "Debug > Save Dump As" menu option.
Debugging Your Application with a Debugger
Although launching your application with NVIDIA Nsight Graphics might appear to be an alternative to CPU debugging, especially when launched through Visual Studio, the application that is launched is still very much a debuggable application. This can be useful to determine if a problem you are encountering is in your own code by tracing the paths taken by your application.
To do this, set an environment variable of NVIDIA_PROCESS_INJECTION_ATTACH_DIALOG=1 and attach a debugger when you see a message box. Click OK to resume your application once you have set breakpoints that will allow you to inspect if your application is following the expected paths.
If you encounter an NVIDIA Nsight Graphics crash, note that symbols are available for either product via dispsym. If you are able to resolve a call stack, please include that in your report.
Launching the Monitor as an Administrator
The NVIDIA Nsight Graphics Remote Monitor often needs to be launched as an administrator to enable certain functionality. The Remote Monitor is typically installed to the following location:
C:\Program Files\NVIDIA Corporation\Nsight Graphics X.X\host\[platform]\nv-nsight-remote-monitor.exe
(Change X.X for your Nsight Graphics version, and [platform] for the platform of your NVIDIA Nsight Graphics installation.)
To start the Nsight Remote Monitor as an admin, right-click on it and select Run as administrator.
Collecting a Log File to Identify Problems
NVIDIA Nsight Graphics has the capability of collecting detailed information about the run of the application. Logging is opt-in so as to introduce as little-performance impact in production code as possible. Logging is enabled by doing the following:
-
Create a directory C:\Logs. (You can choose a different directory, but it is not recommended, as it would require additional configuration.)
-
Copy nvlog.config to this location.
-
Set the following environment variable:
NVLOG_CONFIG_FILE=C:\Logs\nvlog.config
(See Setting an Environment Variable for guidance.)
-
UWP Application configuration. If you are not using a UWP application, skip this step.
-
To enable UWP applications to log, you will need to set permissions on the Logs folder and the intended target path for output logs (if different than the Logs folder).
-
For the intended folder, right-click Properties.
-
Open the Security tab.
-
If not present, create the ALL APPLICATION PACKAGES group.
-
Add all permissions for this group.
-
-
Re-run your application.
Note:
Note that the logs can get extremely large and so it is not recommended to run the applicable for longer than is necessary. This implies that you may need to force-terminate your application once it has collected the information you want. If the application is creating logs that are too large, please contact devtools-support@nvidia.com for suggestions on how to change the logging configuration to trim it down.
-
Once you have encountered your issue, please copy the logs to an accessible location and send an email to devtools-support@nvidia.com with this report.
For detailed information on the logging system, see this page.
Collecting DirectX Debug Logging
Sometimes a device lost or other issue can be narrowed by observing what the DirectX debug layer has to say.
If you need to install the layer it should be part of the OS in Windows 10:
Apps & Features > Manage Optional Features > Graphics Tools
Open dxcpl, which should look like the below. Make sure your installed application is in the Scope List, and set the Direct3D/DXGI Debug Layer to Force On.
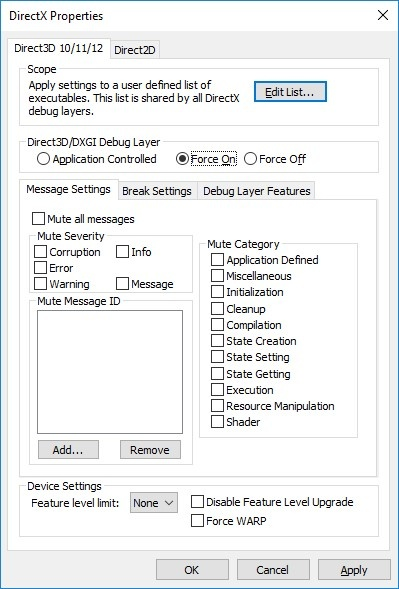
There are two ways to see the spew:
-
You can see logging without attaching Visual Studio by just running DbgView.exe. https://docs.microsoft.com/en-us/sysinternals/downloads/debugview.
-
Alternately, attach using Visual Studio. Logging will be in the Visual Studio Output window. See section below to enable attaching to the launched process.
Setting an Environment Variable
There are occasionally times where you might be asked to set an undocumented variable to help disambiguate problems.
Apply the environment variable in a shell before starting the Nsight Remote Monitor. Note that you may have to quit an existing Nsight monitor before applying the variable. The Nsight Remote Monitor is typically installed to:
C:\Program Files\NVIDIA Corporation\Nsight Graphics X.X\host\[platform]\nv-nsight-remote-monitor.exe
(Change X.X for your Nsight Graphics version, and [platform] for the platform of your NVIDIA Nsight Graphics installation.)
The easiest way to set and make sure that this variable is applied is to use a new command prompt (rather than being unsure if your environment variable will be applied to the environment when working with Windows Explorer).
For example, to set an environment variable for the Nsight Remote Monitor:

Common Problems
Problem: Application Fails to Launch
You've tried to launch your application, but it is failing to launch.
Possible Causes
-
Incorrect command line arguments.
-
Incorrect working directory.
-
You're trying to launch on a remote machine that does not have the Nsight Monitor running.
Possible Solutions
Make sure that your command line arguments and working directory are as expected.
If you are trying to run on a remote machine, please ensure that the remote monitor is running and that the name of the machine is correct. See Remote Launching.
Disambiguate if the application is launching at all. Follow the instructions in Debugging Your Application with a Debugger. Check to see if your application is launched at all and if so, whether it is following its expected path. If the application doesn't launch at all, please send an email to devtools-support@nvidia.com .
Problem: Application Crashes at Runtime
You've found that your application appears to launch, but it crashes during runtime.
Possible Causes
-
Lack of API support by Nsight Graphics
-
Application not checking return codes from device/object creation, assuming it has succeeded
-
Interception-library crash
-
Internal-driver crash
-
D3D-debug runtime interaction
Possible Solutions
Try disabling the following features:
Try running Nsight Performance analysis. Does this work? If so, there may be a debugging-specific feature that is causing problems.
For D3D apps, try running without the D3D debug runtime enabled, as the debug runtime occasionally differs in behavior when compared with the release runtime.
If none of the above works, please try to collect a crash dump if possible and send it to devtools-support@nvidia.com .
Problem: Application Hangs at Runtime
You've found that your application appears to launch, but it hangs during runtime.
Possible Solutions
Try disabling the following features:
If none of the above works, please try to collect a crash dump if possible and send it to devtools-support@nvidia.com .
Problem: Application Crashes during Capture
You've found that you're able to run the application successfully, but upon trying to perform a live analysis, the application crashes.
Possible Causes
-
Multi-threading issue
-
Out of memory
-
The application is tearing itself down due to a watchdog timeout
Possible Solutions
Try disabling the following features:
If you suspect a multi-threading issue (D3D's runtime sometimes indicates this), try disabling multi-threaded capture.
If NVIDIA Nsight Graphics reports out of memory, trying reducing the requirements of the application or try running with a more capable GPU.
If the application exits without any clear sign of a crash, the application could be tearing itself down. Please contact devtools-support@nvidia.com with your concern and we will investigate if there is any opportunity for deactivating the thread.
Problem: Application Captures Successfully, but Exits after a Time in Capture
This problem indicates that you have had some level of success, but even if the application generally inactive, the application crashes.
Possible Solutions
When encountering this issue, take note of what you are doing when you encounter if. The first thing to try is doing nothing – does the application still crash when doing so? If there is nothing going on, this is either a memory leak or a watchdog timer.
-
Look at the memory usage of the process – is it growing? It's a memory leak, either from the application or the tool.
-
Set a stopwatch to count how long it takes to crash – is it a "round" number like 30 or 60 seconds? It's probably a watchdog.
-
If this is a memory leak (uncommon but possible) please contact support to help identify the issue.
If this is a watchdog issue, disable the watchdog in your application.
If you do not have access to the application, and you suspect a watchdog issue, try enabling aggressive thread control to defeat the watchdog timer.
Problem: Application Runs Extremely Slowly
You've observed that the application runs at a significantly lower rate than normal operation.
Possible Solutions
Try disabling optional features, such as collecting shader sourcecollecting native shaders, or collecting hardware performance metrics.
Problem: D3D12 Replayer Shows More CPU Overhead than Expected
Problem: I Can't Capture a Vulkan Application
If you find that the button to Capture for Live Analysis is disabled, or you do not see a message that your application has Nsight Graphics analysis enabled, the Nsight Vulkan layer may not be enabled. This symptom is often accompanied by an error in the Output Messages window, so look for errors in that window for an indication of the failure.
Possible Solutions
One workaround is to re-enable the Nsight Vulkan layer explicitly. To do this, run the following command for your system:
Windows
<install directory>/host/windows-desktop-nomad-x64/VK_LAYER_NV_nomad.bat
Linux
<install directory>/host/linux-desktop-nomad-x64/VK_LAYER_NV_nomad.sh
If, after repeating this installation, you find that your system still cannot capture, gather a log of the output of the vulkaninfo application from the Vulkan SDK and send it to devtools-support@nvidia.com.
Problem: I Can't Attach to the Application
The application launches, but you are unable to attach to it with the NVIDIA Nsight Graphics host.
Possible Causes
-
You launched a piece of the process hierarchy without NVIDIA Nsight Graphics.
-
You set the connection to automatically attach when the root application launches child processes that are the actual processes of interest.
-
The application is interfering with the interception of NVIDIA Nsight Graphics, preventing it from intercepting.
-
The application is using a software renderer.
Possible Solutions
NVIDIA Nsight Graphics is essentially an in-process debugger, so it cannot attach to an application that wasn’t originally launched through NVIDIA Nsight Graphics. The attach feature is meant to be used to attach to applications that have been launched through other means (e.g., a command line launcher), as well as to allow for some recoverability in the case of a host issue, as it allows you attach at a later time.
Make sure to kill any processes related to the process hierarchy of an application and try to launch it again.
Problem: The Host UI Crashes
The host UI crashes while you are analyzing an application.
Possible Solutions
Try reducing the number of views that you have open when running to pinpoint which view causes the issue.
If at all possible, try to collect a crash dump of the UI application and send it to devtools-support@nvidia.com.
Try deleting the UI persistence data with Help > Reset Application Data .
Troubleshooting Options Reference
NVIDIA Nsight Graphics supports several options, especially with regard to troubleshooting, that do not have a public-facing UI to enable them. This section documents each of those options.
Aggressive Thread Control
Some applications use a watchdog timer that kills the application after a certain period of inactivity. Because capturing a frame effectively pauses and application, this will trigger these timeouts. This option attempts to aggressively suspend all application threads during capture to prevent this from happening.
Environment variable:
NSIGHT_AGGRESSIVE_REPLAY_THREAD_CONTROL=Aggressive
There is no UI option for this feature, only an environment variable.
Disable a Watchdog Thread
This option attempts to disable a named thread from raising exceptions that can tear the application down. It does so by attempting to match thread names against a specified regex; if a thread is named (relies on the app doing this) and it throws a fatal exception, this capability will attempt to suppress that exception.
|
Note: |
The UE4 watchdog can be disabled via a command line argument to the engine: -NOINNEREXCEPTION |
Environment variable:
NVIDIA_PROCESS_INJECTION_IGNORE_EXCEPTIONS_FROM_THREAD=anyregex
There is no UI feature for this capability. This is a very sensitive feature; do not publicize it.
Suppress All Fatal Exceptions
This option attempts to disable any exception from being thrown by the application. This is generally only useful if this exception is thrown in a separate thread and the suspension of that thread does not interfere with the application running. Watchdog threads may meet this criteria, for example.
Environment variable:
NVIDIA_PROCESS_INJECTION_SUPPRESS_FATAL_EXCEPTIONS=1
There is no UI feature for this capability. This is a very sensitive feature; do not publicize it.
Ignore Specific Libraries
This option disables the hooking (e.g., detouring) of functions from a specific DLL. This is useful if an application is using multiple APIs that are potentially interfering with each other. The option supports a common delimited list of libraries.
Environment variable:
NVIDIA_PROCESS_INJECTION_IGNORED_LIBRARIES=opengl32.dll,nvoglv32.dll,nvoglv64.dll
There presently is no UI feature for this capability but it may be productized if found useful.