Security Logging
The security logging module is responsible for logging security events. Such events include audit events, and Communications and Security Services related events. This topic focuses on event logging within the Security Services VM (Security Partition).
Modules within the security partition, such as CAN and IP engines, make use of event logging to log records generated in accordance with the specified requirements for:
• Network traffic
• Malicious codes
• Known vulnerabilities detected
• System integrity changes
• Anti-malware events
For example, the IP engine forwards each received packet to be scanned and based on the scan event results and the policy configuration, it may invoke the logging of such events.
The logging of events is subjected to an “intelligent” logging mechanism, whereby, after the first log entry is written to the log file, and if the subsequent entries are the same, i.e., repeated, these are not logged but the last entry is stored and a log count (see log_count field in Log File Format section ) is recorded until a count is reached (which is set to 100 but is configurable). Once the count is reached, the entry is then encrypted and written to the event log file. This mechanism is necessary to avoid loading the security VM in the case of a Denial of Service attempt for example which may trigger repetitive similar log events.
• All logged entries are subject to encryption before being written to files.
• Up to four encrypted event files are generated in the security partition at:
/userdata/nvseclog
event_log0.csv
event_log1.csv
event_log2.csv
event_log3.csv
• Once event_log0.csv reaches a size of 5.24 MB, it is moved to a staging OTA folder (/nvseclog/ota/staging), then moved to /nvseclog/ota/upload to be ready for OTA upload. This is also the case if a timer (configurable and currently set to every 24 hours) kicks in.
• Once event_log0.csv is moved, file event_log1.csv is generated and the above steps apply.
• If moving the files to the /nvseclog/ota/staging folder is not successful for any reason, or in the event the last file, event_log3.csv, reaches the maximum size of 5.24 MB, a roll over occurs and event_log0csv is written into from the beginning.
OTA Log Upload
Uploading the event log to the OTA server is required. This occurs when the event log reaches its maximum size, or at the middle of the day if it does not reach the maximum size.
In order not to overload the OTA upload folder in case of communication breakdown (for example, an IVC transfer issue), the OTA staging folder is set to a limited size (this is configurable and currently set to 5 * maximum file size of 5.24 MB).
If the file is due to be uploaded to the OTA staging folder and the new file size + total OTA size exceeds the maximum allowed folder size, then older files are deleted, and the new file is moved over.
When the log is uploaded, the filename is appended with the time and date, and the log file is saved to the OTA upload directory within the security service.
For example:
/userdata/ota/upload/
is moved to the Communication Service directory at:
/userdata/otavmclient/upload/
For example, a time-stamped event log filename has the format:
event_log0_2019.02.19_14.59.55.csv
Copying Log Files From Security
If any log needs to be uploaded from Security VM on ad-hoc basis, make use of nvseccp (from the Communications VM) or nvsecpush (from the Security VM) applications.
nvseccp: In the Communications VM, issue the following command:
# nvseccp /userdata/nvseclog/event_log0.csv
If successful, the log file is copied to the comms VM under /userdata/transfers/ and the following is printed on the console:
file copy success
nvsecpush: In the security VM, issue the following command:
nvsecpush /userdata/nvseclog/event_log0.csv
If successful, the log file is copied to the Communications VM under /userdata/otavmclient/upload/ and the following is printed on the console:
file copy success
Once the log file is in the Communications VM under /userdata/otavmclient/upload/, scp can be used to copy the file over the host PC:
scp /userdata/otavmclient/upload/event_log0.csv username@HOST_IP:/$PDK_TOP/drive-t186ref-foundation/comms_sec_config/
where HOST_IP is the IP address of the host PC and the PDK_TOP is the PDK/SDK install directory.
For decryption of the event log files, refer to (Logging Encryption and Decryption) section in this document.
Log File Format
1. Log sample from within the security VM modules
local_time = 2020.02.17_18.23.18
category = 1, "SECURITY"
event_type = 8, "SECURITY_DPI"
keyword_severity = 0, "E_INFO"
partition = 0, "SECURITY_PARTITION"
module = 0, "IP_ENGINE"
ifid = 0
code = 0 , ""
scan_type = 1
event_id = 0
pid = 667698
log_count = 1
#### Extra logging data ####
src_ip 192.168.10.1
dst_ip 224.0.0.4
src_port 4865
dst_port 55789
proto 65535
This is an example of a decrypted log entry from the security IP engine caused by an event from the Deep Packet Inspection (DPI).
Please note that not all entities within the security wishing to log report extra logging data, this is specific to DPI service in this case.
2. Log sample from within the security VM modules
local_time = 2020.03.06_12.05.45
category = 2, "COMMUNICATIONS"
event_type = 18, "COMMS_NETWORKING"
keyword_severity = 2, "E_WARNING"
partition = 1, "COMMS_PARTITION"
module = 4, "IVM_LOGGER"
ifid = 65535
code = 65535 , ""
scan_type = 65535
event_id = 65535
pid = 495644
log_count = 199
#### User message is: ####
Testing of the logging API
Log Entry Description
The logged data example provides a log from the Security Service DPI. the log entry is interpreted as follows:
• local_time: the time the log entry was sent
• category = This can be Security, System, Communications, Audit
• event_type: describes the service that sent the log entry. (See enum event_type_enum in Fields definition/declaration section)
• keyword_severity: log severity level (see enum event_keyword_severity in Fields definition/declaration section).
• partition: This is the VM where the log was sent from
• module: Module Name (the module logging)
• ifid: The interface ID. These can be Ethernet, including VLAN, CAN, or AURIX interfaces.
• scan_type: Firewall, Deep Packet Inspection (DPI).
• event_id: The event returned by the scan which is acted on based on the policy. The result of the scan can be 1 or more event results (in the case of the firewall)
• pid: Process ID (The process logging)
• log_count: (Number of times this same log has occurred. This is done to avoid repetitive logging)
The extra logging description:
• src_ip: This is the source IP address
• dst_ip: Destination IP address
• src_port: Source Port
• dst_port: Destination Port
• proto: IP Protocol (TCP, UDP, etc). In the case of the example given, the value given of 65535 (0xFFFF) means it’s not Applicable in the current log entry.
The user message in the case of the Inter VM logging refers to the text string to be logged along with the log entry fields provided in the API. The following is an example.
#### User message is: ####
Testing of the logging API
Note that the fields with a value 65535 (0xFFFF) indicate that they are not applicable within the logging entity.
Fields definition/declaration
enum event_category
{
SYSTEM = 0,
SECURITY,
COMMUNICATIONS,
AUDIT,
};
enum event_keyword_severity
{
E_INFO = 0,
E_NOTICE,
E_WARNING,
E_ERROR,
E_CRITICAL,
E_MAJOR,
AUDIT_SUCCESS,
AUDIT_FAILURE,
};
enum event_type_enum
{
SYSTEM_HOSTSTARTUP = 0,
SYSTEM_HOSTSHUTDOWN,
SYSTEM_HOSTREBOOT,
SYSTEM_SERVICESTARTUP,
SYSTEM_SERVICESHUTDOWN,
SYSTEM_SERVICEFAILURE,
SYSTEM_INFORMATIONAL,
SECURITY_AM,
SECURITY_DPI,
SECURITY_FIREWALL,
SECURITY_BTSECURITY,
SECURITY_FILESCANNING,
SECURITY_SSLPROXY,
SECURITY_CANSECURITY,
SECURITY_SYSTEMINTEGRITY,
SECURITY_GLOBALPROXY,
SECURITY_CRYPTOGRAPHIC,
SECURITY_NAT,
COMMS_NETWORKING,
AUDIT_ACCESSCONTROL,
AUDIT_SYSTEMADMIN,
AUDIT_USERAUTHENTICATION,
AUDIT_IPC,
AUDIT_PROCESSCONTROL,
AUDIT_IOCONTROL,
};
IP Engine
The firewall event ID is as follows:
FwEventFrameOk = 0,
FwEventFrameError = 1,
FwEventFrameIpv6 = 2,
FwEventFrameArp = 3,
FwEventFrameNotRecognized = 4,
FwEventFrameViolation = 5,
FwEventPcktNotRegistered = 6,
FwEventConnNotAvailable = 7,
FwEventIpBlacklisted = 8,
FwEventProtocolNotRecognized = 9,
FwEventPortNotAllowed = 10,
FwEventRepeatedAttempt = 11,
FwEventTcpConnError = 12,
FwEventTcpTimeout = 13,
FwEventFrameBroadcast = 14,
FwEventFrameMulticast = 15,
FwEventDhcp = 16,
FwEventIcmpFragment = 17,
FwEventUdpFragment = 18,
FwEventUdpZeroChecksum = 19,
FwEventDosLevel0 = 20,
FwEventDosLevel1Outbound = 21,
FwEventDosLevel1Inbound = 22,
FwEventDosLevel2Outbound = 23,
FwEventDosLevel2Inbound = 24,
FwEventDosLevel3Outbound = 25,
FwEventDosLevel3Inbound = 26,
The firewall event code is as follows:
FwCodeNone = 0,
FwCodeInfoCheckNotAvailable = 1,
FwCodeErrorChecksum = 2,
FwCodeErrorFrameLength = 3,
FwCodeErrorPacketLength = 4,
FwCodeErrorPayloadLength = 5,
FwCodeViolationLoopback = 6,
FwCodeViolationIpChanged = 7,
FwCodeViolationIcmpSmurf = 8,
FwCodeWarningPcktUntracked = 9,
FwCodeWarningTcpRegFailure = 10,
FwCodeWarningUdpRegFailure = 11,
FwCodeWarningIcmpRegFailure = 12,
FwCodeWarningAddrBlocked = 13,
FwCodeWarningPortClosed = 14,
FwCodeWarningTcpStateInvalid = 15,
FwCodeDosUdpFlood = 16,
FwCodeDosTcpFlood = 17,
FwCodeDosIcmpFlood = 18,
FwCodeDosUdpPortScan = 19,
FwCodeDosTcpPortScan = 20,
CAN and CAN Over Ethernet
The CAN firewall event ID is as follows:
FwEventOkCan = 0,
FwEventIdNotAllowedCan = 1,
FwEventInvalidFrameSizeCan = 2,
The CAN message frequency is as follows:
msgFreqOk = 0,
msgFreqIndef = 1,
msgFreqMalic = 2,
The CAN DPI is as follows:
DpiOkCan = 0,
DpiIndefCan = 1,
DpiMalicCan = 2,
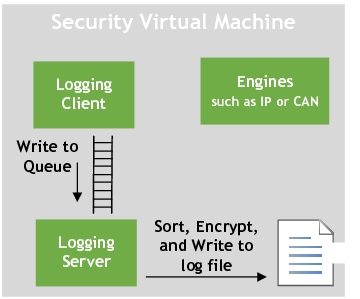
Logging Module
The logging module implements a client server model with the client provided as a library to the modules that wish to log, such as IP or CAN. The implementation is performed by using the logging APIs.
Message queues are used to forward messages, such as log entries, from the client to the server. The logging server process, nvseclog_ser, is launched as part of the security startup script.
The logging server is responsible for:
• Collating log entry messages
• Invoking the encryption library to encrypt the contents before writing to the event logs
Logging API
To achieve logging from GOS, the inter-VM logging infra structure provides the following API:
int32_t security_log(uint32_t etype, uint32_t severity, const char * msg_data, size_t size)
Where (as already described in log file format and Log Entry Description sections):
• etype: defines the type of the event from different event categories.
• severity: defines the severity where the security events are logged by the user.
• msg_data: is the data string to be logged. This is limited to 256 Bytes.
• Size: is the size of the string data to be logged.
Logging Encryption and Decryption
Event log entries are encrypted on-the-fly prior to being written to the event log files. Encryption of the event logs are achieved using the secure engine. The resulting event log files are created in the security partition at:
/userdata/nvseclog/
If debugging is required, to read through, the files must be decrypted.
Since encrypted event logs are decrypted by the central OEM server, the decryption must be achieved on a host system with OpenSSL installed, and NOT on the target hardware system.
To decrypt using OpenSSL
Please note you should have OpenSSL installed in order to be able to decrypt the event log files (libcrypto and libssl are required).
1. On the host system, navigate to the test application at:
<host_ip>:<top>/drive-t186ref-foundation/comms_sec_config
Where:
• <host_ip> is the IP address of the Linux host system.
• <top> is the QNX top directory.
Copy the encrypted event logs from the Communications partition to the nvseclog_ssl_decrypt directory as follows:
• Copy the event log files from /userdata/otavmclient/upload to the host directory at:
<host_ip>:<top>/drive-t186ref-foundation/comms_sec_config
• Execute this command to begin the decryption.
./nvseclog_ssl_decrypt <file(s) to be encrypted>