1. Profiling Linux Targets from the GUI
1.1. Connecting to the Target Device
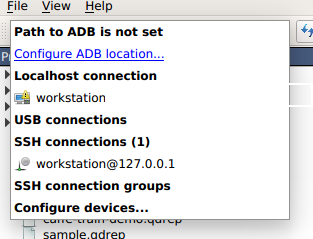
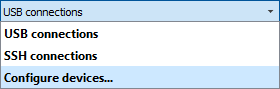
Nsight Systems provides a simple interface to profile on localhost or manage multiple connections to Linux or Windows based devices via SSH. The network connections manager can be launched through the device selection dropdown:
On x86_64:
On Tegra:
The dialog has simple controls that allow adding, removing, and modifying connections:
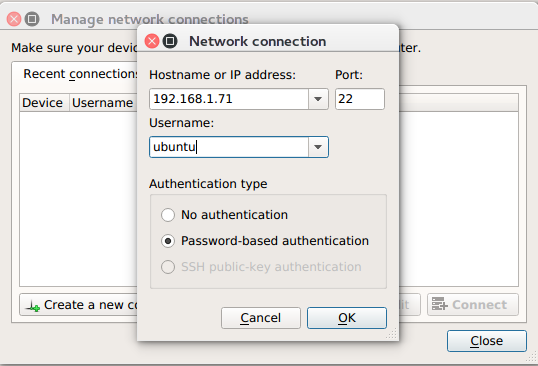
Security notice: SSH is only used to establish the initial connection to a target device, perform checks, and upload necessary files. The actual profiling commands and data are transferred through a raw, unencrypted socket. Nsight Systems should not be used in a network setup where attacker-in-the-middle attack is possible, or where untrusted parties may have network access to the target device.
While connecting to the target device, you will be prompted to input the user's password. Please note that if you choose to remember the password, it will be stored in plain text in the configuration file on the host. Stored passwords are bound to the public key fingerprint of the remote device.
The No authentication option is useful for devices configured for passwordless login using root username. To enable such a configuration, edit the file /etc/ssh/sshd_config on the target and specify the following option:
PermitRootLogin yes
Then set empty password using passwd and restart the SSH service with service ssh restart.
Open ports: The Nsight Systems daemon requires port 22 and port 45555 to be open for listening. You can confirm that these ports are open with the following command:
sudo firewall-cmd --list-ports --permanent
sudo firewall-cmd --reload
To open a port use the following command, skip --permanent option to open only for this session:
sudo firewall-cmd --permanent --add-port 45555/tcp
sudo firewall-cmd --reload
Likewise, if you are running on a cloud system, you must open port 22 and port 45555 for ingress.
Kernel Version Number - To check for the version number of the kernel support of Nsight Systems on a target device, run the following command on the remote device:
cat /proc/quadd/version
Minimal supported version is 1.82.
Additionally, presence of Netcat command (nc) is required on the target device. For example, on Ubuntu this package can be installed using the following command:
sudo apt-get install netcat-openbsd
1.2. System-Wide Profiling Options
1.2.1. Linux x86_64
System-wide profiling is available on x86 for Linux targets only when run with root privileges.
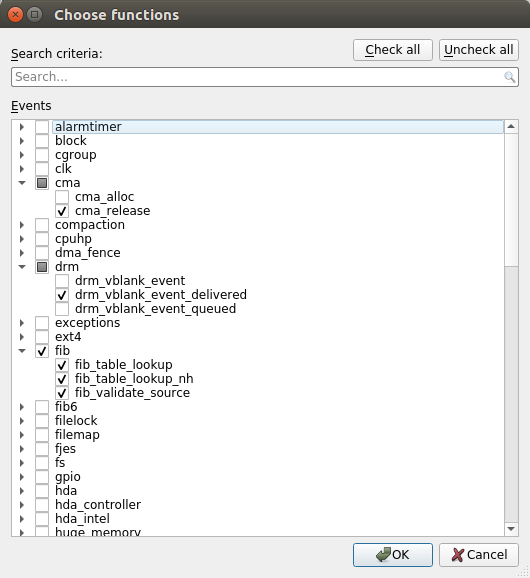
Ftrace Events Collection
Select Ftrace events
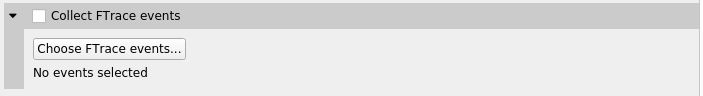
Choose which events you would like to collect.
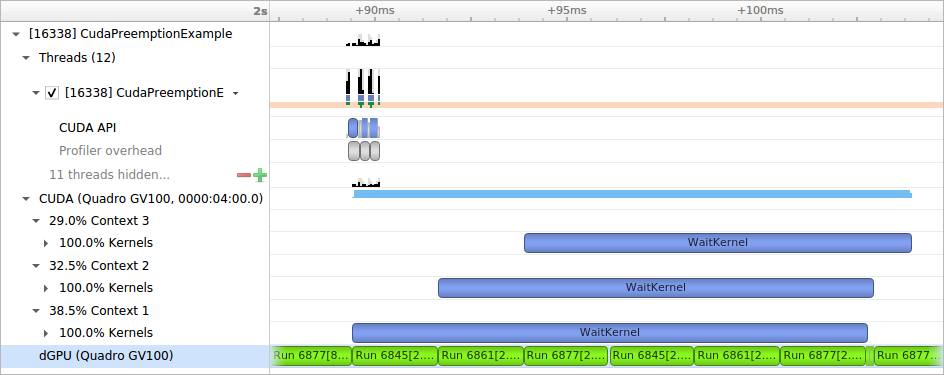
GPU Context Switch Trace
Tracing of context switching on the GPU is enabled with driver r435.17 or higher.
Here is a screenshot showing three CUDA kernels running simultaneously in three different CUDA contexts on a single GPU.
1.2.2. Linux for Tegra
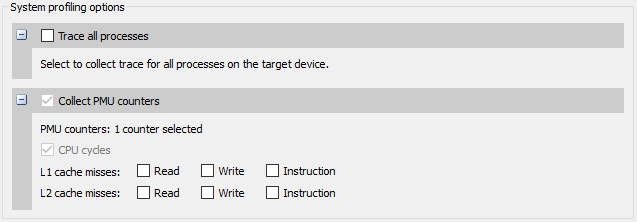
Trace all processes – On compatible devices (with kernel module support version 1.107 or higher), this enables trace of all processes and threads in the system. Scheduler events from all tasks will be recorded.
Collect PMU counters – This allows you to choose which PMU (Performance Monitoring Unit) counters Nsight Systems will sample. Enable specific counters when interested in correlating cache misses to functions in your application.
1.3. Target Sampling Options
Target sampling behavior is somewhat different for Nsight Systems Workstation Edition and Nsight Systems Embedded Platforms Edition.
Target Sampling Options for Workstation
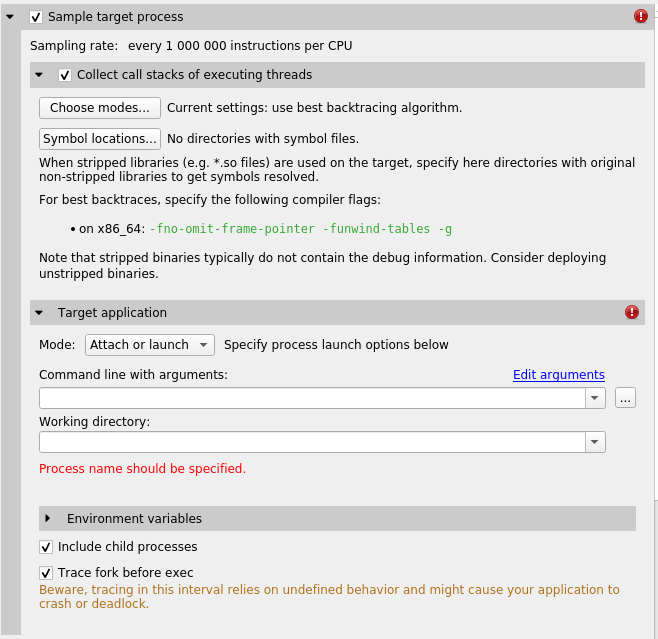
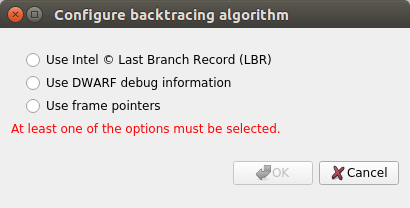
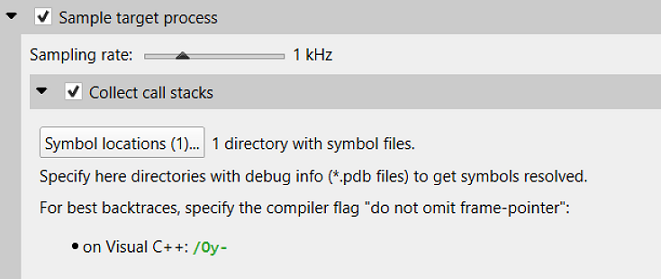
Three different backtrace collections options are available when sampling CPU instruction pointers. Backtraces can be generated using Intel (c) Last Branch Record (LBR) registers. LBR backtraces generate minimal overhead but the backtraces have limited depth. Backtraces can also be generated using DWARF debug data. DWARF backtraces incur more overhead than LBR backtraces but have much better depth. Finally, backtraces can be generated using frame pointers. Frame pointer backtraces incur medium overhead and have good depth but only resolve frames in the portions of the application and its libraries (including 3rd party libraries) that were compiled with frame pointers enabled. Normally, frame pointers are disabled by default during compilation.
By default, Nsight Systems will use Intel(c) LBRs if available and fall back to using dwarf unwind if they are not. Choose modes... will allow you to override the default.
The Include child processes switch controls whether API tracing is only for the launched process, or for all existing and new child processes of the launched process. If you are running your application through a script, for example a bash script, you need to set this checkbox.
The Include child processes switch does not control sampling in this version of Nsight Systems. The full process tree will be sampled regardless of this setting. This will be fixed in a future version of the product.
Nsight Systems can sample one process tree. Sampling here means interrupting each processor after a certain number of events and collecting an instruction pointer (IP)/backtrace sample if the processor is executing the profilee.
When sampling the CPU on a workstation target, Nsight Systems traces thread context switches and infers thread state as either Running or Blocked. Note that Blocked in the timeline indicates the thread may be Blocked (Interruptible) or Blocked (Uninterruptible). Blocked (Uninterruptible) often occurs when a thread has transitioned into the kernel and cannot be interrupted by a signal. Sampling can be enhanced with OS runtime libraries tracing; see OS Runtime Libraries Trace for more information.
Target Sampling Options for Embedded Linux
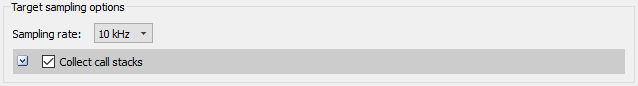
Currently Nsight Systems can only sample one process. Sampling here means that the profilee will be stopped periodically, and backtraces of active threads will be recorded.
Most applications use stripped libraries. In this case, many symbols may stay unresolved. If unstripped libraries exist, paths to them can be specified using the Symbol locations... button. Symbol resolution happens on host, and therefore does not affect performance of profiling on the target.
Additionally, debug versions of ELF files may be picked up from the target system. Refer to Debug Versions of ELF Files for more information.
1.4. Hotkey Trace Start/Stop
Nsight Systems Workstation Edition can use hotkeys to control profiling. Press the hotkey to start and/or stop a trace session from within the target application’s graphic window. This is useful when tracing games and graphic applications that use fullscreen display. In these scenarios switching to Nsight Systems' UI would unnecessarily introduce the window manager's footprint into the trace. To enable the use of Hotkey check the Hotkey checkbox in the project settings page:
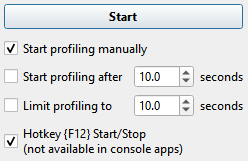
The default hotkey is F12.
1.5. Launching and Attaching to Processes
Nsight Systems Embedded Platforms Edition can work with Linux-based devices in three modes:
-
Attaching to a process by name
-
Attaching to a process by name, or launching a new process
-
Attaching to a process by its PID
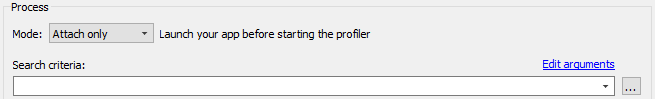
The purpose of the configuration here is to define which process the profiler will attach to for sampling and tracing. Additionally, the profiler can launch a process prior to attaching to it, ensuring that all environment variables are set correctly to successfully collect trace information.
In Attach only mode, the process is selected by its name and command line arguments, as visible using the ps tool.
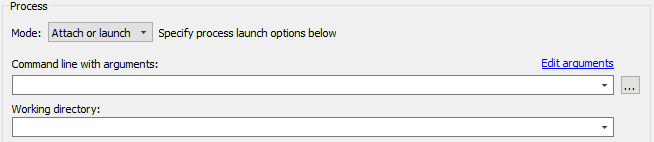
In Attach or launch mode, the process is to first search as if in the Attach only mode, but if it is not found, the process is launched using the same path and command line arguments. If NVTX, CUDA, or other trace settings are selected, the process will be automatically launched with appropriate environment variables.
Note that in some cases, the capabilities of Nsight Systems are not sufficient to correctly launch the application; for example, if certain environment variables have to be corrected. In this case, the application has to be started manually and Nsight Systems should be used in Attach only mode.
The Edit arguments... link will open an editor window, where every command line argument is edited on a separate line. This is convenient when arguments contain spaces or quotes.
To properly populate the Search criteria field based on a currently running process on the target system, use the Select a process button on the right, which has ellipsis as the caption. The list of processes is automatically refreshed upon opening.
Attach by PID mode should be used to connect to a specific process.
To choose one of the currently running processes on the target system, use the Select a process button on the right.
2. Profiling Windows Targets from the GUI
Profiling on Windows devices is similar to the profiling on Linux devices. Please refer to the Profiling Linux Targets from the GUI section for the detailed documentation and connection information. The major differences on the platforms are listed below:
Remoting to a Windows Based Machine
To perform remote profiling to a target Windows based machines, install and configure an OpenSSH Server on the target machine.
Hotkey Trace Start/Stop
Nsight Systems Workstation Edition can use hotkeys to control profiling. Press the hotkey to start and/or stop a trace session from within the target application’s graphic window. This is useful when tracing games and graphic applications that use fullscreen display. In these scenarios switching to Nsight Systems' UI would unnecessarily introduce the window manager's footprint into the trace. To enable the use of Hotkey check the Hotkey checkbox in the project settings page:
The default hotkey is F12.
Changing the Default Hotkey Binding - A different hotkey binding can be configured by setting the HotKeyIntValue configuration field in the config.ini file.
Set the decimal numeric identifier of the hotkey you would like to use for triggering start/stop from the target app graphics window. The default value is 123 which corresponds to 0x7B, or the F12 key.
Virtual key identifiers are detailed in MSDN's Virtual-Key Codes.
Note that you must convert the hexadecimal values detailed in this page to their decimal counterpart before using them in the file. For example, to use the F1 key as a start/stop trace hotkey, use the following settings in the config.ini file:
HotKeyIntValue=112
Target Sampling Options on Windows
Nsight Systems can sample one process tree. Sampling here means interrupting each processor periodically. The sampling rate is defined in the project settings and is either 100Hz, 1KHz (default value), 2Khz, 4KHz, or 8KHz.
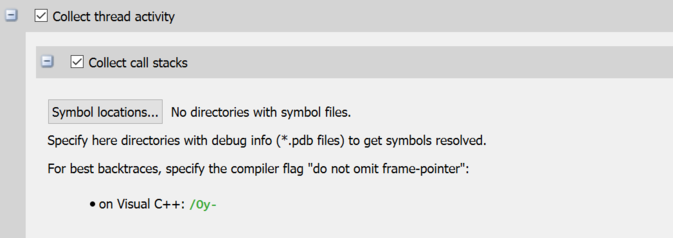
On Windows, Nsight Systems can collect thread activity of one process tree. Collecting thread activity means that each thread context switch event is logged and (optionally) a backtrace is collected at the point that the thread is scheduled back for execution. Thread states are displayed on the timeline.
If it was collected, the thread backtrace is displayed when hovering over a region where the thread execution is blocked.
Symbol Locations
Symbol resolution happens on host, and therefore does not affect performance of profiling on the target.
Press the Symbol locations... button to open the Configure debug symbols location dialog.
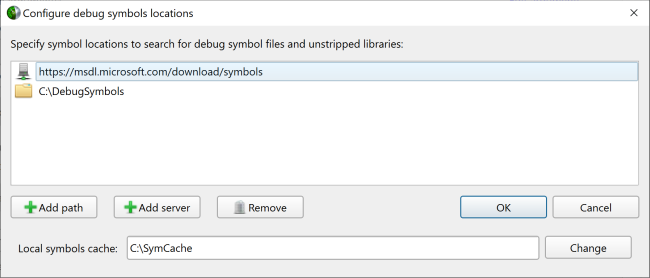
Use this dialog to specify:
-
Paths of PDB files
-
Symbols servers
-
The location of the local symbol cache
To use a symbol server:
-
Install Debugging Tools for Windows, a part of the Windows 10 SDK.
-
Add the symbol server URL using the Add Server button.
Information about Microsoft's public symbol server, which enables getting Windows operating system related debug symbols can be found here.
3. Profiling Android Targets from the GUI
Profiling on Android devices is similar to the profiling on Linux devices. Please refer to the Profiling Linux Targets from the GUI section for the detailed documentation. The major differences on the platforms are listed below:
Configuring Your Android Device
To work with Nsight Systems, the target Android device should be configured for USB debugging in the Developer options settings menu. Please refer to Android development documentation to learn how to configure the device for USB debugging.
On the host, a compatible USB driver should be installed. Please refer to device manufacturer's documentation to learn how to obtain and install the driver.
Connect your target device via a USB cable and power it on (or wake it up). Make sure that you have the adb command available (it is part of Android SDK Platform Tools package). Nsight Systems can only connect to devices that are marked as device in the output of the adb devices command. Make sure you can enter the ADB shell of the target device by running adb shell on the host.
Launch the Nsight Systems application. On the first launch, a new project called Project 1 is created automatically.
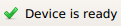
When connecting to the target device, Nsight Systems will validate it and install its daemon into the following location on the device:
/data/local/tmp/com.nvidia.nsightsystems.tools/
Once the daemon and all required files are installed correctly, a green check mark will appear and Device is ready text will be displayed:
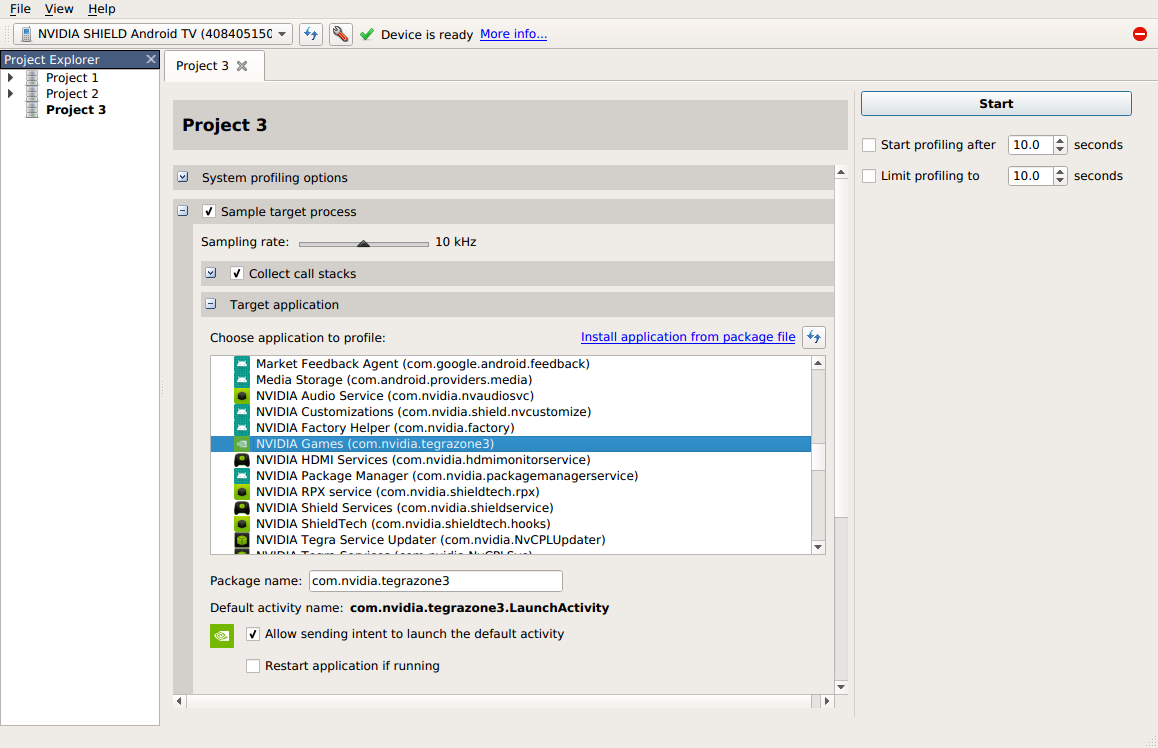
Application
This section allows you to choose which application to profile. All information will be collected about the main process of the selected application, except when the Trace all processes checkbox is enabled.
For non-rooted Android devices, the list of applications only shows information about debuggable applications. By default, applications that are being developed using the Android SDK already contain the debuggable option in their manifests.
On rooted Android devices, profiling of all applications is allowed.
For convenience, the application list also shows the process identifiers (PID) of processes correlated to the listed packages. To refresh this information, use the button in the upper right corner of the list.
The two checkboxes below the application list are important to ensure that the correct launch or attach behavior is configured.
Allow sending intent to launch the default activity, when unselected, forces the profiler to attach to a running process. If no processes are found to correlate to the specified application name, the profiling session fails to start with an error message. When selected, Nsight Systems may launch the default intent of the selected application to make sure it is running and appears on top of the screen on the target device.
In some applications, especially in early stages of development, common bugs related to handling the lifecycle of activities can be found. In such cases, sending the default intent may lead to undesired behavior or even crashes of the profilee. Leaving the checkbox unselected ensures that the profiler does not affect the application.
Restart application if running is a convenient option in two cases:
-
When profiling from the very beginning of the application is desired.
-
When using some of the trace features described below. They require that a special library is injected into the application in runtime, which happens when the application is paused by the Android runtime's virtual machine just after starting. In this case, enabling this option helps ensure that the application is always restarted and the injection always happens, as opposed to potentially attaching to the application's process without injection.
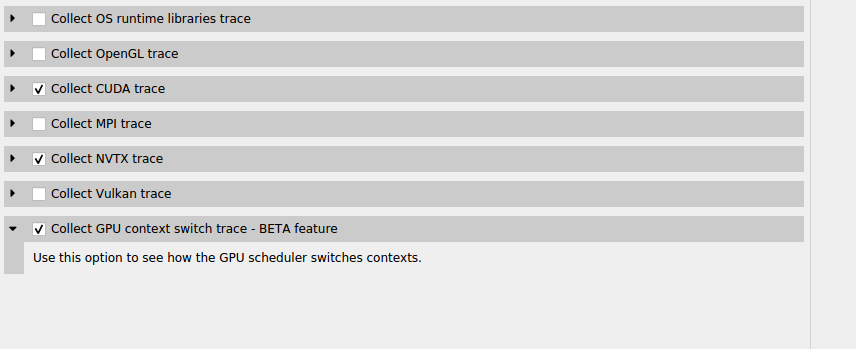
Collect NVTX trace. See NVTX Trace for more information.
Collect OpenGL trace. See OpenGL Trace for more information.
4. Profiling QNX Targets from the GUI
Profiling on QNX devices is similar to the profiling on Linux devices. Please refer to the Profiling Linux Targets from the GUI section for the detailed documentation. The major differences on the platforms are listed below:
-
Backtrace sampling is not supported. Instead backtraces are collected for long OS runtime libraries calls. Please refer to the OS Runtime Libraries Trace section for the detailed documentation.
-
CUDA support is limited to CUDA 9.0+
-
Filesystem on QNX device might be mounted read-only. In that case Nsight Systems is not able to install target-side binaries, required to run the profiling session. Please make sure that target filesystem is writable before connecting to QNX target. For example, make sure the following command works:
echo XX > /xx && ls -l /xx
5. Profiling from the CLI
5.1. Installing the CLI on Your Target
The Nsight Systems CLI provides a simple interface to collect on a target without using the GUI. The collected data can then be copied to any system and analyzed later.
The CLI is distributed in the Target directory of the standard Nsight Systems download package. Users who want to install the CLI as a standalone tool can do so by copying the files within the Target directory. If you want the CLI output file (.qdstrm) to be auto-converted (to .qdrep) after the analysis is complete, you will need to copy the host directory as well.
If you wish to run the CLI without root (recommended mode), you will want to install in a directory where you have full access.
5.2. Command Line Options
The Nsight Systems command lines can have one of two forms:
nsys [global_option]or
nsys [command_switch][optional command_switch_options][application] [optional application_options]All command line options are case sensitive. For command switch options, when short options are used, the parameters should follow the switch after a space; e.g. -s cpu. When long options are used, the switch should be followed by an equal sign and then the parameter(s); e.g. --sample=cpu.
For this version of Nsight Systems, you must launch a process from the command line to begin analysis. If an instance of the requested process is already running when the CLI command is issued, the collection will fail. The launched process will be terminated when collection is complete unless the user specifies the --kill none option (details below).
The Nsight Systems CLI supports concurrent analysis by using sessions. Each Nsight Systems session is defined by a sequence of CLI commands that define one or more collections (e.g. when and what data is collected). A session begins with either a start, launch, or profile command. A session ends with a shutdown command, when a profile command terminates, or, if requested, when all the process tree(s) launched in the session exit. Multiple sessions can run concurrently on the same system.
A couple of notes about the use of paths in your command line.
-
The Nsight Systems command line interface does not handle paths with spaces properly. Please use paths without spaces
-
If you run a command (like python X Y Z) from a directory where the command is not located (like /home/mystuff), and the directory includes a sub-directory with the same name as the command (like /home/mystuff/python), the command line parser will interpret that as "/home/mystuff/python X Y Z". This will not work because python, in this context, would reference the directory, not an executable. Please either run from the command's home directory or use the full path to the command.
5.2.1. CLI Global Options
| Short | Long | Description |
|---|---|---|
| -h | --help | Help message providing information about available command switches and their options. |
| -v | --version | Output Nsight Systems CLI version information. |
5.3. CLI Command Switches
The Nsight Systems command line interface can be used in two modes. You may launch your application and begin analysis with options specified to the nsys profile command. Alternatively, you can control the launch of an application and data collection using interactive CLI commands.
| Command | Description |
|---|---|
| profile | A fully formed profiling description requiring and accepting no further input. The command switch options used (see below table) determine when the collection starts, stops, what collectors are used (e.g. API trace, IP sampling, etc.), what processes are monitored, etc. |
| start | Start a collection in interactive mode. The start command can be executed before or after a launch command. |
| stop | Stop a collection that was started in interactive mode. When executed, all active collections stop, the CLI process terminates but the application continues running. |
| cancel | Cancels an existing collection started in interactive mode. All data already collected in the current collection is discarded. |
| launch | In interactive mode, launches an application in an environment that supports the requested options. The launch command can be executed before or after a start command. |
| shutdown | Disconnects the CLI process from the launched application and forces the CLI process to exit. If a collection is pending or active, it is cancelled |
| export | Generates an export file from an existing .qdrep file. For more information about the exported formats see the /documentation/nsys-exporter directory in your Nsight Systems installation directory. |
| stats | Post process existing Nsight Systems result, either in .qdrep or SQLite format, to generate statistical information. This option is not available in the Windows CLI in this release. |
| status | Reports on the status of a CLI-based collection or the suitability of the profiing environment. |
| sessions | Gives information about all sessions running on the system. |
| nvprof | Special option to help with transition from legacy NVIDIA nvprof tool. Calling nsys nvprof [options] will provide the best available translation of nvprof [options] See Migrating from NVIDIA nvprof topic for details. No additional functionality of nsys will be available when using this option. Note: Not available on IBM Power targets. |
5.3.1. CLI Profile Command Switch Options
After choosing the profile command switch, the following options are available. Usage:
nsys [global-options] profile [options] <application> [application-arguments]| Short | Long | Possible Parameters | Default | Switch Description |
|---|---|---|---|---|
| -t | --trace | cublas, cuda, cudnn, nvtx, opengl, openacc, openmp, osrt, mpi, vulkan, vulkan-annotations, opengl-annotations, dx11-annotations, dx12-annotations, none | cuda, opengl, nvtx, osrt | Select the API(s) to be traced. The osrt switch controls the OS runtime libraries tracing. Multiple APIs can be selected, separated by commas only (no spaces). Since OpenACC, cuDNN and cuBLAS APIs are tightly linked with CUDA, selecting one of those APIs will automatically enable CUDA tracing. See information on --mpi-impl option below if mpi is selected. If the none option is selected, no APIs are traced and no other API can be selected. Note: cublas, cudnn, opengl, and vulkan are not available on IBM Power target. |
| --mpi-impl | openmpi,mpich | openmpi | When using --trace=mpi to trace MPI APIs use --mpi-impl to specify which MPI implementation the application is using. If you are using a different MPI implementation, see Tracing MPI API calls section below. Calling --mpi-impl without --trace=mpi is not supported. | |
| -s | --sample | cpu, none | cpu | Select whether or not to collect CPU samples. If none is selected, sampling is disabled. Note: Thread scheduling information will still be collected unless --cpuctxsw switch is set to none. |
| --cpuctxsw | process-tree, none | process-tree | Trace OS thread scheduling activity. Select 'none' to disable tracing CPU context switches. | |
| --sampling-period | integers between 4000000 and 125000 | 1000000 | The number of CPU Instructions Retired events counted before a CPU instruction pointer (IP) sample is collected. If configured, call stacks may also be collected. The smaller the sampling period, the higher the sampling rate. Note that lower sampling periods will increase overhead and significantly increase the size of the result file(s). | |
| -b | --backtrace | fp,lbr,dwarf,none | lbr | Select the backtrace method to use while sampling. The option lbr uses Intel(c) Corporation's Last Branch Records, available only with Intel(c) CPUs codenamed Haswell and later. The option fp is frame pointer and assumes that frame pointers were enabled during compilation. The option dwarf uses DWARF's CFI (Call Frame Information). |
| --command-file | < filename > | none | Open a file that contains profile switches and parse the switches. Note additional switches on the command line will override switches in the file. This flag can be specified more than once. | |
| -y | --delay | < seconds > | 0 | Collection start delay in seconds. |
| -d | --duration | < seconds > | NA | Collection duration in seconds, duration must be greater than zero. Note that the profiler does not detach from the application, it lives until application termination. |
| -e | --env-var | A=B | NA | Set environment variable(s) for the application process to be launched. Environment variables should be defined as A=B. Multiple environment variables can be specified as A=B,C=D. |
| --osrt-threshold | < nanoseconds > | 1000 ns | Set the minimum time that a OS Runtime event must take before it is collected. Setting this value too low can cause high application overhead and seriously increase the size of your results file. Note: Not available for IBM Power targets. | |
| --osrt-backtrace-depth | integrer | 24 | Set the depth for the backtraces collected for OS runtime libraries calls. | |
| --osrt-backtrace-threshold | nanoseconds | 80000 | Set the duration, in nanoseconds, that all OS runtime libraries calls must execute before backtraces are collected. | |
| --cudabacktrace | all, none, kernel, memory, sync, other | none | When tracing CUDA APIs, enable the collection of a backtrace when a CUDA API is invoked. Significant runtime overhead may occur. Values may be combined using ','. Each value except 'none' may be appended with a threshold after ':'. Threshold is duration, in nanoseconds, that CUDA APIs must execute before backtraces are collected, e.g. 'kernel:500'. Default value for each threshold is 1000ns (1us). Note: CPU sampling must be enabled. Note: Not available on IBM Power targets. | |
| --cuda-flush-interval | milliseconds | 0 | Set the interval, in milliseconds, when buffered CUDA data is automatically saved to storage. Immediately before data is saved to storage, a cudaDeviceSynchonize call is inserted into the workflow which will cause application overhead. If data is not periodically saved, nsys will dynamically allocate memory as needed to store data during collection. For collections over 30 seconds an interval of 10 seconds is recommended. | |
| --cuda-memory-usage | true, false | false | Track the GPU memory usage by CUDA kernels. Applicable only when CUDA tracing is enabled. Note: This feature may cause significant runtime overhead. | |
| -o | --output | < filename > | report# | Set report file name. Any %q{ENV_VAR} pattern in the filename will be substituted with the value of the environment variable. Any %h pattern in the filename will be substituted with the hostname of the system. Any %p pattern in the filename will be substituted with the PID of the target process or the PID of the root process if there is a process tree. Any %% pattern in the filename will be substituted with %. Default is report#.{qdstrm,qdrep,sqlite} in the working directory. |
| --export | sqlite, none | none | Create additional output file(s) based on the data collected. Current options are sqlite or none. WARNING: If the collection captures a large amount of data, creating the database file may take several minutes to complete. | |
| --stats | true, false | false | Generate summary statistics after the collection. WARNING: When set to true, an SQLite database will be created after the collection. If the collection captures a large amount of data, creating the database file may take several minutes to complete. | |
| -f | --force-overwrite | true, false | false | If true, overwrite all existing result files with same output filename (.qdstrm,.qdrep, .sqlite) |
| -w | --show-output | true, false | true | If true, send target process’ stdout and stderr streams to the console. |
| -n | --inherit-environment | true, false | true | When true, the current environment variables and the tool’s environment variables will be specified for the launched process. When false, only the tool’s environment variables will be specified for the launched process. |
| -x | --stop-on-exit | true, false | true | If true, stop collecting automatically when the launched process has exited or when the duration expires - whichever occurs first. If false, duration must be set and the collection stops only when the duration expires. Nsight Systems does not officially support runs longer than 5 minutes. |
| --wait | primary,all | all | If primary, the CLI will wait on the application process termination. If all, the CLI will additionally wait on re-parented processes created by the application. | |
| --trace-fork-before-exec | true, false | false | If true, trace any child process after fork and before they call one of the exec functions. Beware, tracing in this interval relies on undefined behavior and might cause your application to crash or deadlock. | |
| -c | --capture-range | none, cudaProfilerApi, nvtx | none | When -c cudaProfilerApi (or nvtx) is used, profiling will start only when cudaProfilerStart API is invoked or the specified NVTX range (specified using -p/--nvtx-capture) is started in the application. |
| --stop-on-range-end | true,false | true | Stop profiling when the capture range ends. Applicable only when used along with --capture-range option. | |
| -p | --nvtx-capture | range@domain,range,range@ | Specify NVTX capture range. See below for details. This option is applicable only when used along with --capture-range=nvtx. | |
| --hotkey-control | true, false | false | If true, hotkey {F12} can be used to to start or stop collection. Note that hotkey won't take effect in console apps. | |
| --ftrace | Collect ftrace events. Argument should list events to collect as: subsystem1/event1,subsystem2/event2. Requires root. No ftrace events are collected by default. Note: Not available on IBM Power targets. | |||
| --ftrace-keep-user-config | Skip initial ftrace setup and collect already configured events. Default resets the ftrace configuration. | |||
| --vsync | true, false | false | Collect vsync events. If collection of vsync events is enabled, display/display_scanline ftrace events will also be captured. | |
| --gpuctxsw | true,false | false | Trace GPU context switches. Note that this requires driver r435.17 or later and root permission. Not available on IBM Power targets. | |
| --kill | none, sigkill, sigterm, signal number | sigterm | Send signal to the target application's process group. | |
| --session-new | [a-Z][0-9,a-Z,spaces] | profile-<id>-<application> | Name the session created by the command. Name must start with an alphabetical character followed by printable or space characters. Any %q{ENV_VAR} pattern will be substituted with the value of the environment variable. Any %h pattern will be substituted with the hostname of the system. Any %% pattern will be substituted with %. |
5.3.2. CLI Start Command Switch Options
After choosing the start command switch, the following options are available. Usage:
nsys [global-options] start [options]| Short | Long | Possible Parameters | Default | Switch Description |
|---|---|---|---|---|
| -c | --capture-range | none, cudaProfilerApi, nvtx | none | If set to cudaProfilerApi, profiling will start on the first call to cudaProfilerStart. Valid only with CUDA tracing enabled. If set to nvtx the profiling will start when the first NVTX capture range is started (see below for NVTX capture range definition). |
| -o | --output | < filename > | report# | Set report file name. Any %q{ENV_VAR} pattern in the filename will be substituted with the value of the environment variable. Any %h pattern in the filename will be substituted with the hostname of the system. Any %p pattern in the filename will be substituted with the PID of the target process or the PID of the root process if there is a process tree. Any %% pattern in the filename will be substituted with %. Default is report#.{qdstrm,qdrep,sqlite} in the working directory. |
| --export | sqlite, none | none | Create additional output file(s) based on the data collected. Current options are sqlite or none. WARNING: If the collection captures a large amount of data, creating the database file may take several minutes to complete. | |
| --stats | true, false | false | Generate summary statistics after the collection. WARNING: When set to true, an SQLite database will be created after the collection. If the collection captures a large amount of data, creating the database file may take several minutes to complete. | |
| -f | --force-overwrite | true, false | false | If true, overwrite all existing result files with same output filename (.qdstrm,.qdrep, .sqlite) |
| -x | --stop-on-exit | true, false | true | If true, stop collecting automatically when all tracked processes have exited or when stop command is issued - whichever occurs first. If false, stop only on stop command. Note: When this is true, stop command is optional. Nsight Systems does not officially support runs longer than 5 minutes. |
| --stop-on-range-end | true, false | true | If true, stop collecting when the specified capture range ends. Valid only when --capture-range is set. | |
| --ftrace | Collect ftrace events. Argument should list events to collect as: subsystem1/event1,subsystem2/event2. Requires root. No ftrace events are collected by default. Note: Not supported on IBM Power targets. | |||
| --ftrace-keep-user-config | Skip initial ftrace setup and collect already configured events. Default resets the ftrace configuration. | |||
| --gpuctxsw | true,false | false | Trace GPU context switches. Note that this requires driver r435.17 or later and root permission. Not supported on IBM Power targets. | |
| --session | session identifier | none | Start the application in the indicated session. The option argument must represent a valid session name or ID as reported by nsys sessions list. Any %q{ENV_VAR} pattern will be substituted with the value of the environment variable. Any %h pattern will be substituted with the hostname of the system. Any %% pattern will be substituted with %. | |
| --session-new | [a-Z][0-9,a-Z,spaces] | [default] | Start the application in a new session. Name must start with an alphabetical character followed by printable or space characters. Any %q{ENV_VAR} pattern will be substituted with the value of the environment variable. Any %h pattern will be substituted with the hostname of the system. Any %% pattern will be substituted with %. | |
| --vsync | true, false | false | Collect vsync events. If collection of vsync events is enabled, display/display_scanline ftrace events will also be captured. |
5.3.3. CLI Stop Command Switch Options
After choosing the stop command switch, the following options are available. Usage:
nsys [global-options] stop [options]| Short | Long | Possible Parameters | Default | Switch Description |
|---|---|---|---|---|
| --session | session identifier | none | Stop the indicated session. The option argument must represent a valid session name or ID as reported by nsyssessions list. Any %q{ENV_VAR} pattern will be substituted with the value of the environment variable. Any %h pattern will be substituted with the hostname of the system. Any %% pattern will be substituted with %. |
5.3.4. CLI Cancel Command Switch Options
After choosing the cancel command switch, the following options are available. Usage:
nsys [global-options] cancel [options]| Short | Long | Possible Parameters | Default | Switch Description |
|---|---|---|---|---|
| --session | session identifier | none | Cancel the indicated session. The option argument must represent a valid session name or ID as reported by nsyssessions list. Any %q{ENV_VAR} pattern will be substituted with the value of the environment variable. Any %h pattern will be substituted with the hostname of the system. Any %% pattern will be substituted with %. |
5.3.5. CLI Launch Command Switch Options
After choosing the launch command switch, the following options are available. Usage:
nsys [global-options] launch [options] <application> [application-arguments]| Short | Long | Possible Parameters | Default | Switch Description |
|---|---|---|---|---|
| -t | --trace | cublas, cuda, cudnn, nvtx, opengl, openacc, openmp, osrt, mpi, vulkan, vulkan-annotations, opengl-annotations, dx11-annotations, dx12-annotations, none | cuda, opengl, nvtx, osrt | Select the API(s) to be traced. The osrt switch controls the OS runtime libraries tracing. Multiple APIs can be selected, separated by commas only (no spaces). Since OpenACC, cuDNN and cuBLAS APIs are tightly linked with CUDA, selecting one of those APIs will automatically enable CUDA tracing. See information on --mpi-impl option below if mpi is selected. If the none option is selected, no APIs are traced and no other API can be selected. Note: cublas, cudnn, opengl, and vulkan are not available on IBM Power target. |
| --mpi-impl | openmpi,mpich | openmpi | When using --trace=mpi to trace MPI APIs use --mpi-impl to specify which MPI implementation the application is using. If you are using a different MPI implementation, see Tracing MPI API calls section below. Calling --mpi-impl without --trace=mpi is not supported. | |
| -s | --sample | cpu, none | cpu | Select whether or not to collect CPU samples. If none is selected, sampling is disabled. Note: Thread scheduling information will still be collected unless --cpuctxsw switch is set to none. |
| --cpuctxsw | process-tree, none | process-tree | Trace OS thread scheduling activity. Select 'none' to disable tracing CPU context switches. | |
| --sampling-period | integers between 4000000 and 125000 | 1000000 | The number of CPU Instructions Retired events counted before a CPU instruction pointer (IP) sample is collected. If configured, call stacks may also be collected. The smaller the sampling period, the higher the sampling rate. Note that lower sampling periods will increase overhead and significantly increase the size of the result file(s). | |
| -b | --backtrace | fp,lbr,dwarf,none | lbr | Select the backtrace method to use while sampling. The option lbr uses Intel(c) Corporation's Last Branch Records, available only with Intel(c) CPUs codenamed Haswell and later. The option fp is frame pointer and assumes that frame pointers were enabled during compilation. The option dwarf uses DWARF's CFI (Call Frame Information). |
| --command-file | < filename > | none | Open a file that contains launch switches and parse the switches. Note additional switches on the command line will override switches in the file. This flag can be specified more than once. | |
| -e | --env-var | A=B | NA | Set environment variable(s) for the application process to be launched. Environment variables should be defined as A=B. Multiple environment variables can be specified as A=B,C=D. |
| --osrt-threshold | < nanoseconds > | 1000 ns | Set the minimum time that a OS Runtime event must take before it is collected. Setting this value too low can cause high application overhead and seriously increase the size of your results file. Note: Not available for IBM Power targets. | |
| --osrt-backtrace-depth | integrer | 24 | Set the depth for the backtraces collected for OS runtime libraries calls. | |
| --osrt-backtrace-threshold | nanoseconds | 80000 | Set the duration, in nanoseconds, that all OS runtime libraries calls must execute before backtraces are collected. | |
| --cudabacktrace | all, none, kernel, memory, sync, other | none | When tracing CUDA APIs, enable the collection of a backtrace when a CUDA API is invoked. Significant runtime overhead may occur. Values may be combined using ','. Each value except 'none' may be appended with a threshold after ':'. Threshold is duration, in nanoseconds, that CUDA APIs must execute before backtraces are collected, e.g. 'kernel:500'. Default value for each threshold is 1000ns (1us). Note: CPU sampling must be enabled. Note: Not available on IBM Power targets. | |
| --cuda-flush-interval | milliseconds | 0 | Set the interval, in milliseconds, when buffered CUDA data is automatically saved to storage. Immediately before data is saved to storage, a cudaDeviceSynchonize call is inserted into the workflow which will cause application overhead. If data is not periodically saved, nsys will dynamically allocate memory as needed to store data during collection. For collections over 30 seconds an interval of 10 seconds is recommended. | |
| --cuda-memory-usage | true, false | false | Track the GPU memory usage by CUDA kernels. Applicable only when CUDA tracing is enabled. Note: This feature may cause significant runtime overhead. | |
| -w | --show-output | true, false | true | If true, send target process’ stdout and stderr streams to the console |
| -n | --inherit-environment | true, false | true | When true, the current environment variables and the tool’s environment variables will be specified for the launched process. When false, only the tool’s environment variables will be specified for the launched process. |
| -p | --nvtx-capture | message@idomain | none | Specify NVTX capture range. See below for details. |
| --trace-fork-before-exec | true, false | false | If true, trace any child process after fork and before they call one of the exec functions. Beware, tracing in this interval relies on undefined behavior and might cause your application to crash or deadlock. | |
| --wait | primary,all | all | If primary, the CLI will wait on the application process termination. If all, the CLI will additionally wait on re-parented processes created by the application. | |
| --session | session identifier | none | Launch the application in the indicated session. The option argument must represent a valid session name or ID as reported by nsys sessions list. Any %q{ENV_VAR} pattern will be substituted with the value of the environment variable. Any %h pattern will be substituted with the hostname of the system. Any %% pattern will be substituted with %. | |
| --session-new | [a-Z][0-9,a-Z,spaces] | [default] | Launch the application in a new session. Name must start with an alphabetical character followed by printable or space characters. Any %q{ENV_VAR} pattern will be substituted with the value of the environment variable. Any %h pattern will be substituted with the hostname of the system. Any %% pattern will be substituted with %. |
5.3.6. CLI Shutdown Command Switch Options
After choosing the shutdown command switch, the following options are available. Usage:
nsys [global-options] shutdown [options]| Short | Long | Possible Parameters | Default | Switch Description |
|---|---|---|---|---|
| --kill | none, sigkill, sigterm, signal number | sigterm | Send signal to the target application's process group. | |
| --session | session identifier | none | Shutdown the indicated session. The option argument must represent a valid session name or ID as reported by nsys sessions list. Any %q{ENV_VAR} pattern will be substituted with the value of the environment variable. Any %h pattern will be substituted with the hostname of the system. Any %% pattern will be substituted with %. |
5.3.7. CLI Export Command Switch Options
After choosing the export command switch, the following options are available. Usage:
nsys [global-options] export [options] [qdrep-file]| Short | Long | Possible Parameters | Default | Switch Description |
|---|---|---|---|---|
| -o | --output | <filename> | <inputfile.ext> | Set the .output filename. The default is the .qdrep filename with the extension for the chosen format. |
| -t | --type | sqlite, hdr, text, json, info | sqlite | Export format type. HDF format is supported only on x86_64 Linux and Windows |
| -f | --force-overwrite | true, false | false | If true, overwrite existing result file |
| -q | --quiet | true, false | false | If true, do not display progress bar |
| --separate-strings | true,false | false | Output stored strings and thread names separately, with one value per line. This affects JSON and text output only. |
5.3.8. CLI Stats Switch Options
The nsys stats command generates a series of summary or trace reports. These reports can be output to the console, or to individual files, or piped to external processes. Reports can be rendered in a variety of different output formats, from human readable columns of text, to formats more appropriate for data exchange, such as CSV. This command is not available in the Windows CLI in this release.
Reports are generated from an SQLite export of a .qdrep file. If a .qdrep file is specified, Nsight Systems will look for an accompanying SQLite file and use it. If no SQLite file exists, one will be exported and created.
Individual reports are generated by calling out to scripts that read data from the SQLite file and return their report data in CSV format. Nsight Systems ingests this data and formats it as requested, then displays the data to the console, writes it to a file, or pipes it to an external process. Adding new reports is as simple as writing a script that can read the SQLite file and generate the required CSV output. See the shipped scripts as an example. Both reports and formatters may take arguments to tweak their processing. For details on shipped scripts and formatters, see Report Scripts topic.
Reports are processed using a three-tuple that consists of 1) the requested report (and any arguments), 2) the presentation format (and any arguments), and 3) the output (filename, console, or external process). The first report specified uses the first format specified, and is presented via the first output specified. The second report uses the second format for the second output, and so forth. If more reports are specified than formats or outputs, the format and/or output list is expanded to match the number of provided reports by repeating the last specified element of the list (or the default, if nothing was specified).
nsys stats is a very powerful command and can handle complex argument structures, please see the topic below on Example Stats Command Sequences.
After choosing the stats command switch, the following options are available. Usage:
nsys [global-options] stats [options] [input-file]
| Short | Long | Possible Parameters | Default | Switch Description |
|---|---|---|---|---|
| --help-reports | <report_name>, ALL, [none] | none | With no argument, give a summary of the available summary and trace reports. If a report name is given, a more detailed explanation of the report is displayed. If ALL is given, a more detailed explanation of all available reports is displayed. | |
| --help-formats | <format_name>, ALL, [none] | none | With no argument, give a summary of the available output formats. If a format name is given, a more detailed explanation of that format is displayed. If ALL is given, a more detailed explanation of all available formats is displayed. | |
| --sqlite | <file.sqlite> | Specify the SQLite export filename. If this file exists, it will be used. If this file doesn't exist (or if --force-export was given) this file will be created from the specified .qdrep file before report processing. This option cannot be used if the specified input file is also an SQLite file. | ||
| -r | --report | See link | Specify the report(s) to generate, including any arguments. This option may be used multiple times. Multiple reports may also be specified using a comma-separated list (<name[:args...][,name[:args...]...]>). If no reports are specified, the following will be used as the default report set: cudaapisum, gpukernsum, gpumemtimesum, gpumemsizesum, osrtsum, nvtxppsum, openmpevtsum. See Report Scripts for details about existing built-in scripts and how to make your own. | |
| -f | --format | column, table, csv, tsv, json, hdoc, htable, . | Specify the output format of the corresponding report(s). The special name "." indicates the default format for the given output. The default format for console is column, while files and process outputs default to csv. This option may be used multiple times. Multiple formats may also be specified using a comma-separated list (<name[:args...][,name[:args...]...]>). See Report Scripts for options available with each format. | |
| -o | --output | -, @<command>, <basename>, . | - | Specify the output mechanism for the corresponding reports(s). There are three output mechanisms: print to console (-), output to command (@<command>), or output to file (<basename>). The option "." can be used to specify using the default basefile, which is the basename of the input file. The filename used will be <basename>_<report&args>.<output_format>. |
| --report-dir | Add a directory to the path used to find report scripts. This is usually only needed if you have one or more directories with personal scripts. This option may be used multiple times. Each use adds a new directory to the end of the path. The last two entries in the path will always be the current working directory, followed by the directory containing the shipped nsys reports. | |||
| --force-export | true, false | false | Force a re-export of the SQLite file from the specified .qdrep file, even if an SQLite file already exists. | |
| --force-overwrite | true, false | false | Overwrite any existing report file(s). | |
| -q | --quiet | Only display errors. |
5.3.9. CLI Status Command Switch Options
After choosing the status command switch, the following options are available. Usage:
nsys [global-options] status [options]| Short | Long | Possible Parameters | Default | Switch Description |
|---|---|---|---|---|
| <none> | Returns current state of the CLI. | |||
| -e | --environment | Returns information about the system regarding suitability of the profiling environment. | ||
| --session | session identifier | none | Print the status of the indicated session. The option argument must represent a valid session name or ID as reported by nsyssessions list. Any %q{ENV_VAR} pattern will be substituted with the value of the environment variable. Any %h pattern will be substituted with the hostname of the system. Any %% pattern will be substituted with %. |
5.3.10. CLI Sessions Command Switch Subcommands
After choosing the sessions command switch, the following subcommands are available. Usage:
nsys [global-options] sessions [subcommand]| Subcommand | Description |
|---|---|
| list | List all active sessions including ID, name, and state information |
5.4. Example Single Command Lines
Version Information
nsys -vEffect: Prints tool version information to the screen.
Default analysis run
nsys profile <application>
    [application-arguments]
Effect: Launch the application using the given arguments. Start collecting immediately and end collection when the application stops. Trace CUDA, OpenGL, NVTX, and OS runtime libraries APIs. Collect CPU sampling information and thread scheduling information. Profile any child processes. Generate the report#.qdstrm file in the default location, incrementing the report number if needed to avoid overwriting any existing output files.
Limited trace only run
nsys profile --trace=cuda,nvtx -d 20
    --sample=none --cpuctxsw=none -o my_test <application>
    [application-arguments]
Effect: Launch the application using the given arguments. Start collecting immediately and end collection after 20 seconds or when the application ends. Trace CUDA and NVTX APIs. Do not collect CPU sampling information or thread scheduling information. Profile any child processes. Generate the output file as my_test.qdstrm in the current working directory.
Delayed start run
nsys profile -e TEST_ONLY=0 -y 20
    <application> [application-arguments]
Effect: Set environment variable TEST_ONLY=0. Launch the application using the given arguments. Start collecting after 20 seconds and end collection at application exit. Trace CUDA, OpenGL, NVTX, and OS runtime libraries APIs. Collect CPU sampling and thread schedule information. Profile any child processes. Generate the report#.qdstrm file in the default location, incrementing if needed to avoid overwriting any existing output files.
Collect ftrace events
nsys profile --ftrace=drm/drm_vblank_event
    -d 20
Effect: Collect ftrace drm_vblank_event events for 20 seconds. Generate the report#.qdstrm file in the current working directory. Note that ftrace event collection requires running as root. To get a list of ftrace events available from the kernel, run the following:
sudo cat /sys/kernel/debug/tracing/available_events
Typical case: profile a Python script that uses CUDA
nsys profile --trace=cuda,cudnn,cublas,osrt,nvtx
    --delay=60 python my_dnn_script.py
Effect: Launch a Python script and start profiling it 60 seconds after the launch, tracing CUDA, cuDNN, cuBLAS, OS runtime APIs, and NVTX as well as collecting thread schedule information.
Typical case: profile an app that uses Vulkan
nsys profile --trace=vulkan,osrt,nvtx
    --delay=60 ./myapp
Effect: Launch an app and start profiling it 60 seconds after the launch, tracing Vulkan, OS runtime APIs, and NVTX as well as collecting thread schedule information.
5.5. Example Interactive CLI Command Sequences
Collect from beginning of application, end manually
nsys start --stop-on-exit=false
nsys launch --trace=cuda,nvtx --sample=none <application> [application-arguments]
nsys stop
Effect: Create interactive CLI process and set it up to begin collecting as soon as an application is launched. Launch the application, set up to allow tracing of CUDA and NVTX as well as collection of thread schedule information. Stop only when explicitly requested. Generate the report#.qdstrm in the default location. Convert to report#.qdrep if possible.
Note:
If you start a collection and fail to stop the collection (or if you are allowing it to stop on exit, and the application runs for too long) your system’s storage space may be filled with collected data causing significant issues for the system. Nsight Systems will collect a different amount of data/sec depending on options, but in general Nsight Systems does not support runs of more than 5 minutes duration.
Run application, begin collection manually, run until process ends
nsys launch -w true <application> [application-arguments]
nsys start
Effect: Create interactive CLI and launch an application set up for default analysis. Send application output to the terminal. No data is collected until you manually start collection at area of interest. Profile until the application ends. Generate the report#.qdstrm in the default location.
Note:
If you launch an application and that application and any descendants exit before start is called Nsight Systems will create a fully formed .qdstrm file containing no data.
Run application, start/stop collection using cudaProfilerStart/Stop
nsys start -c cudaProfileApi
nsys launch -w true <application> [application-arguments]
Effect: Create interactive CLI process and set it up to begin collecting as soon as a cudaProfileStart() is detected. Launch application for default analysis, sending application output to the terminal. Stop collection at next call to cudaProfilerStop, when the user calls nsys stop, or when the root process terminates. Generate the report#.qdstrm in the default location.
Note:
If you call nsys launch before nsys start -c cudaProfilerApi and the code contains a large number of short duration cudaProfilerStart/Stop pairs, Nsight Systems may be unable to process them correctly, causing a fault. This will be corrected in a future version.
Note:
The Nsight Systems CLI does not support multiple calls to the cudaProfilerStart/Stop API at this time.
Run application, start/stop collection using NVTX
nsys start -c nvtx
nsys launch -w true -p MESSAGE@DOMAIN <application> [application-arguments]
Effect: Create interactive CLI process and set it up to begin collecting as soon as an NVTX range with given message in given domain (capture range) is opened. Launch application for default analysis, sending application output to the terminal. Stop collection when all capture ranges are closed, when the user calls nsys stop, or when the root process terminates. Generate the report#.qdstrm in the default location.
Note:
The Nsight Systems CLI only triggers the profiling session for the first capture range.
NVTX capture range can be specified:
-
Message@Domain: All ranges with given message in given domain are capture ranges. For example:
nsys launch -w true -p profiler@service ./appThis would make the profiling start when the first range with message "profiler" is opened in domain "service".
-
Message@*: All ranges with given message in all domains are capture ranges. For example:
nsys launch -w true -p profiler@* ./appThis would make the profiling start when the first range with message "profiler" is opened in any domain.
-
Message: All ranges with given message in default domain are capture ranges. For example:
nsys launch -w true -p profiler ./appThis would make the profiling start when the first range with message "profiler" is opened in the default domain.
-
By default only messages, provided by NVTX registered strings are considered to avoid additional overhead. To enable non-registered strings check please launch your application with NSYS_NVTX_PROFILER_REGISTER_ONLY=0 environment:
nsys launch -w true -p profiler@service -e NSYS_NVTX_PROFILER_REGISTER_ONLY=0 ./app
Run application, start/stop collection multiple times
The interactive CLI supports multiple sequential collections per launch.
nsys launch <application> [application-arguments]
nsys start
nsys stop
nsys start
nsys stop
nsys shutdown --kill sigkill
Effect: Create interactive CLI and launch an application set up for default analysis. Send application output to the terminal. No data is collected until the start command is executed. Collect data from start until stop requested, generate report#.qdstrm in the current working directory. Collect data from second start until the secont stop request, generate report#.qdstrm (incremented by one) in the current working directory. Shutdown the interactive CLI and send sigkill to the target application's process group.
Note:
Calling nsys cancel after nsys start will cancel the collection without generating a report.
Example Stats Command Sequences
Display default statistics
nsys stats report1.qdrep
Effect: Export an SQLite file named report1.sqlite from report1.qdrep (assuming it does not already exist). Print the default reports in column format to the console.
Note: The following two command sequences should present very similar information:
nsys profile --stats=true <application>
or
nsys profile <application>
nsys stats report1.qdrep
Display specific data from a report
nsys stats --report gputrace report1.qdrep
Effect: Export an SQLite file named report1.sqlite from report1.qdrep (assuming it does not already exist). Print the report generated by the gputrace script to the console in column format.
Generate multiple reports, in multiple formats, output multiple places
nsys stats --report gputrace --report gpukernsum --report cudaapisum --format csv,column --output .,- report1.qdrep
Effect: Export an SQLite file named report1.sqlite from report1.qdrep (assuming it does not already exist). Generate three reports. The first, the gputrace report, will be output to the file report1_gputrace.csv in CSV format. The other two reports, gpukernsum and cudaapisum, will be output to the console as columns of data. Although three reports were given, only two formats and outputs are given. To reconcile this, both the list of formats and outputs is expanded to match the list of reports by repeating the last element.
Submit report data to a command
nsys stats --report cudaapisum --format table \ --output @"grep -E (-|Name|cudaFree)" test.sqlite
Effect: Open test.sqlite and run the cudaapisum script on that file. Generate table data and feed that into the command grep -E (-|Name|cudaFree). The grep command will filter out everything but the header, formatting, and the cudaFree data, and display the results to the console.
Note:
When the output name starts with @, it is defined as a command. The command is run, and the output of the report is piped to the command's stdin (standard-input). The command's stdout and stderr remain attached to the console, so any output will be displayed directly to the console.
Be aware there are some limitations in how the command string is parsed. No shell expansions (including *, ?, [], and ~) are supported. The command cannot be piped to another command, nor redirected to a file using shell syntax. The command and command arguments are split on whitespace, and no quotes (within the command syntax) are supported. For commands that require complex command line syntax, it is suggested that the command be put into a shell script file, and the script designated as the output command
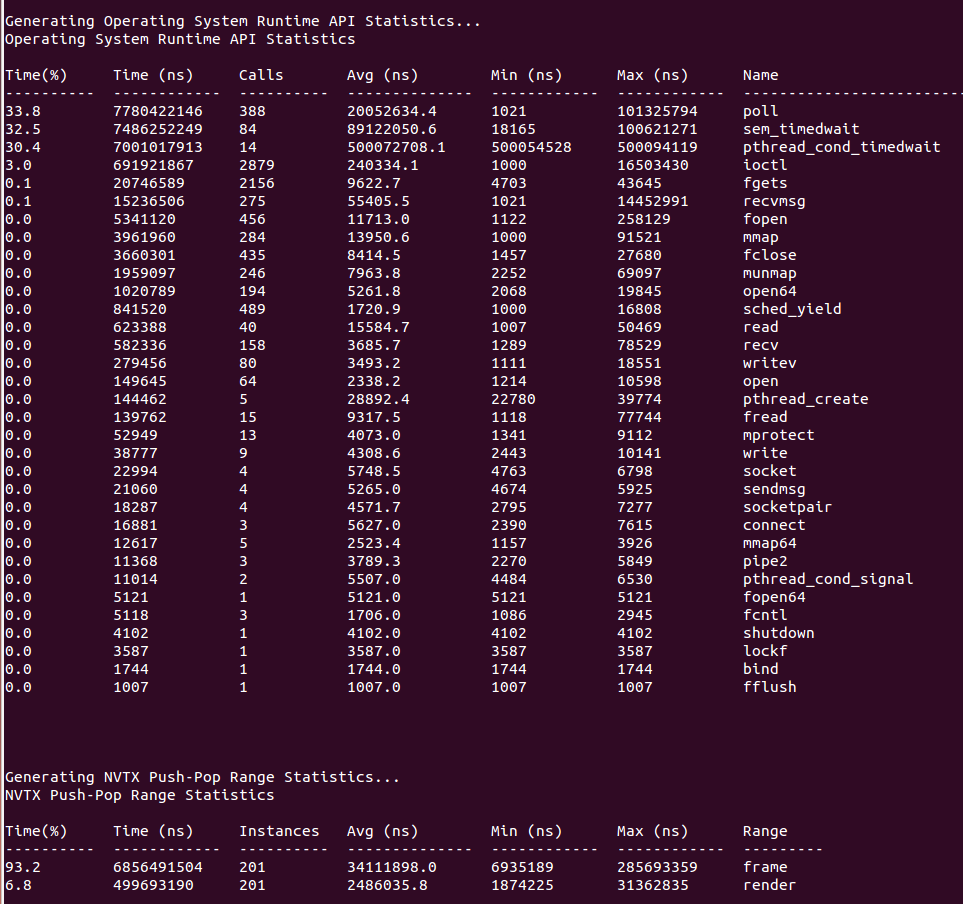
5.7. Example Output from --stats Option
The nsys stats command can be used post analysis to generate specific or personalized reports. For a default fixed set of summary statistics to be automatically generated, you can use the --stats option with the nsys profile or nsys start command to generate a fixed set of useful summary statistics.
If your run traces CUDA, these include CUDA API, Kernel, and Memory Operation statistics:
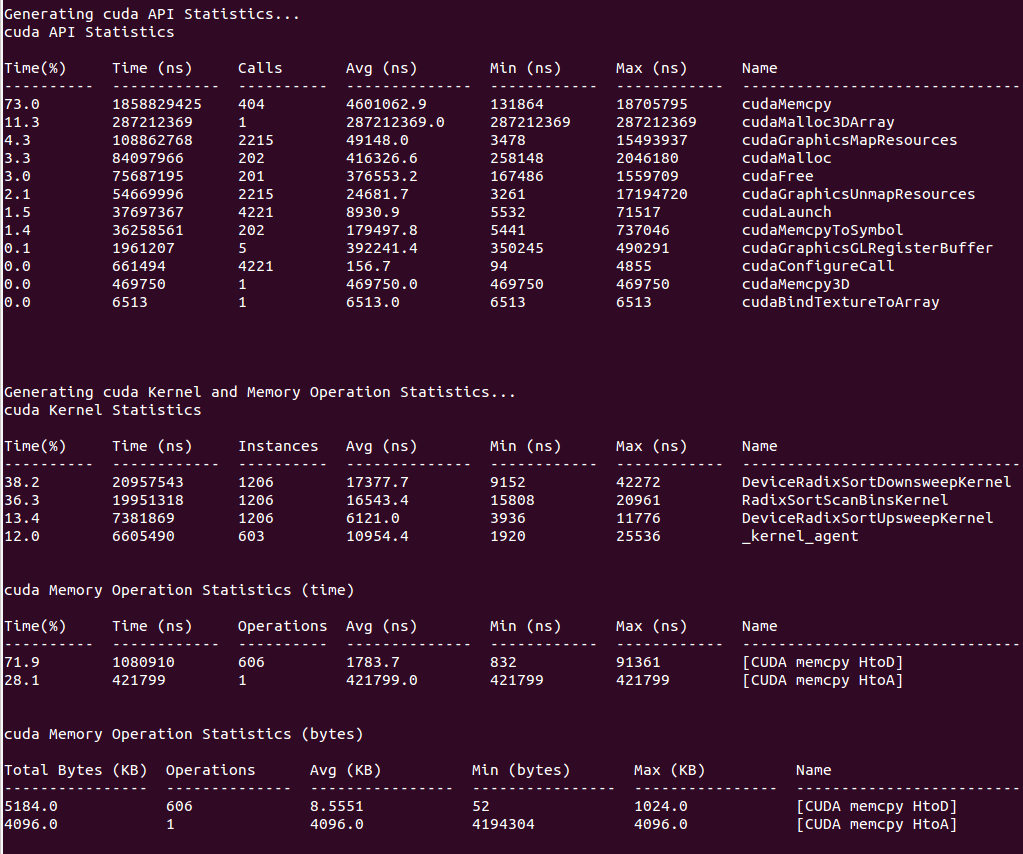
If your run traces OS runtime events or NVTX push-pop ranges:
Recipes for these statistics as well as documentation on how to create your own metrics will be available in a future version of the tool.
5.8. Importing and Viewing Command Line Results Files
The CLI generates a .qdstrm file. The .qdstrm file is an intermediate result file, not intended for multiple imports. It needs to be processed, either by importing it into the GUI or by using the standalone QdstrmImporter to generate an optimized .qdrep file. Use this .qdrep file when re-opening the result on the same machine, opening the result on a different machine, or sharing results with teammates.
This version of Nsight Systems will attempt to automatically convert the .qdstrm file to a .qdrep file with the same name after the run finishes if the required libraries are available. The ability to turn off auto-conversion will be added in a later version.
Import Into the GUI
The CLI and host GUI versions must match to import a .qdstrm file successfully. The host GUI is backward compatible only with .qdrep files.
Copy the .qdstrm file you are interested in viewing to a system where the Nsight Systems host GUI is installed. Launch the Nsight Systems GUI. Select File->Import... and choose the .qdstrm file you wish to open.
The import of really large, multi-gigabyte, .qdstrm files may take up all of the memory on the host computer and lock up the system. This will be fixed in a later version.
Create .qdrep Using QdstrmImporter
The CLI and QdstrmImporter versions must match to convert a .qdstrm file into a .qdrep file. This .qdrep file can then be opened in the same version or more recent versions of the GUI.
To run QdstrmImporter on the host system, find the QdstrmImporter binary in the Host-x86_64 directory in your installation. QdstrmImporter is available for all host platforms. See options below.
To run QdstrmImporter on the target system, copy the Linux Host-x86_64 directory to the target Linux system or install Nsight Systems for Linux host directly on the target. The Windows or MacOS host QdstrmImporter will not work on a Linux Target. See options below.
| Short | Long | Parameter | Description |
|---|---|---|---|
| -h | --help | Help message providing information about available options and their parameters. | |
| -v | --version | Output QdstrmImporter version information | |
| -i | --input-file | filename or path | Import .qdstrm file from this location. |
| -o | --output-file | filename or path | Provide a different file name or path for the resulting .qdrep file. Default is the same name and path as the .qdstrm file |
5.9. Using the CLI to Analyze MPI Codes
5.9.1. Tracing MPI API calls
The Nsight Systems CLI has built-in API trace support via --trace=mpi option only for the OpenMPI and MPICH implementations of MPI. It traces a default list of synchronous MPI APIs. If you require more control over the list of traced APIs or if you are using a different MPI implementation, see github nvtx pmpi wrappers.
You can use this documentation to generate a shared object to wrap a list of synchronous MPI APIs with NVTX using the MPI profiling interface (PMPI). If you set your LD_PRELOAD environment variable to the path of that object, nsys will capture and report the MPI API trace information when --trace=nvtx is used. There is no need to use --trace=MPI.
NVTX tracing is automatically enabled when MPI trace is turned on.
5.9.2. Using the CLI to Profile Applications Launched with mpirun
This version of the Nsight Systems CLI supports concurrent use of the nsys profile command. Each instance will create a separate report file.
You cannot use multiple instances of the interactive CLI concurrently, or use the interactive CLI concurrently with nsys profile in this version.
Nsight Systems can be used to profile applications launched with mpirun command. Since concurrent use of the CLI is supported only when using the nsys profile command, Nsight Systems cannot profile each node from the GUI or from the interactive CLI.
To profile everything, putting the data in one file:
nsys [nsys options] mpirun [mpi options]
To profile everything putting the data from each rank into a separate file:
mpirun [mpi options] nsys profile [nsys options]
#!/bin/bash
if [[ $OMPI_COMM_WORLD_RANK == 0 ]]; then
~/nsys/nsys profile ./myapp "$@" --mydummyargument
else
./myapp "$@"
fi
and then execute mpirun ./wrap.sh.
Note:
Currently you will need a dummy argument to the process, so that Nsight Systems can decide which process to profile. This means that your process must accept dummy arguments to take advantage of this workaround. This script as written is for Open MPI, but should be easily adaptable to other MPI implementations.
6. Report Scripts
Report Scripts Shipped With Nsight Systems
The Nsight Systems development team created and maintains a set of report scripts for some of the commonly requested reports. These scripts will be updated to adapt to any changes in SQLite schema or internal data structures.
These scripts are located in the Nsight Systems package in the Target-<architecture>/reports directory. The following standard reports are available:
apigpusum[:base] -- CUDA API & GPU Summary (CUDA API + kernels + memory ops)
Arguments
- base - Optional argument, if given, will cause summary to be over the base name of the kernel, rather than the templated name.
Output: All time values given in nanoseconds
- Time(%) : Percentage of Total Time
- Total Time : The total time used by all executions of this kernel
- Instances: The number of executions of this object
- Average : The average execution time of this kernel
- Minimum : The smallest execution time of this kernel
- Maximum : The largest execution time of this kernel
- Category : The category of the operation
- Operation : The name of the kernel
This report provides a summary of CUDA API calls, kernels and memory operations, and their execution times. Note that the Time(%) column is calculated using a summation of the Total Time column, and represents that API call's, kernel's, or memory operation's percent of the execution time of the APIs, kernels and memory operations listed, and not a percentage of the application wall or CPU execution time.
This report combines data from the cudaapisum, gpukernsum, and gpumemsizesum reports. It is very similar to profile section of nvprof --dependency-analysis.
cudaapisum -- CUDA API Summary
Arguments - None
Output: All time values given in nanoseconds
- Time(%) : Percentage of Total Time
- Total Time : The total time used by all executions of this function
- Num Calls : The number of calls to this function
- Average : The average execution time of this function
- Minimum : The smallest execution time of this function
- Maximum : The largest execution time of this function
- Name : The name of the function
This report provides a summary of CUDA API functions and their execution times. Note that the Time(%) column is calculated using a summation of the Total Time column, and represents that function's percent of the execution time of the functions listed, and not a percentage of the application wall or CPU execution time.
cudaapitrace -- CUDA API Trace
Arguments - None
Output: All time values given in nanoseconds
- Start : Timestamp when API call was made
- Duration : Length of API calls
- Name : API function name
- Result : return value of API call
- CorrID : Correlation used to map to other CUDA calls
- Pid : Process ID that made the call
- Tid : Thread ID that made the call
- T-Pri : Run priority of call thread
- Thread Name : Name of thread that called API function
This report provides a trace record of CUDA API function calls and their execution times.
gpukernsum[:base] -- CUDA GPU Kernel Summary
Arguments
- base - Optional argument, if given, will cause summary to be over the base name of the kernel, rather than the templated name.
Output: All time values given in nanoseconds
- Time(%) : Percentage of Total Time
- Total Time : The total time used by all executions of this kernel
- Instances : The number of calls to this kernal
- Average : The average execution time of this kernal
- Minimum : The smallest execution time of this kernal
- Maximum : The largest execution time of this kernal
- Name : The name of the kernal
This report provides a summary of CUDA kernels and their execution times. Note that the Time(%) column is calculated using a summation of the Total Time column, and represents that kernel's percent of the execution time of the kernels listed, and not a percentage of the application wall or CPU execution time.
gpumemsizesum -- GPU Memory Operations Summary (by Size)
Arguments - None
Output: All memory values given in KiB
- Total : Total number of KiB utilized by this operation
- Operations : Number of executions of this operation
- Average : The average memory size of this operation
- Minimum : The smallest memory size of this operation
- Maximum : The largest memory size of this operation
- Name : The name of the operation
This report provides a summary of GPU memory operations and the amount of memory they utilize.
gpumemtimesum -- GPU Memory Operations Summary (by Time)
Arguments - None
Output: All memory values given in KiB
- Time(%) : Percentage of Total Time
- Total Time : The total time used by all executions of this operation
- Operations: The number of operations of this type
- Average : The average execution time of this operation
- Minimum : The smallest execution time of this operation
- Maximum : The largest execution time of this operation
- Operation : The name of the memory operation
This report provides a summary of GPU memory operations and their execution times. Note that the Time(%) column is calculated using a summation of the Total Time column, and represents that operation's percent of the execution time of the operations listed, and not a percentage of the application wall or CPU execution time.
gpusum[:base] -- GPU Summary (kernels + memory operations)
Arguments
- base - Optional argument, if given, will cause summary to be over the base name of the kernel, rather than the templated name.
Output: All time values given in nanoseconds
- Time(%) : Percentage of Total Time
- Total Time : The total time used by all executions of this kernel
- Instances : The number of executions of this object
- Average : The average execution time of this kernal
- Minimum : The smallest execution time of this kernal
- Maximum : The largest execution time of this kernal
- Category : The category of the operation
- Name : The name of the kernal
This report provides a summary of CUDA kernels and memory operations, and their execution times. Note that the Time(%) column is calculated using a summation of the Total Time column, and represents that kernel's or memory operation's percent of the execution time of the kernels and memory operations listed, and not a\ percentage of the application wall or CPU execution time.
This report combines data from the gpukernsum and gpumemtimesum reports. This report is very similar to output of the command nvprof --print-gpu-summary.
gputrace -- CUDA GPU Trace
Arguments - None
Output:
- Start : Start time of trace event in seconds
- Duration : Length of event in nanoseconds
- CorrId : Correlation ID
- GrdX, GrdY, GrdZ : Grid values
- BlkX, BlkY, BlkZ : Block values
- Reg/Trd : Registers per thread
- StcSMem : Size of Static Shared Memory
- DymSMem : Size of Dynamic Shared Memory
- Bytes : Size of memory operation
- Thru : Throughput in MB per Second
- SrcMemKd : Memcpy source memory kind or memset memory kind
- DstMemKd : Memcpy destination memory kind
- Device : GPU device name and ID
- Ctx : Context ID
- Strm : Stream ID
- Name : Trace event name
This report displays a trace of CUDA kernels and memory operations. Items are sorted by start time.
nvtxppsum -- NVTX Push/Pop Range Summary
Arguments - None
Output: All time values given in nanoseconds
- Time(%) : Percentage of Total Time
- Total Time : The total time used by all instances of this range
- Instances : The number of instances of this range
- Average : The average execution time of this range
- Minimum : The smallest execution time of this range
- Maximum : The largest execution time of this range
- Range : The name of the range
This report provides a summary of NV Tools Extensions Push/Pop Ranges and their execution times. Note that the Time(%) column is calculated using a summation of the Total Time column, and represents that range's percent of the execution time of the ranges listed, and not a percentage of the application wall or CPU execution time.
openmpevtsum -- OpenMP Event Summary
Arguments - None
Output: All time values given in nanoseconds
- Time(%) : Percentage of Total Time
- Total Time : The total time used by all executions of event type
- Count : The number of event type
- Average : The average execution time of event type
- Minimum : The smallest execution time of event type
- Maximum : The largest execution time of event type
- Name : The name of the event
This report provides a summary of OpenMP events and their execution times. Note that the Time(%) column is calculated using a summation of the Total Time column, and represents that event type's percent of the execution time of the events listed, and not a percentage of the application wall or CPU execution time.
osrtsum -- OS Runtime Summary
Arguments - None
Output: All time values given in nanoseconds
- Time(%) : Percentage of Total Time
- Total Time : The total time used by all executions of this function
- Num Calls : The number of calls to this function
- Average : The average execution time of this function
- Minimum : The smallest execution time of this function
- Maximum : The largest execution time of this function
- Name : The name of the function
This report provides a summary of operating system functions and their execution times. Note that the Time(%) column is calculated using a summation of the Total Time column, and represents that function's percent of the execution time of the functions listed, and not a percentage of the application wall or CPU execution time.
Report Formatters Shipped With Nsight Systems
The following formats are available in Nsight Systems:
Column
Usage:
column[:nohdr][:nolimit][:nofmt][:<width>[:<width>]...]
Arguments
- nohdr : Do not display the header
- nolimit : Remove 100 character limit from auto-width columns Note: This can result in extremely wide columns.
- nofmt : Do not reformat numbers.
- <width>... : Define the explicit width of one or more columns. If the value "." is given, the column will auto-adjust. If a width of 0 is given, the column will not be displayed.
The column formatter presents data in vertical text columns. It is primarily designed to be a human-readable format for displaying data on a console display.
Text data will be left-justified, while numeric data will be right-justified. If the data overflows the available column width, it will be marked with a "…" character, to indicate the data values were clipped. Clipping always occurs on the right-hand side, even for numeric data.
Numbers will be reformatted to make easier to visually scan and understand. This includes adding thousands-separators. This process requires that the string representation of the number is converted into its native representation (integer or floating point) and then converted back into a string representation to print. This conversion process attempts to preserve elements of number presentation, such as the number of decimal places, or the use of scientific notation, but the conversion is not always perfect (the number should always be the same, but the presentation may not be). To disable the reformatting process, use the argument nofmt.
If no explicit width is given, the columns auto-adjust their width based off the header size and the first 100 lines of data. This auto-adjustment is limited to a maximum width of 100 characters. To allow larger auto-width columns, pass the initial argument nolimit. If the first 100 lines do not calculate the correct column width, it is suggested that explicit column widths be provided.
Table
Usage:
table[:nohdr][:nolimit][:nofmt][:<width>[:<width>]...]
Arguments
- nohdr : Do not display the header
- nolimit : Remove 100 character limit from auto-width columns Note: This can result in extremely wide columns.
- nofmt : Do not reformat numbers.
- <width>... : Define the explicit width of one or more columns. If the value "." is given, the column will auto-adjust. If a width of 0 is given, the column will not be displayed.
The table formatter presents data in vertical text columns inside text boxes. Other than the lines between columns, it is identical to the column formatter.
CSV
Usage:
csv[:nohdr]
Arguments
- nohdr : Do not display the header
The csv formatter outputs data as comma-separated values. This format is commonly used for import into other data applications, such as spread-sheets and databases.
There are many different standards for CSV files. Most differences are in how escapes are handled, meaning data values that contain a comma or space.
This CSV formatter will escape commas by surrounding the whole value in double-quotes.
TSV
Usage:
tsv[:nohdr][:esc]
Arguments
- nohdr : Do not display the header
- esc : escape tab characters, rather than removing them
The tsv formatter outputs data as tab-separated values. This format is sometimes used for import into other data applications, such as spreadsheets and databases.
Most TSV import/export systems disallow the tab character in data values. The formatter will normally replace any tab characters with a single space. If the esc argument has been provided, any tab characters will be replaced with the literal characters "\t".
JSON
Usage:
json
Arguments: no arguments
The json formatter outputs data as an array of JSON objects. Each object represents one line of data, and uses the column names as field labels. All objects have the same fields. The formatter attempts to recognize numeric values, as well as JSON keywords, and converts them. Empty values are passed as an empty string (and not nil, or as a missing field).
At this time the formatter does not escape quotes, so if a data value includes double-quotation marks, it will corrupt the JSON file.
HDoc
Usage:
hdoc[:title=<title>][:css=<URL>]
Arguments:
- title : string for HTML document title
- css : URL of CSS document to include
The hdoc formatter generates a complete, verifiable (mostly), standalone HTML document. It is designed to be opened in a web browser, or included in a larger document via an <iframe>.
HTable
Usage:
htable
Arguments: no arguments
The htable formatter outputs a raw HTML <table> without any of the surrounding HTML document. It is designed to be included into a larger HTML document. Although most web browsers will open and display the document, it is better to use the hdoc format for this type of use.
7. Migrating from NVIDIA nvprof
Using the Nsight Systems CLI nvprof Command
The nvprof command of the Nsight Systems CLI is intended to help former nvprof users transition to nsys. Many nvprof switches are not supported by nsys, often because they are now part of NVIDIA Nsight Compute.
The full nvprof documentation can be found at https://docs.nvidia.com/cuda/profiler-users-guide.
The nvprof transition guide for Nsight Compute can be found at https://docs.nvidia.com/nsight-compute/NsightComputeCli/index.html#nvprof-guide.
Any nvprof switch not listed below is not supported by the nsys nvprof command. No additional nsys functionality is available through this command. New features will not be added to this command in the future.
CLI nvprof Command Switch Options
After choosing the nvprof command switch, the following options are available. When you are ready to move to using Nsight Systems CLI directly, see Command Line Options documentation for the nsys switch(es) given below. Note that the nsys implementation and output may vary from nvprof.
Usage.
nsys nvprof [options]| Switch | Parameters (Default in Bold) | nsys switch | Switch Description |
|---|---|---|---|
| --annotate-mpi | off, openmpi, mpich | --trace=mpi AND --mpi-impl | Automatically annotate MPI calls with NVTX markers. Specify the MPI implementation installed on your machine. Only OpenMPI and MPICH implementations are supported. |
| --cpu-thread-tracing | on, off | --trace=osrt | Collect information about CPU thread API activity. |
| --profile-api-trace | none, runtime, driver,all | --trace=cuda | Turn on/off CUDA runtime and driver API tracing. For Nsight Systems there is no separate CUDA runtime and CUDA driver trace, so selecting runtime or driver is equivalent to selecting all . |
| --profile-from-start | on, off | if off use --capture-range=cudaProfilerApi | Enable/disable profiling from the start of the application. If disabled, the application can use {cu,cuda}Profiler{Start,Stop} to turn on/off profiling. |
| -t,--timeout | <nanoseconds> default=0 | --duration=seconds | If greater than 0, stop the collection and kill the launched application after timeout seconds. nvprof started counting when the CUDA driver is initialized. nsys starts counting immediately. |
| --cpu-profiling | on, off | --sampling=cpu | Turn on/off CPU profiling |
| --openacc-profiling | on, off | --trace=openacc to turn on | Enable/disable recording information from the OpenACC profiling interface. Note: OpenACC profiling interface depends on the presence of the OpenACC runtime. For supported runtimes, see CUDA Trace section of documentation |
| -o, --export-profile | <filename> | --output={filename} and/or --export=sqlite | Export named file to be imported or opened in the Nsight Systems GUI. %q{ENV_VAR} in string will be replaced with the set value of the environment variable. If not set this is an error. %h in the string is replaced with the system hostname. %% in the string is replaced with %. %p in the string is not supported currently. Any other character following % is illegal. The default is report1, with the number incrementing to avoid overwriting files, in users working directory. |
| -f, --force-overwrite | --force-overwrite=true | Force overwriting all output files with same name. | |
| -h, --help | --help | Print Nsight Systems CLI help | |
| -V, --version | --version | Print Nsight Systems CLI version information |
Next Steps
NVIDIA Visual Profiler (NVVP) and NVIDIA nvprof are deprecated. New GPUs and features will not be supported by those tools. We encourage you to make the move to Nsight Systems now. For additional information, suggestions, and rationale, see the blog series in Other Resources.
8. Profiling in a Docker on Linux Devices
Collecting data within a Docker
The following information assumes the reader is knowledgeable regarding Docker containers. For further information about Docker use in general, see the Docker documentation.
Enable Docker Collection
When starting the Docker to perform a Nsight Systems collection, additional steps are required to enable the perf_event_open system call. This is required in order to utilize the Linux kernel’s perf subsystem which provides sampling information to Nsight Systems.
There are three ways to enable the perf_event_open syscall. You can enable it by using the --privileged=true switch, adding --cap-add=SYS_ADMIN switch to your docker run command file, or you can enable it by setting the seccomp security profile if your system meets the requirements.
Secure computing mode (seccomp) is a feature of the Linux kernel that can be used to restrict an application's access. This feature is available only if the kernel is enabled with seccomp support. To check for seccomp support:
$ grep CONFIG_SECCOMP= /boot/config-$(uname -r)
The official Docker documentation says:
"Seccomp profiles require seccomp 2.2.1 which is not available on Ubuntu 14.04, Debian Wheezy, or Debian Jessie. To use seccomp on these distributions, you must download the latest static Linux binaries (rather than packages)."
{
    "name": "perf_event_open",
    "action": "SCMP_ACT_ALLOW",
    "args": []
},
Then you will be able to use the following switch when starting the Docker to apply the new seccomp profile.
--security-opt seccomp=default_with_perf.json
Launch Docker Collection
Here is an example command that has been used to launch a Docker for testing with Nsight Systems:
sudo nvidia-docker run --network=host --security-opt
seccomp=default_with_perf.json --rm -ti caffe-demo2 bash
There is a known issue where Docker collections terminate prematurely with older versions of the driver and the CUDA Toolkit. If collection is ending unexpectedly, please update to the latest versions.
After the Docker has been started, use the Nsight Systems CLI to launch a collection within the Docker. The resulting .qdstrm file can be imported into the Nsight Systems host like any other CLI result.
9. Direct3D Trace
Nsight Systems has the ability to trace both the Direct3D 11 API and the Direct3D 12 API on Windows targets.
9.1. D3D11 API trace
Nsight Systems can capture information about Direct3D 11 API calls made by the profiled process. This includes capturing the execution time of D3D11 API functions, performance markers, and frame durations.
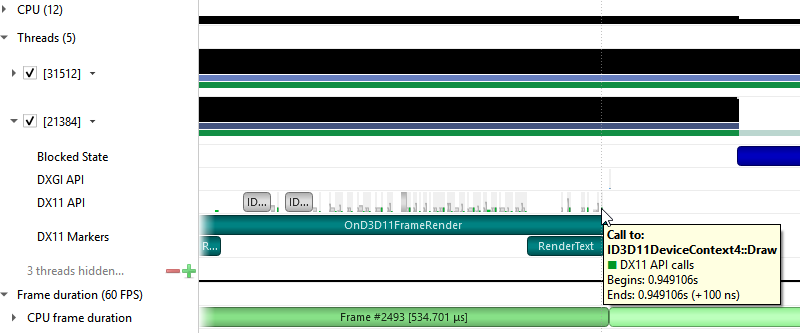
SLI Trace
Trace SLI queries and peer-to-peer transfers of D3D11 applications. Requires SLI hardware and an active SLI profile definition in the NVIDIA console.
9.2. D3D12 API Trace
Direct3D 12 is a low-overhead 3D graphics and compute API for Microsoft Windows. Information about Direct3D 12 can be found at the Direct3D 12 Programming Guide.
Nsight Systems can capture information about Direct3D 12 usage by the profiled process. This includes capturing the execution time of D3D12 API functions, corresponding workloads executed on the GPU, performance markers, and frame durations.
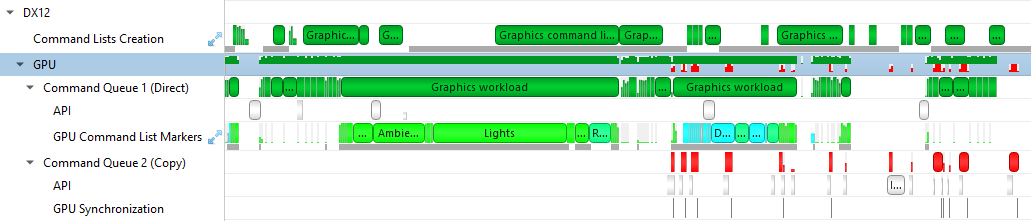
The Command List Creation row displays time periods when command lists were being created. This enables developers to improve their application’s multithreaded command list creation. Command list creation time period is measured between the call to ID3D12GraphicsCommandList::Reset and the call to ID3D12GraphicsCommandList::Close.
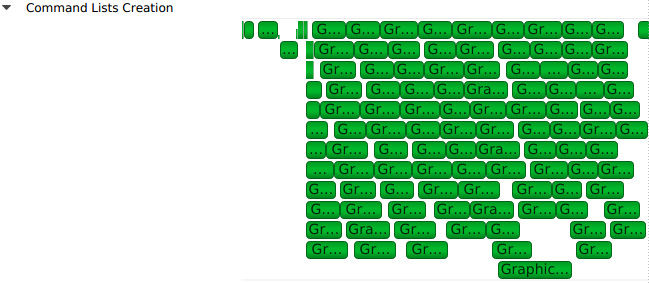
The GPU row shows an aggregated view of D3D12 API calls and GPU workloads. Note that not all D3D12 API calls are logged.

A Command Queue row is displayed for each D3D12 command queue created by the profiled application. The row’s header displays the queue's running index and its type (Direct, Compute, Copy).
The API row displays time periods where ID3D12CommandQueue::ExecuteCommandLists was called. The GPU Workload row displays time periods where workloads were executed by the GPU. The workload’s type (Graphics, Compute, Copy, etc.) is displayed on the bar representing the workload’s GPU execution.
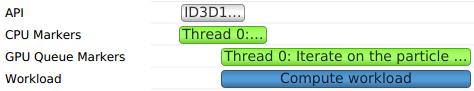
In addition, you can see the PIX command queue CPU-side performance markers, GPU-side performance markers and the GPU Command List performance markers, each in their row.


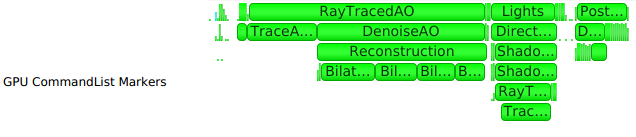
Clicking on a GPU workload highlights the corresponding ID3D12CommandQueue::ExecuteCommandLists, ID3D12GraphicsCommandList::Reset and ID3D12GraphicsCommandList::Close API calls, and vice versa.
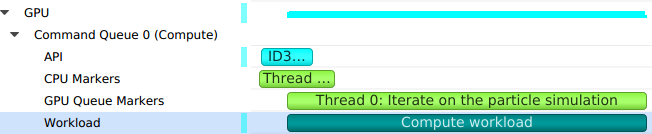
-
The CPU thread pushing a signal command and fence value into the command queue. This is displayed on the DX12 Synchronization sub-row of the calling thread.
-
The GPU executing that command, setting the fence value and signaling the fence. This is displayed on the GPU Queue Synchronization sub-row.
-
The CPU thread calling a Win32 wait API to block-wait until the fence is signaled. This is displayed on the Thread's OS runtime libraries row.
Clicking one of these will highlight it and the corresponding other two calls.
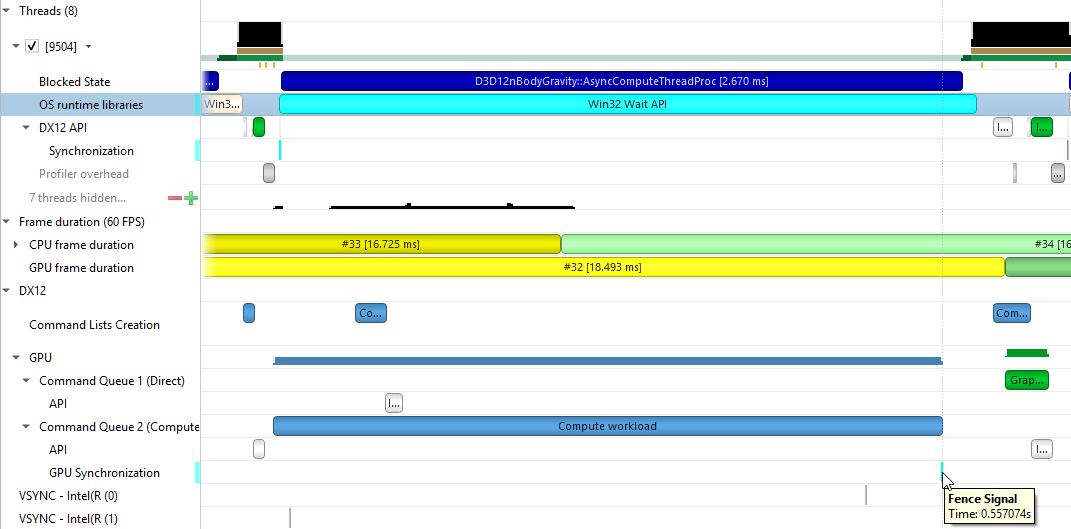
10. WDDM Queues
The Windows Display Driver Model (WDDM) architecture uses queues to send work packets from the CPU to the GPU. Each D3D device in each process is associated with one or more contexts. Graphics, compute, and copy commands that the profiled application uses are associated with a context, batched in a command buffer, and pushed into the relevant queue associated with that context.
Nsight Systems can capture the state of these queues during the trace session.
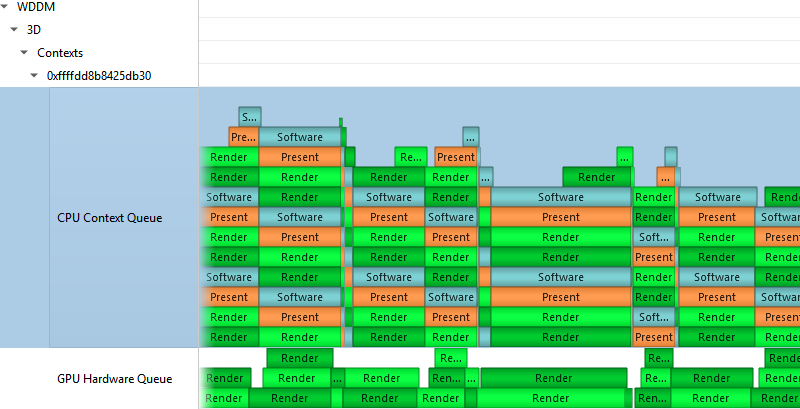
-
Render
-
Deferred
-
System
-
MMIOFlip
-
Wait
-
Signal
-
Device
-
Software
It may also be marked as a Present buffer, indicating that the application has finished rendering and requests to display the source surface.
See the Microsoft documentation for the WDDM architecture and the DXGKETW_QUEUE_PACKET_TYPE enumeration.
11. Vulkan API Trace
11.1. Vulkan Overview
Vulkan is a low-overhead, cross-platform 3D graphics and compute API, targeting a wide variety of devices from PCs to mobile phones and embedded platforms. The Vulkan API is defined by the Khronos Group. Information about Vulkan and the Khronos Group can be found at the Khronos Vulkan Site.
Nsight Systems can capture information about Vulkan usage by the profiled process. This includes capturing the execution time of Vulkan API functions, corresponding GPU workloads, debug util labels, and frame durations. Vulkan profiling is supported on both Windows and x86 Linux operating systems.
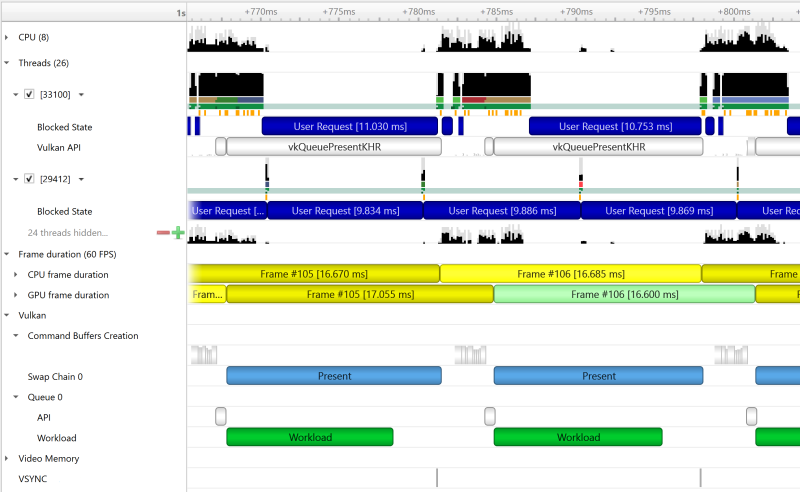
The Command Buffer Creation row displays time periods when command buffers were being created. This enables developers to improve their application’s multi-threaded command buffer creation. Command buffer creation time period is measured between the call to vkBeginCommandBuffer and the call to vkEndCommandBuffer.

The Swap chains row displays the available swap chains and the time periods where vkQueuePresentKHR was executed on each swap chain.

A Queue row is displayed for each Vulkan queue created by the profiled application. The API sub-row displays time periods where vkQueueSubmit was called. The GPU Workload sub-row displays time periods where workloads were executed by the GPU.

In addition, you can see Vulkan debug util labels on both the CPU and the GPU.
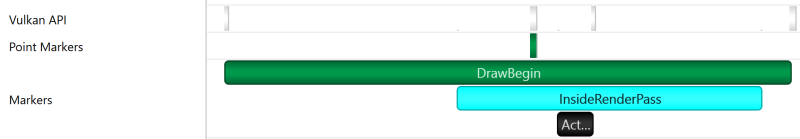
Clicking on a GPU workload highlights the corresponding vkQueueSubmit call, and vice versa.
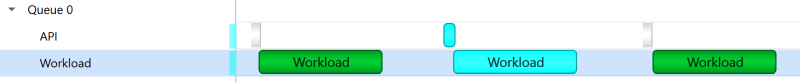
11.2. Pipeline Creation Feedback
When tracing target application calls to Vulkan pipeline creation APIs, Nsight Systems leverages the Pipeline Creation Feedback extension to collect more details about the duration of individual pipeline creation stages.
See Pipeline Creation Feedback extension for details about this extension.
Vulkan pipeline creation feedback is available on NVIDIA driver release 435 or later.
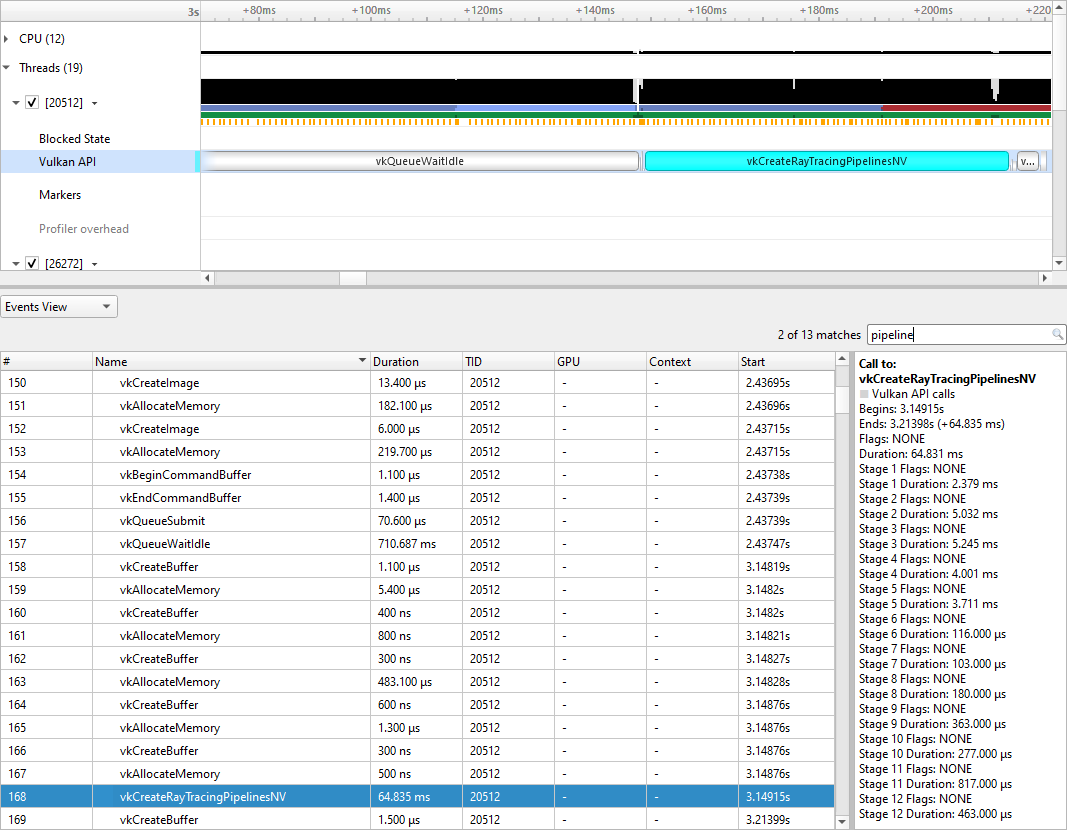
11.3. Vulkan GPU Trace Notes
-
Vulkan GPU trace is available only when tracing apps that use NVIDIA GPUs.
-
The endings of Vulkan Command Buffers execution ranges on Compute and Transfer queues may appear earlier on the timeline than their actual occurrence.
12. Stutter Analysis
12.1. FPS Overview
The Frame Duration section displays frame durations on both the CPU and the GPU.

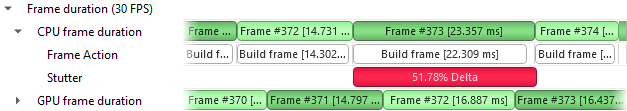
The stutter row highlights frames that are significantly longer than the other frames in their immediate vicinity.
The stutter row uses an algorithm that compares the duration of each frame to the median duration of the surrounding 19 frames. Duration difference under 4 milliseconds is never considered a stutter, to avoid cluttering the display with frames whose absolute stutter is small and not noticeable to the user.
-
Median duration is 10 ms. Frame with 13 ms time will not be reported (relative difference > 20%, absolute difference < 4 ms)
-
Median duration is 60 ms. Frame with 71 ms time will not be reported (relative difference < 20%, absolute difference > 4 ms)
-
Median duration is 60 ms. Frame with 80 ms is a stutter (relative difference > 20%, absolute difference > 4 ms, both conditions met)
OSC detection
The "19 frame window median" algorithm by itself may not work well with some cases of "oscillation" (consecutive fast and slow frames), resulting in some false positives. The median duration is not meaningful in cases of oscillation and can be misleading.
-
For every frame, calculate the median duration, 1st and 3rd quartiles of 19-frames window.
-
Calculate the delta and ratio between 1st and 3rd quartiles.
-
If the 90th percentile of 3rd – 1st quartile delta array > 4 ms AND the 90th percentile of 3rd/1st quartile array > 1.2 (120%) then mark the results with "OSC" text.
Right-clicking the Frame Duration row caption lets you choose the target frame rate (30, 60, 90 or custom frames per second).
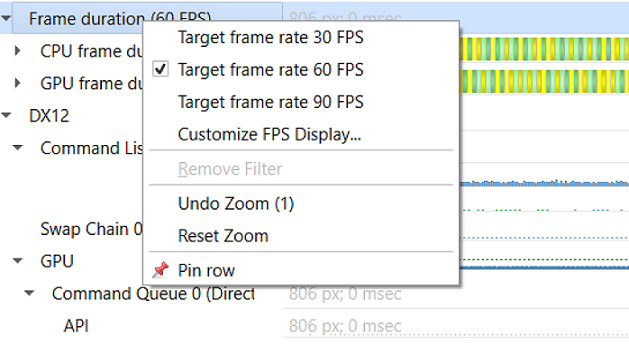
By clicking the Customize FPS Display option, a customization dialog pops up. In the dialog, you can now define the frame duration threshold to customize the view of the potentially problematic frames. In addition, you can define the threshold for the stutter analysis frames.
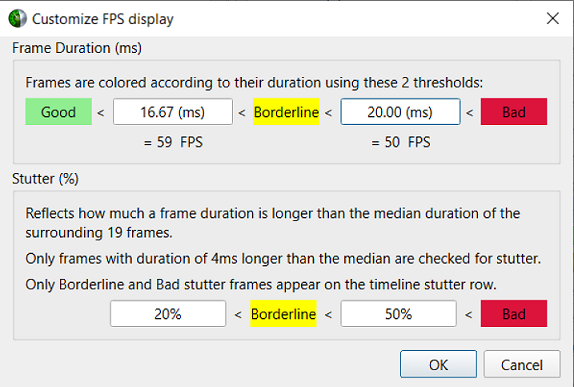
-
Green, the frame duration is shorter than required by the target FPS ratio.
-
Yellow, duration is slightly longer than required by the target FPS rate.
-
Red, duration far exceeds that required to maintain the target FPS rate.

-
The OpenGL frame boundaries are eglSwapBuffers/glXSwapBuffers/SwapBuffers calls.
-
The D3D11 and D3D12 frame boundaries are IDXGISwapChainX::Present calls.
-
The Vulkan frame boundaries are vkQueuePresentKHR calls.
-
The start time of the first GPU workload execution of this frame.
-
The start time of the first GPU workload execution of the next frame.
12.2. Frame Health
The Frame Health row displays actions that took significantly a longer time during the current frame, compared to the median time of the same actions executed during the surrounding 19-frames. This is a great tool for detecting the reason for frame time stuttering. Such actions may be: shader compilation, present, memory mapping, and more. Nsight Systems measures the accumulated time of such actions in each frame. For example: calculating the accumulated time of shader compilations in each frame and comparing it to the accumulated time of shader compilations in the surrounding 19 frames.
Example of a Vulkan frame health row:
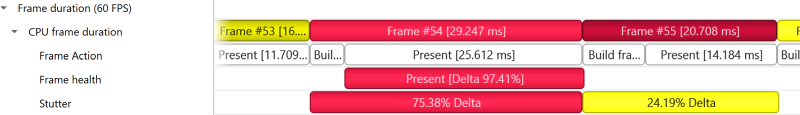
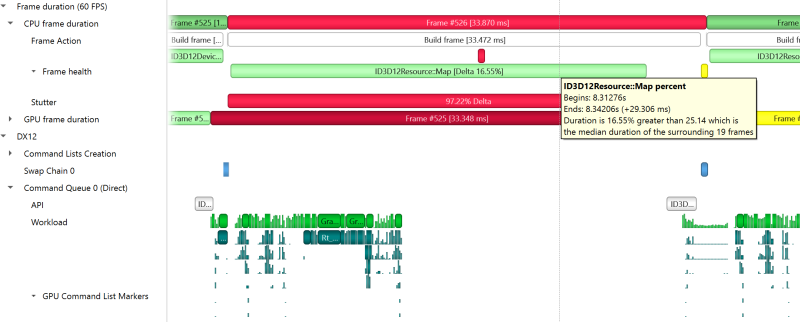
12.3. GPU Memory Utilization
The Memory Utilization row displays the amount of used local GPU memory and the commit limit for each GPU.
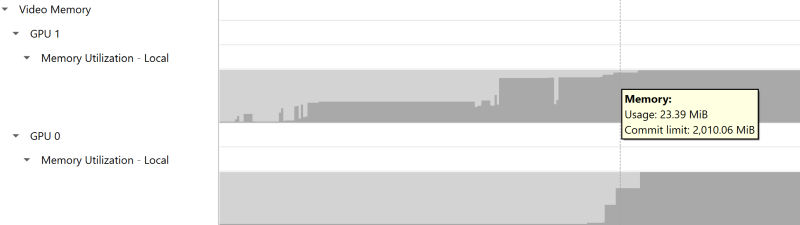
Note that this is not the same as the CUDA kernel memory allocation graph, see CUDA GPU Memory Graph for that functionality.
12.4. Vertical Synchronization
The VSYNC rows display when the monitor's vertical synchronizations occur.

13. MPI API Trace
For Linux x86_64 and Power targets, Nsight Systems is capable of capturing information about the MPI APIs executed in the profiled process. It has built-in API trace support only for the OpenMPI and MPICH implementations of MPI and only for a default list of synchronous APIs.
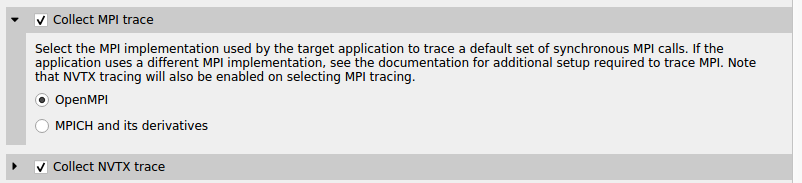
If you require more control over the list of traced APIs or if you are using a different MPI implementation, see github nvtx pmpi wrappers. You can use this documentation to generate a shared object to wrap a list of synchronous MPI APIs with NVTX using the MPI profiling interface (PMPI). If you set your LD_PRELOAD environment variable to the path of that object, Nsight Systems will capture and report the MPI API trace information when NVTX tracing is enabled.
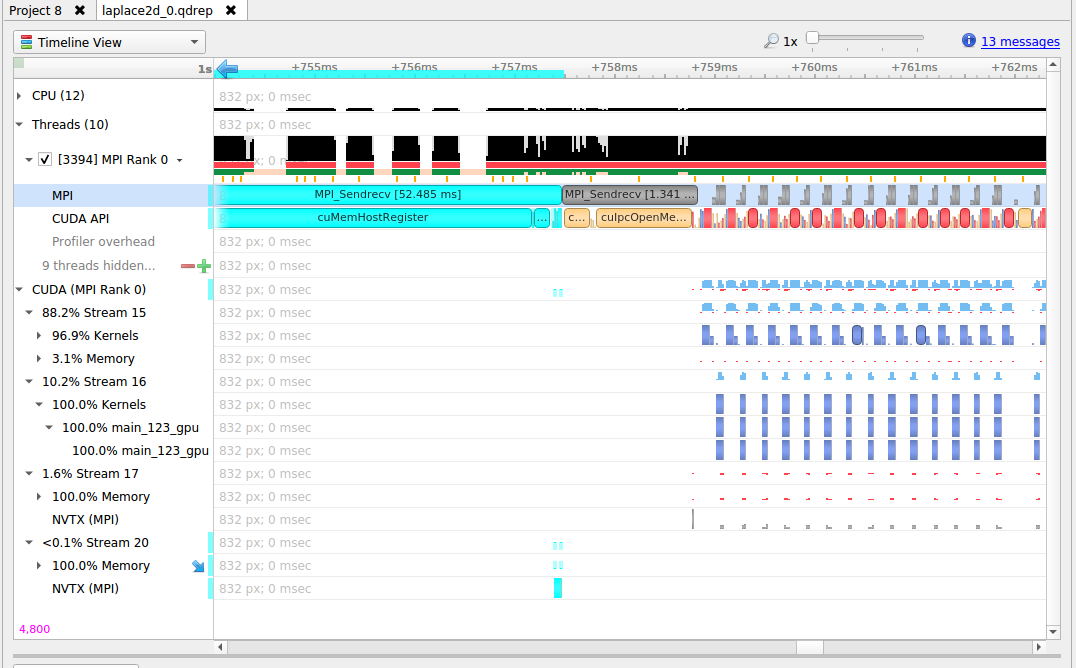
NVTX tracing is automatically enabled when MPI trace is turned on.
14. OpenMP Trace
Nsight Systems for Linux x86_64 and Power targets is capable of capturing information about OpenMP events. This functionality is built on the OpenMP Tools Interface (OMPT), full support is available only for runtime libraries supporting tools interface defined in OpenMP 5.0 or greater.
As an example, LLVM OpenMP runtime library partially implements tools interface. If you use PGI compiler <= 20.4 to build your OpenMP applications, add -mp=libomp switch to use LLVM OpenMP runtime and enable OMPT based tracing. If you use Clang, make sure the LLVM OpenMP runtime library you link to was compiled with tools interface enabled.
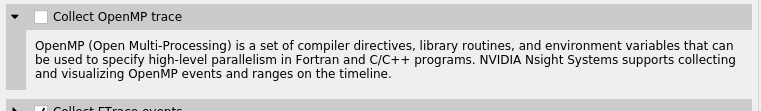
Only a subset of OpenMP events are traced. These are limited to the following:
ompt_callback_parallel_begin
ompt_callback_parallel_end
ompt_callback_sync_region
ompt_callback_task_create
ompt_callback_task_schedule
ompt_callback_implicit_task
ompt_callback_master
ompt_callback_reduction
ompt_callback_task_create
ompt_callback_cancel
ompt_callback_mutex_acquire, ompt_callback_mutex_acquired
ompt_callback_mutex_acquired, ompt_callback_mutex_released
ompt_callback_mutex_released
ompt_callback_work
ompt_callback_dispatch
ompt_callback_flush
Note:
These raw OMPT events are processed and reorganized by Nsight Systems to be more user-friendly. You may not see exact same events from the list.
Example screenshot:
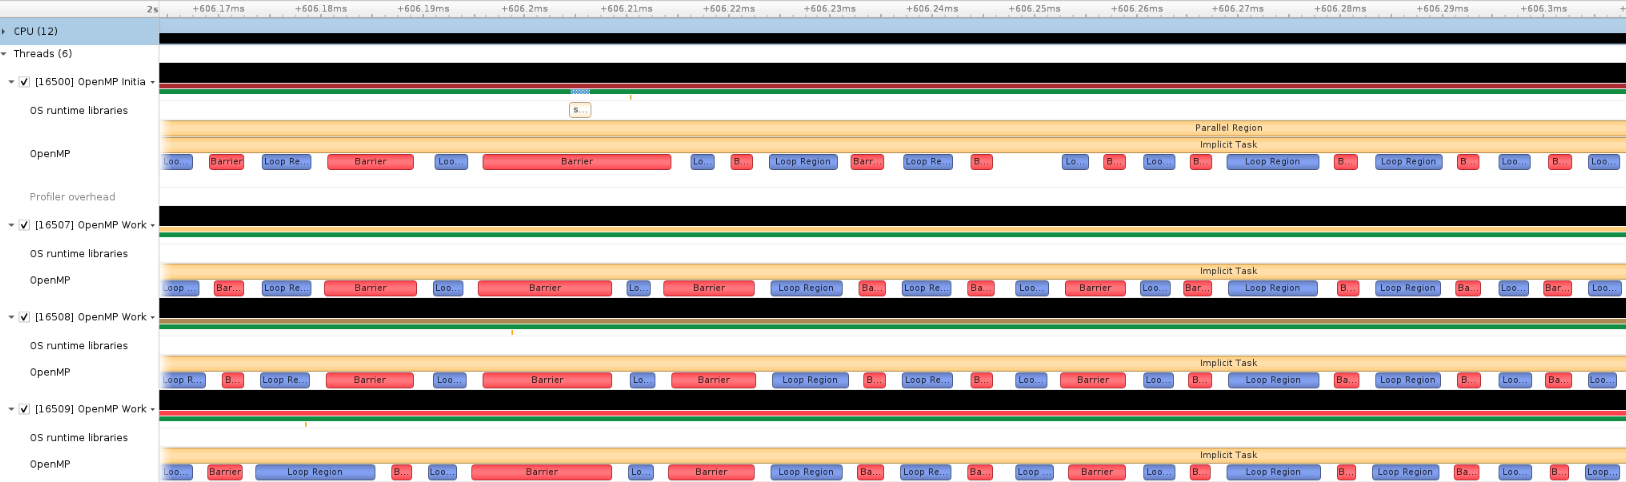
15. OS Runtime Libraries Trace
OS runtime libraries can be traced to gather information about low-level userspace APIs. This traces the system call wrappers and thread synchronization interfaces exposed by the C runtime and POSIX Threads (pthread) libraries. This does not perform a complete runtime library API trace, but instead focuses on the functions that can take a long time to execute, or could potentially cause your thread be unscheduled from the CPU while waiting for an event to complete.
-
Visualizing when the process is communicating with the hardware, controlling resources, performing multi-threading synchronization or interacting with the kernel scheduler.
-
Adding additional thread states by correlating how OS runtime libraries traces affect the thread scheduling:
-
Waiting — the thread is not scheduled on a CPU, it is inside of an OS runtime libraries trace and is believed to be waiting on the firmware to complete a request.
-
In OS runtime library function — the thread is scheduled on a CPU and inside of an OS runtime libraries trace. If the trace represents a system call, the process is likely running in kernel mode.
-
-
Collecting backtraces for long OS runtime libraries call. This provides a way to gather blocked-state backtraces, allowing you to gain more context about why the thread was blocked so long, yet avoiding unnecessary overhead for short events.
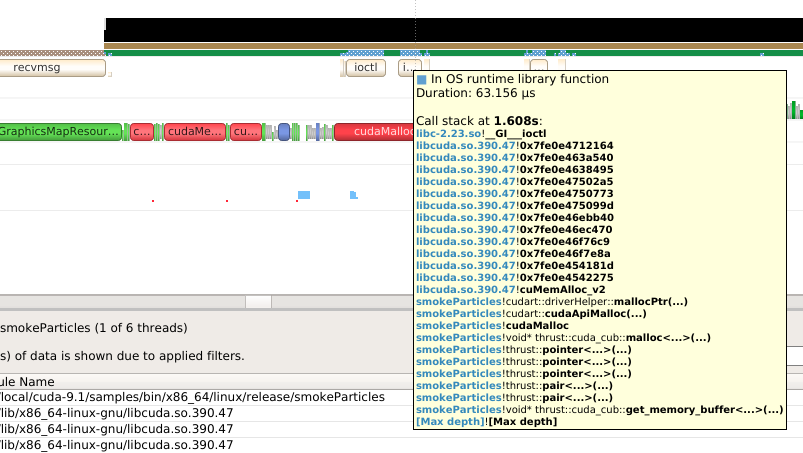
To enable OS runtime libraries tracing from Nsight Systems:
CLI — Use the -t, --trace option with the osrt parameter. See Command Line Options for more information.
GUI — Select the Collect OS runtime libraries trace checkbox.
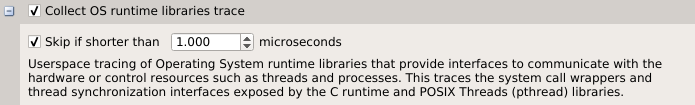
You can also use Skip if shorter than. This will skip calls shorter than the given threshold. Enabling this option will improve performances as well as reduce noise on thetimeline. We strongly encourage you to skip OS runtime libraries call shorter than 1 μs.
15.1. Locking a Resource
The functions listed below receive a special treatment. If the tool detects that the resource is already acquired by another thread and will induce a blocking call, we always trace it. Otherwise, it will never be traced.
pthread_mutex_lock
pthread_rwlock_rdlock
pthread_rwlock_wrlock
pthread_spin_lock
sem_wait
Note that even if a call is determined as potentially blocking, there is a chance that it may not actually block after a few cycles have elapsed. The call will still be traced in this scenario.
15.2. Limitations
-
Nsight Systems only traces syscall wrappers exposed by the C runtime. It is not able to trace syscall invoked through assembly code.
-
Additional thread states, as well as backtrace collection on long calls, are only enabled if sampling is turned on.
-
It is not possible to configure the depth and duration threshold when collecting backtraces. Currently, only OS runtime libraries calls longer than 80 μs will generate a backtrace with a maximum of 24 frames. This limitation will be removed in a future version of the product.
-
It is required to compile your application and libraries with the -funwind-tables compiler flag in order for Nsight Systems to unwind the backtraces correctly.
15.3. OS Runtime Libraries Trace Filters
The OS runtime libraries tracing is limited to a select list of functions. It also depends on the version of the C runtime linked to the application.
15.4. OS Runtime Default Function List
Libc system call wrappers
accept
accept4
acct
alarm
arch_prctl
bind
bpf
brk
chroot
clock_nanosleep
connect
copy_file_range
creat
creat64
dup
dup2
dup3
epoll_ctl
epoll_pwait
epoll_wait
fallocate
fallocate64
fcntl
fdatasync
flock
fork
fsync
ftruncate
futex
ioctl
ioperm
iopl
kill
killpg
listen
membarrier
mlock
mlock2
mlockall
mmap
mmap64
mount
move_pages
mprotect
mq_notify
mq_open
mq_receive
mq_send
mq_timedreceive
mq_timedsend
mremap
msgctl
msgget
msgrcv
msgsnd
msync
munmap
nanosleep
nfsservctl
open
open64
openat
openat64
pause
pipe
pipe2
pivot_root
poll
ppoll
prctl
pread
pread64
preadv
preadv2
preadv64
process_vm_readv
process_vm_writev
pselect6
ptrace
pwrite
pwrite64
pwritev
pwritev2
pwritev64
read
readv
reboot
recv
recvfrom
recvmmsg
recvmsg
rt_sigaction
rt_sigqueueinfo
rt_sigsuspend
rt_sigtimedwait
sched_yield
seccomp
select
semctl
semget
semop
semtimedop
send
sendfile
sendfile64
sendmmsg
sendmsg
sendto
shmat
shmctl
shmdt
shmget
shutdown
sigaction
sigsuspend
sigtimedwait
socket
socketpair
splice
swapoff
swapon
sync
sync_file_range
syncfs
tee
tgkill
tgsigqueueinfo
tkill
truncate
umount2
unshare
uselib
vfork
vhangup
vmsplice
wait
wait3
wait4
waitid
waitpid
write
writev
_sysctl
POSIX Threads
pthread_barrier_wait
pthread_cancel
pthread_cond_broadcast
pthread_cond_signal
pthread_cond_timedwait
pthread_cond_wait
pthread_create
pthread_join
pthread_kill
pthread_mutex_lock
pthread_mutex_timedlock
pthread_mutex_trylock
pthread_rwlock_rdlock
pthread_rwlock_timedrdlock
pthread_rwlock_timedwrlock
pthread_rwlock_tryrdlock
pthread_rwlock_trywrlock
pthread_rwlock_wrlock
pthread_spin_lock
pthread_spin_trylock
pthread_timedjoin_np
pthread_tryjoin_np
pthread_yield
sem_timedwait
sem_trywait
sem_wait
I/O
aio_fsync
aio_fsync64
aio_suspend
aio_suspend64
fclose
fcloseall
fflush
fflush_unlocked
fgetc
fgetc_unlocked
fgets
fgets_unlocked
fgetwc
fgetwc_unlocked
fgetws
fgetws_unlocked
flockfile
fopen
fopen64
fputc
fputc_unlocked
fputs
fputs_unlocked
fputwc
fputwc_unlocked
fputws
fputws_unlocked
fread
fread_unlocked
freopen
freopen64
ftrylockfile
fwrite
fwrite_unlocked
getc
getc_unlocked
getdelim
getline
getw
getwc
getwc_unlocked
lockf
lockf64
mkfifo
mkfifoat
posix_fallocate
posix_fallocate64
putc
putc_unlocked
putwc
putwc_unlocked
Miscellaneous
forkpty
popen
posix_spawn
posix_spawnp
sigwait
sigwaitinfo
sleep
system
usleep
16. NVTX Trace
The NVIDIA Tools Extension Library (NVTX) is a powerful mechanism that allows users to manually instrument their application. Nsight Systems can then collect the information and present it on the timeline.
Nsight Systems supports version 3.0 of the NVTX specification.
The following features are supported:
-
Domains
nvtxDomainCreate(), nvtxDomainDestroy()
nvtxDomainRegisterString()
-
Push-pop ranges (nested ranges that start and end in the same thread).
nvtxRangePush(), nvtxRangePushEx()
nvtxRangePop()
nvtxDomainRangePushEx()
nvtxDomainRangePop()
-
Start-end ranges (ranges that are global to the process and are not restricted to a single thread)
nvtxRangeStart(), nvtxRangeStartEx()
nvtxRangeEnd()
nvtxDomainRangeStartEx()
nvtxDomainRangeEnd()
-
Marks
nvtxMark(), nvtxMarkEx()
nvtxDomainMarkEx()
-
Thread names
nvtxNameOsThread()
-
Categories
nvtxNameCategory()
nvtxDomainNameCategory()
To learn more about specific features of NVTX, please refer to the NVTX header file: nvToolsExt.h or the NVTX documentation.
-
Add #include "nvtx3/nvToolsExt.h" in your source code. The nvtx3 directory is located in the Nsight Systems package in the Target-<architecture>/nvtx/include directory and is available via github at http://github.com/NVIDIA/NVTX.
-
Add the following compiler flag: -ldl
-
Add calls to the NVTX API functions. For example, try adding nvtxRangePush("main") in the beginning of the main() function, and nvtxRangePop() just before the return statement in the end.
For convenience in C++ code, consider adding a wrapper that implements RAII (resource acquisition is initialization) pattern, which would guarantee that every range gets closed.
-
In the project settings, select the Collect NVTX trace checkbox.
-
If you are on Android target, make sure that your application is launched by Nsight Systems. This is required so that the necessary launch environment is prepared, and the library responsible for collection of NVTX trace data is properly injected into the process.
-
If you are on Linux on Tegra, if launching the application manually, the following environment variables should be specified:
-
For ARMv7 processes:
NVTX_INJECTION32_PATH=/opt/nvidia/nsight_systems/libToolsInjection32.so
-
For ARMv8 processes:
NVTX_INJECTION64_PATH=/opt/nvidia/nsight_systems/libToolsInjection64.so
-
Typically calls to NVTX functions can be left in the source code even if the application is not being built for profiling purposes, since the overhead is very low when the profiler is not attached.
NVTX is not intended to annotate very small pieces of code that are being called very frequently. A good rule of thumb to use: if code being annotated usually takes less than 1 microsecond to execute, adding an NVTX range around this code should be done carefully.
Note:
Range annotations should be matched carefully. If many ranges are opened but not closed, Nsight Systems has no meaningful way to visualize it. A rule of thumb is to not have more than a couple dozen ranges open at any point in time. Nsight Systems does not support reports with many unclosed ranges.
17. CUDA Trace
Nsight Systems is capable of capturing information about CUDA execution in the profiled process.
-
CUDA API trace — trace of CUDA Runtime and CUDA Driver calls made by the application.
-
CUDA Runtime calls typically start with cuda prefix (e.g. cudaLaunch).
-
CUDA Driver calls typically start with cu prefix (e.g. cuDeviceGetCount).
-
-
CUDA workload trace — trace of activity happening on the GPU, which includes memory operations (e.g., Host-to-Device memory copies) and kernel executions. Within the threads that use the CUDA API, additional child rows will appear in the timeline tree.
-
On Nsight Systems Workstation Edition, cuDNN and cuBLAS API tracing and OpenACC tracing.
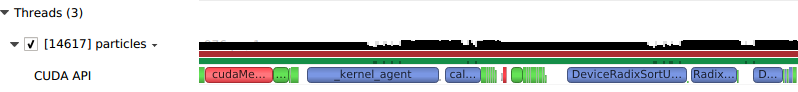
Near the bottom of the timeline row tree, the GPU node will appear and contain a CUDA node. Within the CUDA node, each CUDA context used within the process will be shown along with its corresponding CUDA streams. Steams will contain memory operations and kernel launches on the GPU. Kernel launches are represented by blue, while memory transfers are displayed in red.
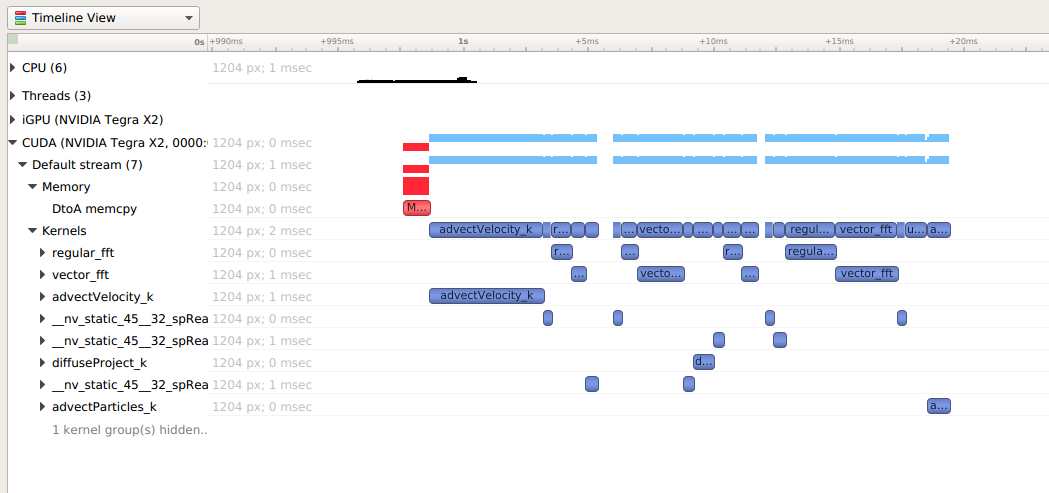
The easiest way to capture CUDA information is to launch the process from Nsight Systems, and it will setup the environment for you. To do so, simply set up a normal launch and select the Collect CUDA trace checkbox.
For Nsight Systems Workstation Edition this looks like:
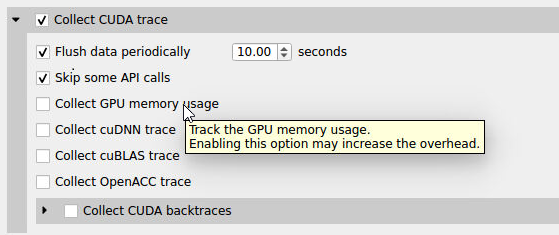
For Nsight Systems Embedded Platforms Edition this looks like:
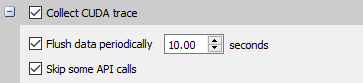
Additional configuration parameters are available:
-
Collect backtraces for API calls longer than X seconds - turns on collection of CUDA API backtraces and sets the minimum time a CUDA API event must take before its backtraces are collected. Setting this value too low can cause high application overhead and seriously increase the size of your results file.
-
Flush data periodically — specifies the period after which an attempt to flush CUDA trace data will be made. Normally, in order to collect full CUDA trace, the application needs to finalize the device used for CUDA work (call cudaDeviceReset(), and then let the application gracefully exit (as opposed to crashing).
This option allows flushing CUDA trace data even before the device is finalized. However, it might introduce additional overhead to a random CUDA Driver or CUDA Runtime API call.
-
Skip some API calls — avoids tracing insignificant CUDA Runtime API calls (namely, cudaConfigureCall(), cudaSetupArgument(), cudaHostGetDevicePointers()). Not tracing these functions allows Nsight Systems to significantly reduce the profiling overhead, without losing any interesting data. (See CUDA Trace Filters, below)
-
Collect GPU Memory Usage - collects information used to generate a graph of CUDA allocated memory across time. Note that this will increase overhead. See section on CUDA GPU Memory Allocation Graph below.
-
For Nsight Systems Workstation Edition, Collect cuDNN trace, Collect cuBLAS trace, Collect OpenACC trace - selects which (if any) extra libraries that depend on CUDA to trace.
OpenACC versions 2.0, 2.5, and 2.6 are supported when using PGI runtime version 15.7 or greater and not compiling statically. In order to differentiate constructs, a PGI runtime of 16.1 or later is required. Note that Nsight Systems Workstation Edition does not support the GCC implementation of OpenACC at this time.
-
For Nsight Systems Embedded Platforms Edition if desired, the target application can be manually set up to collect CUDA trace. To capture information about CUDA execution, the following requirements should be satisfied:
-
The profiled process should be started with the specified environment variable, depending on the architecture of the process:
-
For ARMv7 (32-bit) processes: CUDA_INJECTION32_PATH, which should point to the injection library:
/opt/nvidia/nsight_systems/libToolsInjection32.so
-
For ARMv8 (64-bit) processes: CUDA_INJECTION64_PATH, which should point to the injection library:
/opt/nvidia/nsight_systems/libToolsInjection64.so
-
-
If the application is started by Nsight Systems, all required environment variables will be set automatically.
-
Please note that if your application crashes before all collected CUDA trace data has been copied out, some or all data might be lost and not present in the report.
17.1. CUDA GPU Memory Allocation Graph
When the Collect GPU Memory Usage option is selected from the Collect CUDA trace option set, Nsight Systems will track CUDA GPU memory allocations and deallocations and present a graph of this information in the timeline. This is not the same as the GPU memory graph generated during stutter analysis on the Windows target (see Stutter Memory Trace)
Below, in the report on the left, memory is allocated and freed during the collection. In the report on the right memory is allocated, but not freed during the collection
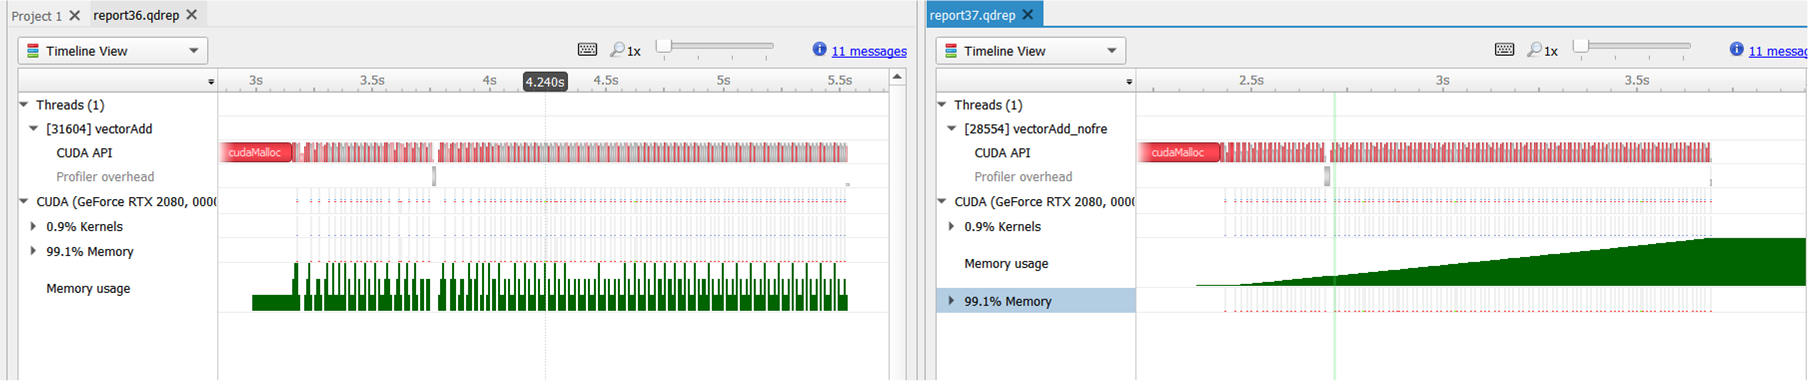
Here is another example, where allocations are happening on multiple GPUs
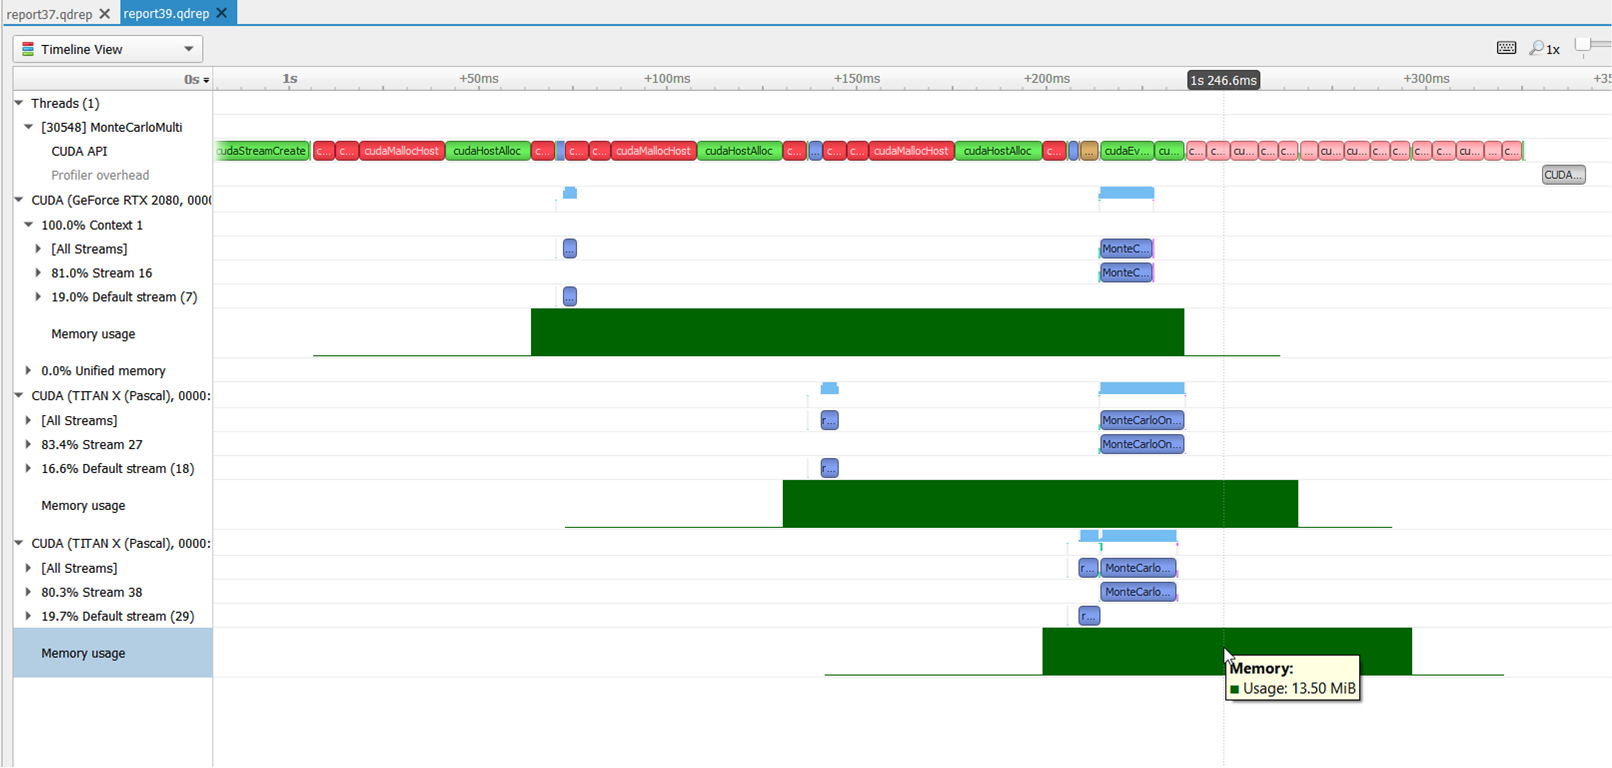
17.2. Unified Memory Transfer Trace
For Nsight Systems Workstation Edition, Unified Memory (also called Managed Memory) transfer trace is enabled automatically in Nsight Systems when CUDA trace is selected. It incurs no overhead in programs that do not perform any Unified Memory transfers. Data is displayed in the Managed Memory area of the timeline:
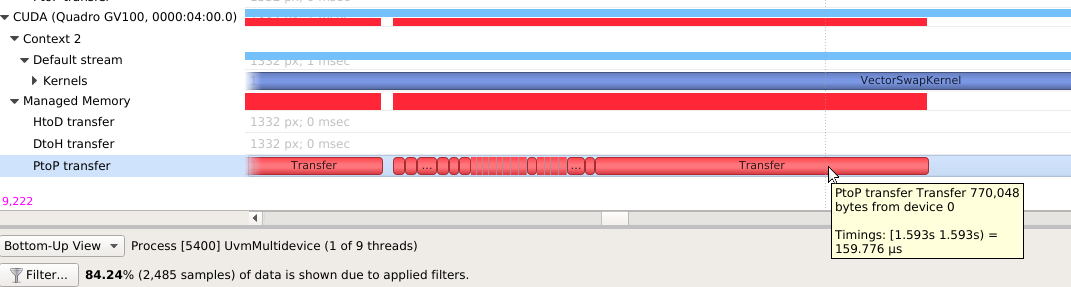
HtoD transfer indicates the CUDA kernel accessed managed memory that was residing on the host, so the kernel execution paused and transferred the data to the device. Heavy traffic here will incur performance penalties in CUDA kernels, so consider using manual cudaMemcpy operations from pinned host memory instead.
PtoP transfer indicates the CUDA kernel accessed managed memory that was residing on a different device, so the kernel execution paused and transferred the data to this device. Heavy traffic here will incur performance penalties, so consider using manual cudaMemcpyPeer operations to transfer from other devices' memory instead. The row showing these events is for the destination device -- the source device is shown in the tooltip for each transfer event.
DtoH transfer indicates the CPU accessed managed memory that was residing on a CUDA device, so the CPU execution paused and transferred the data to system memory. Heavy traffic here will incur performance penalties in CPU code, so consider using manual cudaMemcpy operations from pinned host memory instead.
Some UVM transfers are highlighted with red to indicate potential performance issues:
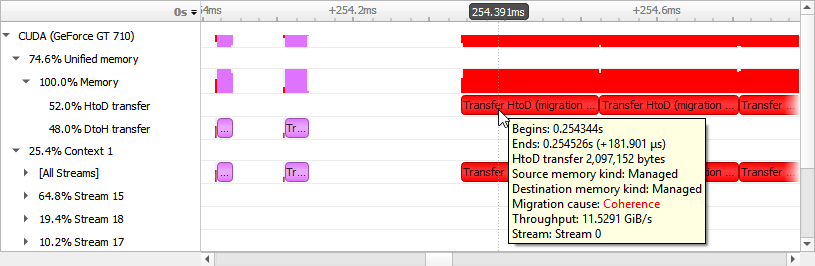
-
Coherence
UVM migration occurred to guarantee data coherence. SMs (streaming multiprocessors) stop until the migration completes. -
Eviction
UVM migrated to the CPU because it was evicted to make room for another block of memory on the GPU. This happens due to memory overcommitment which is available on Linux with Compute Capability ≥ 6.
17.3. CUDA Default Function List for CLI
CUDA Runtime API
cudaBindSurfaceToArray
cudaBindTexture
cudaBindTexture2D
cudaBindTextureToArray
cudaBindTextureToMipmappedArray
cudaConfigureCall
cudaCreateSurfaceObject
cudaCreateTextureObject
cudaD3D10MapResources
cudaD3D10RegisterResource
cudaD3D10UnmapResources
cudaD3D10UnregisterResource
cudaD3D9MapResources
cudaD3D9MapVertexBuffer
cudaD3D9RegisterResource
cudaD3D9RegisterVertexBuffer
cudaD3D9UnmapResources
cudaD3D9UnmapVertexBuffer
cudaD3D9UnregisterResource
cudaD3D9UnregisterVertexBuffer
cudaDestroySurfaceObject
cudaDestroyTextureObject
cudaDeviceReset
cudaDeviceSynchronize
cudaEGLStreamConsumerAcquireFrame
cudaEGLStreamConsumerConnect
cudaEGLStreamConsumerConnectWithFlags
cudaEGLStreamConsumerDisconnect
cudaEGLStreamConsumerReleaseFrame
cudaEGLStreamConsumerReleaseFrame
cudaEGLStreamProducerConnect
cudaEGLStreamProducerDisconnect
cudaEGLStreamProducerReturnFrame
cudaEventCreate
cudaEventCreateFromEGLSync
cudaEventCreateWithFlags
cudaEventDestroy
cudaEventQuery
cudaEventRecord
cudaEventRecord_ptsz
cudaEventSynchronize
cudaFree
cudaFreeArray
cudaFreeHost
cudaFreeMipmappedArray
cudaGLMapBufferObject
cudaGLMapBufferObjectAsync
cudaGLRegisterBufferObject
cudaGLUnmapBufferObject
cudaGLUnmapBufferObjectAsync
cudaGLUnregisterBufferObject
cudaGraphicsD3D10RegisterResource
cudaGraphicsD3D11RegisterResource
cudaGraphicsD3D9RegisterResource
cudaGraphicsEGLRegisterImage
cudaGraphicsGLRegisterBuffer
cudaGraphicsGLRegisterImage
cudaGraphicsMapResources
cudaGraphicsUnmapResources
cudaGraphicsUnregisterResource
cudaGraphicsVDPAURegisterOutputSurface
cudaGraphicsVDPAURegisterVideoSurface
cudaHostAlloc
cudaHostRegister
cudaHostUnregister
cudaLaunch
cudaLaunchCooperativeKernel
cudaLaunchCooperativeKernelMultiDevice
cudaLaunchCooperativeKernel_ptsz
cudaLaunchKernel
cudaLaunchKernel_ptsz
cudaLaunch_ptsz
cudaMalloc
cudaMalloc3D
cudaMalloc3DArray
cudaMallocArray
cudaMallocHost
cudaMallocManaged
cudaMallocMipmappedArray
cudaMallocPitch
cudaMemGetInfo
cudaMemPrefetchAsync
cudaMemPrefetchAsync_ptsz
cudaMemcpy
cudaMemcpy2D
cudaMemcpy2DArrayToArray
cudaMemcpy2DArrayToArray_ptds
cudaMemcpy2DAsync
cudaMemcpy2DAsync_ptsz
cudaMemcpy2DFromArray
cudaMemcpy2DFromArrayAsync
cudaMemcpy2DFromArrayAsync_ptsz
cudaMemcpy2DFromArray_ptds
cudaMemcpy2DToArray
cudaMemcpy2DToArrayAsync
cudaMemcpy2DToArrayAsync_ptsz
cudaMemcpy2DToArray_ptds
cudaMemcpy2D_ptds
cudaMemcpy3D
cudaMemcpy3DAsync
cudaMemcpy3DAsync_ptsz
cudaMemcpy3DPeer
cudaMemcpy3DPeerAsync
cudaMemcpy3DPeerAsync_ptsz
cudaMemcpy3DPeer_ptds
cudaMemcpy3D_ptds
cudaMemcpyArrayToArray
cudaMemcpyArrayToArray_ptds
cudaMemcpyAsync
cudaMemcpyAsync_ptsz
cudaMemcpyFromArray
cudaMemcpyFromArrayAsync
cudaMemcpyFromArrayAsync_ptsz
cudaMemcpyFromArray_ptds
cudaMemcpyFromSymbol
cudaMemcpyFromSymbolAsync
cudaMemcpyFromSymbolAsync_ptsz
cudaMemcpyFromSymbol_ptds
cudaMemcpyPeer
cudaMemcpyPeerAsync
cudaMemcpyToArray
cudaMemcpyToArrayAsync
cudaMemcpyToArrayAsync_ptsz
cudaMemcpyToArray_ptds
cudaMemcpyToSymbol
cudaMemcpyToSymbolAsync
cudaMemcpyToSymbolAsync_ptsz
cudaMemcpyToSymbol_ptds
cudaMemcpy_ptds
cudaMemset
cudaMemset2D
cudaMemset2DAsync
cudaMemset2DAsync_ptsz
cudaMemset2D_ptds
cudaMemset3D
cudaMemset3DAsync
cudaMemset3DAsync_ptsz
cudaMemset3D_ptds
cudaMemsetAsync
cudaMemsetAsync_ptsz
cudaMemset_ptds
cudaPeerRegister
cudaPeerUnregister
cudaStreamAddCallback
cudaStreamAddCallback_ptsz
cudaStreamAttachMemAsync
cudaStreamAttachMemAsync_ptsz
cudaStreamCreate
cudaStreamCreateWithFlags
cudaStreamCreateWithPriority
cudaStreamDestroy
cudaStreamQuery
cudaStreamQuery_ptsz
cudaStreamSynchronize
cudaStreamSynchronize_ptsz
cudaStreamWaitEvent
cudaStreamWaitEvent_ptsz
cudaThreadSynchronize
cudaUnbindTexture
CUDA Primary API
cu64Array3DCreate
cu64ArrayCreate
cu64D3D9MapVertexBuffer
cu64GLMapBufferObject
cu64GLMapBufferObjectAsync
cu64MemAlloc
cu64MemAllocPitch
cu64MemFree
cu64MemGetInfo
cu64MemHostAlloc
cu64Memcpy2D
cu64Memcpy2DAsync
cu64Memcpy2DUnaligned
cu64Memcpy3D
cu64Memcpy3DAsync
cu64MemcpyAtoD
cu64MemcpyDtoA
cu64MemcpyDtoD
cu64MemcpyDtoDAsync
cu64MemcpyDtoH
cu64MemcpyDtoHAsync
cu64MemcpyHtoD
cu64MemcpyHtoDAsync
cu64MemsetD16
cu64MemsetD16Async
cu64MemsetD2D16
cu64MemsetD2D16Async
cu64MemsetD2D32
cu64MemsetD2D32Async
cu64MemsetD2D8
cu64MemsetD2D8Async
cu64MemsetD32
cu64MemsetD32Async
cu64MemsetD8
cu64MemsetD8Async
cuArray3DCreate
cuArray3DCreate_v2
cuArrayCreate
cuArrayCreate_v2
cuArrayDestroy
cuBinaryFree
cuCompilePtx
cuCtxCreate
cuCtxCreate_v2
cuCtxDestroy
cuCtxDestroy_v2
cuCtxSynchronize
cuD3D10CtxCreate
cuD3D10CtxCreateOnDevice
cuD3D10CtxCreate_v2
cuD3D10MapResources
cuD3D10RegisterResource
cuD3D10UnmapResources
cuD3D10UnregisterResource
cuD3D11CtxCreate
cuD3D11CtxCreateOnDevice
cuD3D11CtxCreate_v2
cuD3D9CtxCreate
cuD3D9CtxCreateOnDevice
cuD3D9CtxCreate_v2
cuD3D9MapResources
cuD3D9MapVertexBuffer
cuD3D9MapVertexBuffer_v2
cuD3D9RegisterResource
cuD3D9RegisterVertexBuffer
cuD3D9UnmapResources
cuD3D9UnmapVertexBuffer
cuD3D9UnregisterResource
cuD3D9UnregisterVertexBuffer
cuEGLStreamConsumerAcquireFrame
cuEGLStreamConsumerConnect
cuEGLStreamConsumerConnectWithFlags
cuEGLStreamConsumerDisconnect
cuEGLStreamConsumerReleaseFrame
cuEGLStreamProducerConnect
cuEGLStreamProducerDisconnect
cuEGLStreamProducerPresentFrame
cuEGLStreamProducerReturnFrame
cuEventCreate
cuEventCreateFromEGLSync
cuEventCreateFromNVNSync
cuEventDestroy
cuEventDestroy_v2
cuEventQuery
cuEventRecord
cuEventRecord_ptsz
cuEventSynchronize
cuGLCtxCreate
cuGLCtxCreate_v2
cuGLInit
cuGLMapBufferObject
cuGLMapBufferObjectAsync
cuGLMapBufferObjectAsync_v2
cuGLMapBufferObjectAsync_v2_ptsz
cuGLMapBufferObject_v2
cuGLMapBufferObject_v2_ptds
cuGLRegisterBufferObject
cuGLUnmapBufferObject
cuGLUnmapBufferObjectAsync
cuGLUnregisterBufferObject
cuGraphicsD3D10RegisterResource
cuGraphicsD3D11RegisterResource
cuGraphicsD3D9RegisterResource
cuGraphicsEGLRegisterImage
cuGraphicsGLRegisterBuffer
cuGraphicsGLRegisterImage
cuGraphicsMapResources
cuGraphicsMapResources_ptsz
cuGraphicsUnmapResources
cuGraphicsUnmapResources_ptsz
cuGraphicsUnregisterResource
cuGraphicsVDPAURegisterOutputSurface
cuGraphicsVDPAURegisterVideoSurface
cuInit
cuLaunch
cuLaunchCooperativeKernel
cuLaunchCooperativeKernelMultiDevice
cuLaunchCooperativeKernel_ptsz
cuLaunchGrid
cuLaunchGridAsync
cuLaunchKernel
cuLaunchKernel_ptsz
cuLinkComplete
cuLinkCreate
cuLinkCreate_v2
cuLinkDestroy
cuMemAlloc
cuMemAllocHost
cuMemAllocHost_v2
cuMemAllocManaged
cuMemAllocPitch
cuMemAllocPitch_v2
cuMemAlloc_v2
cuMemFree
cuMemFreeHost
cuMemFree_v2
cuMemGetInfo
cuMemGetInfo_v2
cuMemHostAlloc
cuMemHostAlloc_v2
cuMemHostRegister
cuMemHostRegister_v2
cuMemHostUnregister
cuMemPeerRegister
cuMemPeerUnregister
cuMemPrefetchAsync
cuMemPrefetchAsync_ptsz
cuMemcpy
cuMemcpy2D
cuMemcpy2DAsync
cuMemcpy2DAsync_v2
cuMemcpy2DAsync_v2_ptsz
cuMemcpy2DUnaligned
cuMemcpy2DUnaligned_v2
cuMemcpy2DUnaligned_v2_ptds
cuMemcpy2D_v2
cuMemcpy2D_v2_ptds
cuMemcpy3D
cuMemcpy3DAsync
cuMemcpy3DAsync_v2
cuMemcpy3DAsync_v2_ptsz
cuMemcpy3DPeer
cuMemcpy3DPeerAsync
cuMemcpy3DPeerAsync_ptsz
cuMemcpy3DPeer_ptds
cuMemcpy3D_v2
cuMemcpy3D_v2_ptds
cuMemcpyAsync
cuMemcpyAsync_ptsz
cuMemcpyAtoA
cuMemcpyAtoA_v2
cuMemcpyAtoA_v2_ptds
cuMemcpyAtoD
cuMemcpyAtoD_v2
cuMemcpyAtoD_v2_ptds
cuMemcpyAtoH
cuMemcpyAtoHAsync
cuMemcpyAtoHAsync_v2
cuMemcpyAtoHAsync_v2_ptsz
cuMemcpyAtoH_v2
cuMemcpyAtoH_v2_ptds
cuMemcpyDtoA
cuMemcpyDtoA_v2
cuMemcpyDtoA_v2_ptds
cuMemcpyDtoD
cuMemcpyDtoDAsync
cuMemcpyDtoDAsync_v2
cuMemcpyDtoDAsync_v2_ptsz
cuMemcpyDtoD_v2
cuMemcpyDtoD_v2_ptds
cuMemcpyDtoH
cuMemcpyDtoHAsync
cuMemcpyDtoHAsync_v2
cuMemcpyDtoHAsync_v2_ptsz
cuMemcpyDtoH_v2
cuMemcpyDtoH_v2_ptds
cuMemcpyHtoA
cuMemcpyHtoAAsync
cuMemcpyHtoAAsync_v2
cuMemcpyHtoAAsync_v2_ptsz
cuMemcpyHtoA_v2
cuMemcpyHtoA_v2_ptds
cuMemcpyHtoD
cuMemcpyHtoDAsync
cuMemcpyHtoDAsync_v2
cuMemcpyHtoDAsync_v2_ptsz
cuMemcpyHtoD_v2
cuMemcpyHtoD_v2_ptds
cuMemcpyPeer
cuMemcpyPeerAsync
cuMemcpyPeerAsync_ptsz
cuMemcpyPeer_ptds
cuMemcpy_ptds
cuMemcpy_v2
cuMemsetD16
cuMemsetD16Async
cuMemsetD16Async_ptsz
cuMemsetD16_v2
cuMemsetD16_v2_ptds
cuMemsetD2D16
cuMemsetD2D16Async
cuMemsetD2D16Async_ptsz
cuMemsetD2D16_v2
cuMemsetD2D16_v2_ptds
cuMemsetD2D32
cuMemsetD2D32Async
cuMemsetD2D32Async_ptsz
cuMemsetD2D32_v2
cuMemsetD2D32_v2_ptds
cuMemsetD2D8
cuMemsetD2D8Async
cuMemsetD2D8Async_ptsz
cuMemsetD2D8_v2
cuMemsetD2D8_v2_ptds
cuMemsetD32
cuMemsetD32Async
cuMemsetD32Async_ptsz
cuMemsetD32_v2
cuMemsetD32_v2_ptds
cuMemsetD8
cuMemsetD8Async
cuMemsetD8Async_ptsz
cuMemsetD8_v2
cuMemsetD8_v2_ptds
cuMipmappedArrayCreate
cuMipmappedArrayDestroy
cuModuleLoad
cuModuleLoadData
cuModuleLoadDataEx
cuModuleLoadFatBinary
cuModuleUnload
cuStreamAddCallback
cuStreamAddCallback_ptsz
cuStreamAttachMemAsync
cuStreamAttachMemAsync_ptsz
cuStreamBatchMemOp
cuStreamBatchMemOp_ptsz
cuStreamCreate
cuStreamCreateWithPriority
cuStreamDestroy
cuStreamDestroy_v2
cuStreamSynchronize
cuStreamSynchronize_ptsz
cuStreamWaitEvent
cuStreamWaitEvent_ptsz
cuStreamWaitValue32
cuStreamWaitValue32_ptsz
cuStreamWaitValue64
cuStreamWaitValue64_ptsz
cuStreamWriteValue32
cuStreamWriteValue32_ptsz
cuStreamWriteValue64
cuStreamWriteValue64_ptsz
cuSurfObjectCreate
cuSurfObjectDestroy
cuSurfRefCreate
cuSurfRefDestroy
cuTexObjectCreate
cuTexObjectDestroy
cuTexRefCreate
cuTexRefDestroy
cuVDPAUCtxCreate
cuVDPAUCtxCreate_v2
17.4. cuDNN Function List for X86 CLI
cuDNN API functions
cudnnActivationBackward
cudnnActivationBackward_v3
cudnnActivationBackward_v4
cudnnActivationForward
cudnnActivationForward_v3
cudnnActivationForward_v4
cudnnAddTensor
cudnnBatchNormalizationBackward
cudnnBatchNormalizationBackwardEx
cudnnBatchNormalizationForwardInference
cudnnBatchNormalizationForwardTraining
cudnnBatchNormalizationForwardTrainingEx
cudnnCTCLoss
cudnnConvolutionBackwardBias
cudnnConvolutionBackwardData
cudnnConvolutionBackwardFilter
cudnnConvolutionBiasActivationForward
cudnnConvolutionForward
cudnnCreate
cudnnCreateAlgorithmPerformance
cudnnDestroy
cudnnDestroyAlgorithmPerformance
cudnnDestroyPersistentRNNPlan
cudnnDivisiveNormalizationBackward
cudnnDivisiveNormalizationForward
cudnnDropoutBackward
cudnnDropoutForward
cudnnDropoutGetReserveSpaceSize
cudnnDropoutGetStatesSize
cudnnFindConvolutionBackwardDataAlgorithm
cudnnFindConvolutionBackwardDataAlgorithmEx
cudnnFindConvolutionBackwardFilterAlgorithm
cudnnFindConvolutionBackwardFilterAlgorithmEx
cudnnFindConvolutionForwardAlgorithm
cudnnFindConvolutionForwardAlgorithmEx
cudnnFindRNNBackwardDataAlgorithmEx
cudnnFindRNNBackwardWeightsAlgorithmEx
cudnnFindRNNForwardInferenceAlgorithmEx
cudnnFindRNNForwardTrainingAlgorithmEx
cudnnFusedOpsExecute
cudnnIm2Col
cudnnLRNCrossChannelBackward
cudnnLRNCrossChannelForward
cudnnMakeFusedOpsPlan
cudnnMultiHeadAttnBackwardData
cudnnMultiHeadAttnBackwardWeights
cudnnMultiHeadAttnForward
cudnnOpTensor
cudnnPoolingBackward
cudnnPoolingForward
cudnnRNNBackwardData
cudnnRNNBackwardDataEx
cudnnRNNBackwardWeights
cudnnRNNBackwardWeightsEx
cudnnRNNForwardInference
cudnnRNNForwardInferenceEx
cudnnRNNForwardTraining
cudnnRNNForwardTrainingEx
cudnnReduceTensor
cudnnReorderFilterAndBias
cudnnRestoreAlgorithm
cudnnRestoreDropoutDescriptor
cudnnSaveAlgorithm
cudnnScaleTensor
cudnnSoftmaxBackward
cudnnSoftmaxForward
cudnnSpatialTfGridGeneratorBackward
cudnnSpatialTfGridGeneratorForward
cudnnSpatialTfSamplerBackward
cudnnSpatialTfSamplerForward
cudnnTransformFilter
cudnnTransformTensor
cudnnTransformTensorEx
18. OpenACC Trace
Nsight Systems for Linux x86_64 and Power targets is capable of capturing information about OpenACC execution in the profiled process.
OpenACC versions 2.0, 2.5, and 2.6 are supported when using PGI runtime version 15.7 or later. In order to differentiate constructs (see tooltip below), a PGI runtime of 16.0 or later is required. Note that Nsight Systems does not support the GCC implementation of OpenACC at this time.
Under the CPU rows in the timeline tree, each thread that uses OpenACC will show OpenACC trace information. You can click on a OpenACC API call to see correlation with the underlying CUDA API calls (highlighted in teal):
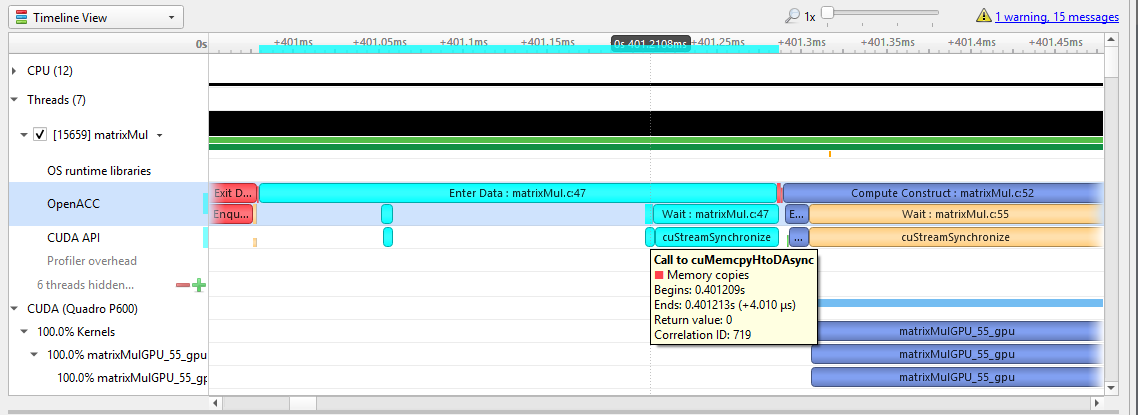
If the OpenACC API results in GPU work, that will also be highlighted:
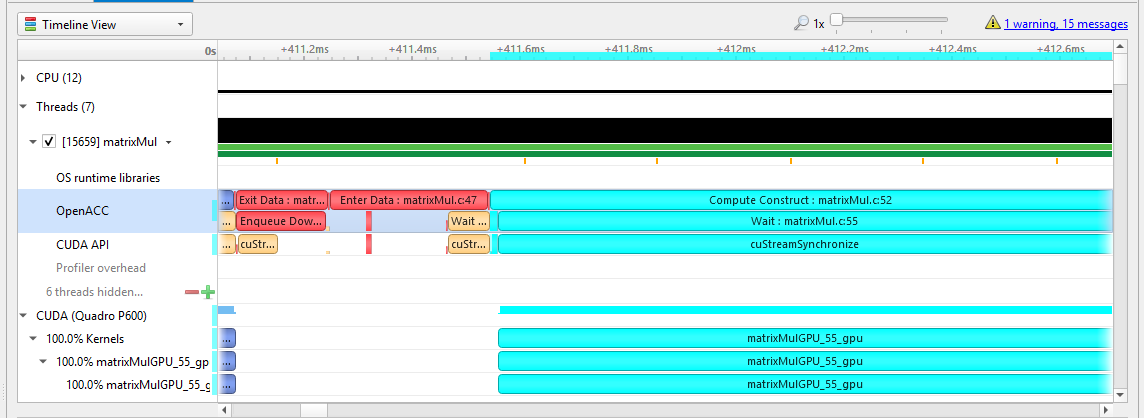
Hovering over a particular OpenACC construct will bring up a tooltip with details about that construct:
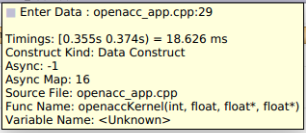
To capture OpenACC information from the Nsight Systems GUI, select the Collect OpenACC trace checkbox under Collect CUDA trace configurations. Note that turning on OpenACC tracing will also turn on CUDA tracing.
Please note that if your application crashes before all collected OpenACC trace data has been copied out, some or all data might be lost and not present in the report.
19. OpenGL Trace
OpenGL and OpenGL ES APIs can be traced to assist in the analysis of CPU and GPU interactions.
A few usage examples are:
-
Visualize how long eglSwapBuffers (or similar) is taking.
-
API trace can easily show correlations between thread state and graphics driver's behavior, uncovering where the CPU may be waiting on the GPU.
-
Spot bubbles of opportunity on the GPU, where more GPU workload could be created.
-
Use KHR_debug extension to trace GL events on both the CPU and GPU.
OpenGL trace feature in Nsight Systems consists of two different activities which will be shown in the CPU rows for those threads
-
CPU trace: interception of API calls that an application does to APIs (such as OpenGL, OpenGL ES, EGL, GLX, WGL, etc.).
-
GPU trace (or workload trace): trace of GPU workload (activity) triggered by use of OpenGL or OpenGL ES. Since draw calls are executed back-to-back, the GPU workload trace ranges include many OpenGL draw calls and operations in order to optimize performance overhead, rather than tracing each individual operation.
To collect GPU trace, the glQueryCounter() function is used to measure how much time batches of GPU workload take to complete.
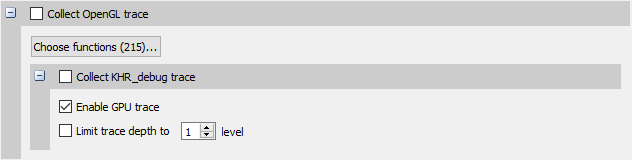
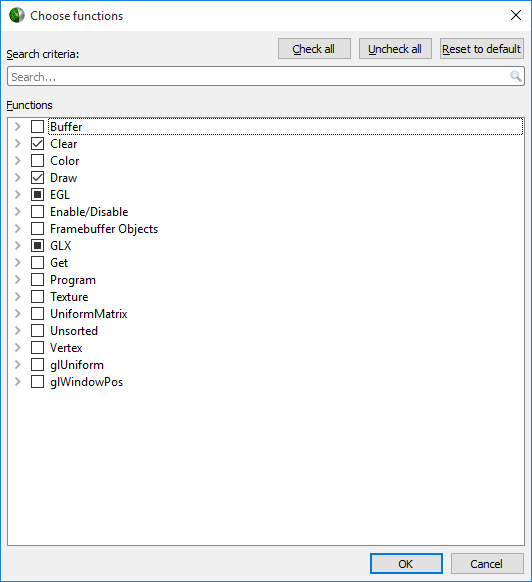
Ranges defined by the KHR_debug calls are represented similarly to OpenGL API and OpenGL GPU workload trace. GPU ranges in this case represent incremental draw cost. They cannot fully account for GPUs that can execute multiple draw calls in parallel. In this case, Nsight Systems will not show overlapping GPU ranges.
19.1. OpenGL Trace Using Command Line
For general information on using the target CLI, see CLI Profiling on Linux. For the CLI, the functions that are traced are set to the following list:
glWaitSync
glReadPixels
glReadnPixelsKHR
glReadnPixelsEXT
glReadnPixelsARB
glReadnPixels
glFlush
glFinishFenceNV
glFinish
glClientWaitSync
glClearTexSubImage
glClearTexImage
glClearStencil
glClearNamedFramebufferuiv
glClearNamedFramebufferiv
glClearNamedFramebufferfv
glClearNamedFramebufferfi
glClearNamedBufferSubDataEXT
glClearNamedBufferSubData
glClearNamedBufferDataEXT
glClearNamedBufferData
glClearIndex
glClearDepthx
glClearDepthf
glClearDepthdNV
glClearDepth
glClearColorx
glClearColorIuiEXT
glClearColorIiEXT
glClearColor
glClearBufferuiv
glClearBufferSubData
glClearBufferiv
glClearBufferfv
glClearBufferfi
glClearBufferData
glClearAccum
glClear
glDispatchComputeIndirect
glDispatchComputeGroupSizeARB
glDispatchCompute
glComputeStreamNV
glNamedFramebufferDrawBuffers
glNamedFramebufferDrawBuffer
glMultiDrawElementsIndirectEXT
glMultiDrawElementsIndirectCountARB
glMultiDrawElementsIndirectBindlessNV
glMultiDrawElementsIndirectBindlessCountNV
glMultiDrawElementsIndirectAMD
glMultiDrawElementsIndirect
glMultiDrawElementsEXT
glMultiDrawElementsBaseVertex
glMultiDrawElements
glMultiDrawArraysIndirectEXT
glMultiDrawArraysIndirectCountARB
glMultiDrawArraysIndirectBindlessNV
glMultiDrawArraysIndirectBindlessCountNV
glMultiDrawArraysIndirectAMD
glMultiDrawArraysIndirect
glMultiDrawArraysEXT
glMultiDrawArrays
glListDrawCommandsStatesClientNV
glFramebufferDrawBuffersEXT
glFramebufferDrawBufferEXT
glDrawTransformFeedbackStreamInstanced
glDrawTransformFeedbackStream
glDrawTransformFeedbackNV
glDrawTransformFeedbackInstancedEXT
glDrawTransformFeedbackInstanced
glDrawTransformFeedbackEXT
glDrawTransformFeedback
glDrawTexxvOES
glDrawTexxOES
glDrawTextureNV
glDrawTexsvOES
glDrawTexsOES
glDrawTexivOES
glDrawTexiOES
glDrawTexfvOES
glDrawTexfOES
glDrawRangeElementsEXT
glDrawRangeElementsBaseVertexOES
glDrawRangeElementsBaseVertexEXT
glDrawRangeElementsBaseVertex
glDrawRangeElements
glDrawPixels
glDrawElementsInstancedNV
glDrawElementsInstancedEXT
glDrawElementsInstancedBaseVertexOES
glDrawElementsInstancedBaseVertexEXT
glDrawElementsInstancedBaseVertexBaseInstanceEXT
glDrawElementsInstancedBaseVertexBaseInstance
glDrawElementsInstancedBaseVertex
glDrawElementsInstancedBaseInstanceEXT
glDrawElementsInstancedBaseInstance
glDrawElementsInstancedARB
glDrawElementsInstanced
glDrawElementsIndirect
glDrawElementsBaseVertexOES
glDrawElementsBaseVertexEXT
glDrawElementsBaseVertex
glDrawElements
glDrawCommandsStatesNV
glDrawCommandsStatesAddressNV
glDrawCommandsNV
glDrawCommandsAddressNV
glDrawBuffersNV
glDrawBuffersATI
glDrawBuffersARB
glDrawBuffers
glDrawBuffer
glDrawArraysInstancedNV
glDrawArraysInstancedEXT
glDrawArraysInstancedBaseInstanceEXT
glDrawArraysInstancedBaseInstance
glDrawArraysInstancedARB
glDrawArraysInstanced
glDrawArraysIndirect
glDrawArraysEXT
glDrawArrays
eglSwapBuffersWithDamageKHR
eglSwapBuffers
glXSwapBuffers
glXQueryDrawable
glXGetCurrentReadDrawable
glXGetCurrentDrawable
glGetQueryObjectuivEXT
glGetQueryObjectuivARB
glGetQueryObjectuiv
glGetQueryObjectivARB
glGetQueryObjectiv
20. Custom ETW Trace
Use the custom ETW trace feature to enable and collect any manifest-based ETW log. The collected events are displayed on the timeline on dedicated rows for each event type.
Custom ETW is available on Windows target machines.
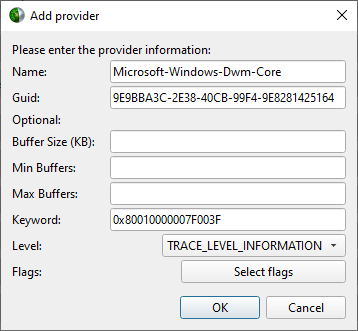
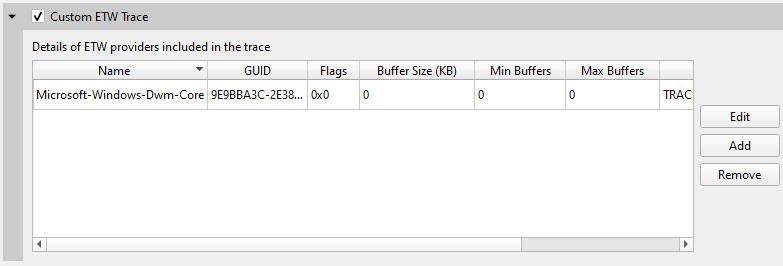
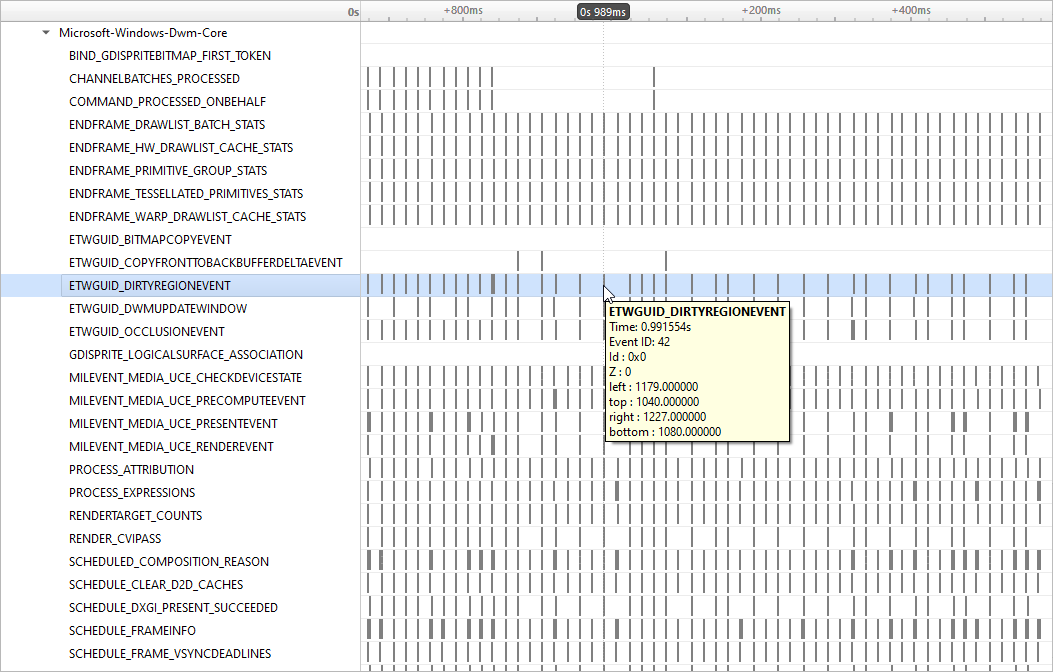
21. Debug Versions of ELF Files
Often, after a binary is built, especially if it is built with debug information (-g compiler flag), it gets stripped before deploying or installing. In this case, ELF sections that contain useful information, such as non-export function names or unwind information, can get stripped as well.
One solution is to deploy or install the original unstripped library instead of the stripped one, but in many cases this would be inconvenient. Nsight Systems can use missing information from alternative locations.
For target devices with Ubuntu, see Debug Symbol Packages. These packages typically install debug ELF files with /usr/lib/debug prefix. Nsight Systems can find debug libraries there, and if it matches the original library (e.g., the built-in BuildID is the same), it will be picked up and used to provide symbol names and unwind information.
Many packages have debug companions in the same repository and can be directly installed with APT (apt-get). Look for packages with the -dbg suffix. For other packages, refer to the Debug Symbol Packages wiki page on how to add the debs package repository. After setting up the repository and running apt-get update, look for packages with -dbgsym suffix.
To verify that a debug version of a library has been picked up and downloaded from the target device, look in the Module Summary section of Analysis Summary:
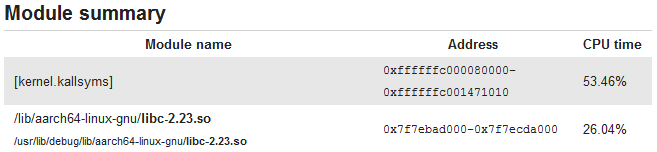
22. Reading Your Report in GUI
22.1. Generating a New Report
Users can generate a new report by stopping a profiling session. If a profiling session has been canceled, a report will not be generated, and all collected data will be discarded.
A new .qdrep file will be created and put into the same directory as the project file (.qdproj).
22.3. Sharing a Report File
Report files (.qdrep) are self-contained and can be shared with other users of Nsight Systems. The only requirement is that the same or newer version of Nsight Systems is always used to open report files.
Project files (.qdproj) are currently not shareable, since they contain full paths to the report files.
To quickly navigate to the directory containing the report file, right click on it in the Project Explorer, and choose Show in folder... in the context menu.
22.4. Report Tab
While generating a new report or loading an existing one, a new tab will be created. The most important parts of the report tab are:
-
View selector — Allows switching between Analysis Summary, Timeline View, Diagnostics Summary, and Symbol Resolution Logs views.
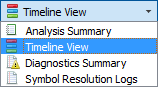
-
Timeline — This is where all charts are displayed.
-
Function table — Located below the timeline, it displays statistical information about functions in the target application in multiple ways.
Additionally, the following controls are available:
-
Zoom slider — Allows you to vertically zoom the charts on the timeline.
22.5. Analysis Summary View
This view shows a summary of the profiling session. In particular, it is useful to review the project configuration used to generate this report. Information from this view can be selected and copied using the mouse cursor.
22.6. Timeline View
The timeline view consists of two main controls: the timeline at the top, and a bottom pane that contains the events view and the function table. In some cases, when sampling of a process has not been enabled, the function table might be empty and hidden.
The bottom view selector sets the view that is displayed in the bottom pane.
22.6.1. Timeline
Timeline is a versatile control that contains a tree-like hierarchy on the left, and corresponding charts on the right.
Contents of the hierarchy depend on the project settings used to collect the report. For example, if a certain feature has not been enabled, corresponding rows will not be show on the timeline.
To display trace events in the Events View right-click a timeline row and select the “Show in Events View” command. The events of the selected row and all of its sub-rows will be displayed in the Events View.
If a timeline row has been selected for display in the Events View then double-clicking a timeline item on that row will automatically scroll the content of the Events View to make the corresponding Events View item visible and select it.
22.6.2. Events View
The Events View provides a tabular display of the trace events. The view contents can be searched and sorted.
Double-clicking an item in the Events View automatically focuses the Timeline View on the corresponding timeline item.
API calls, GPU executions, and debug markers that occurred within the boundaries of a debug marker are displayed nested to that debug marker. Multiple levels of nesting are supported.
Events view recognizes these types of debug markers:
-
NVTX
-
Vulkan VK_EXT_debug_marker markers, VK_EXT_debug_utils labels
-
PIX events and markers
-
OpenGL KHR_debug markers
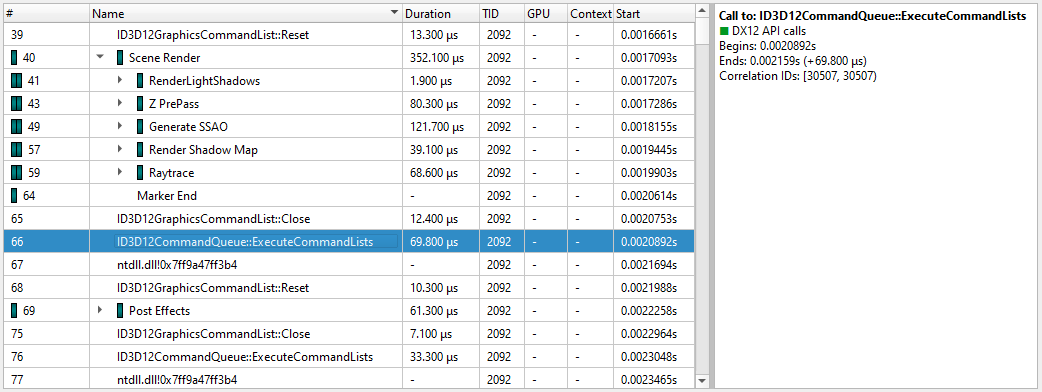
22.6.3. Function Table Modes
The function table can work in three modes:
-
Top-Down View — In this mode, expanding top-level functions provides information about the callee functions. One of the top-level functions is typically the main function of your application, or another entry point defined by the runtime libraries.
-
Bottom-Up View — This is a reverse of the Top-Down view. On the top level, there are functions directly hit by the sampling profiler. To explore all possible call chains leading to these functions, you need to expand the subtrees of the top-level functions.
-
Flat View — This view enumerates all functions ever observed by the profiler, even if they have never been directly hit, but just appeared somewhere on the call stack. This view typically provides a high-level overview of which parts of the code are CPU-intensive.
Each of the views helps understand particular performance issues of the application being profiled. For example:
-
When trying to find specific bottleneck functions that can be optimized, the Bottom-Up view should be used. Typically, the top few functions should be examined. Expand them to understand in which contexts they are being used.
-
To navigate the call tree of the application and while generally searching for algorithms and parts of the code that consume unexpectedly large amount of CPU time, the Top-Down view should be used.
-
To quickly assess which parts of the application, or high level parts of an algorithm, consume significant amount of CPU time, use the Flat view.
The Top-Down and Bottom-Up views have Self and Total columns, while the Flat view has a Flat column. It is important to understand the meaning of each of the columns:
-
Top-Down view
-
Self column denotes the relative amount of time spent executing instructions of this particular function.
-
Total column shows how much time has been spent executing this function, including all other functions called from this one. Total values of sibling rows sum up to the Total value of the parent row, or 100% for the top-level rows.
-
-
Bottom-Up view
-
Self column for top-level rows, as in the Top-Down view, shows how much time has been spent directly in this function. Self times of all top-level rows add up to 100%.
-
Self column for children rows breaks down the value of the parent row based on the various call chains leading to that function. Self times of sibling rows add up to the value of the parent row.
-
-
Flat view
-
Flat column shows how much time this function has been anywhere on the call stack. Values in this column do not add up or have other significant relationships.
Note:
If low-impact functions have been filtered out, values may not add up correctly to 100%, or to the value of the parent row. This filtering can be disabled.
Contents of the symbols table is tightly related to the timeline. Users can apply and modify filters on the timeline, and they will affect which information is displayed in the symbols table:
-
-
Per-thread filtering — Each thread that has sampling information associated with it has a checkbox next to it on the timeline. Only threads with selected checkboxes are represented in the symbols table.
-
Time filtering — A time filter can be setup on the timeline by pressing the left mouse button, dragging over a region of interest on the timeline, and then choosing Filter by selection in the dropdown menu. In this case, only sampling information collected during the selected time range will be used to build the symbols table.
Note:
If too little sampling data is being used to build the symbols table (for example, when the sampling rate is configured to be low, and a short period of time is used for time-based filtering), the numbers in the symbols table might not be representative or accurate in some cases.
22.6.4. Filter Dialog
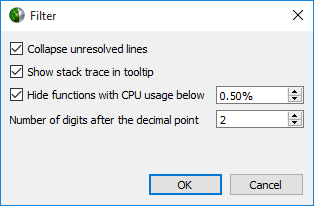
- Collapse unresolved lines is useful if some of the binary code does not have symbols. In this case, subtrees that consist of only unresolved symbols get collapsed in the Top-Down view, since they provide very little useful information.
- Hide functions with CPU usage below X% is useful for large applications, where the sampling profiler hits lots of function just a few times. To filter out the "long tail," which is typically not important for CPU performance bottleneck analysis, this checkbox should be selected.
22.7. Diagnostics Summary View
This view shows important messages. Some of them were generated during the profiling session, while some were added while processing and analyzing data in the report. Messages can be one of the following types:
-
Informational messages
-
Warnings
-
Errors
To draw attention to important diagnostics messages, a summary line is displayed on the timeline view in the top right corner:
Information from this view can be selected and copied using the mouse cursor.
22.8. Symbol Resolution Logs View
This view shows all messages related to the process of resolving symbols. It might be useful to debug issues when some of the symbol names in the symbols table of the timeline view are unresolved.
23. Broken Backtraces on Tegra
In Nsight Systems Embedded Platforms Edition, in the symbols table there is a special entry called Broken backtraces. This entry is used to denote the point in the call chain where the unwinding algorithms used by Nsight Systems could not determine what is the next (caller) function.
Broken backtraces happen because there is no information related to the current function that the unwinding algorithms can use. In the Top-Down view, these functions are immediate children of the Broken backtraces row.
One can eliminate broken backtraces by modifying the build system to provide at least one kind of unwind information. The types of unwind information, used by the algorithms in Nsight Systems, include the following:
For ARMv7 binaries:
-
DWARF information in ELF sections: .debug_frame, .zdebug_frame, .eh_frame, .eh_frame_hdr. This information is the most precise. .zdebug_frame is a compressed version of .debug_frame, so at most one of them is typically present. .eh_frame_hdr is a companion section for .eh_frame and might be absent.
Compiler flag: -g.
-
Exception handling information in EHABI format provided in .ARM.exidx and .ARM.extab ELF sections. .ARM.extab might be absent if all information is compact enough to be encoded into .ARM.exidx.
Compiler flag: -funwind-tables.
-
Frame pointers (built into the .text section).
Compiler flag: -fno-omit-frame-pointer.
For Aarch64 binaries:
-
DWARF information in ELF sections: .debug_frame, .zdebug_frame, .eh_frame, .eh_frame_hdr. See additional comments above.
Compiler flag: -g.
-
Frame pointers (built into the .text section).
Compiler flag: -fno-omit-frame-pointer.
The following ELF sections should be considered empty if they have size of 4 bytes: .debug_frame, .eh_frame, .ARM.exidx. In this case, these sections only contain termination records and no useful information.
For GCC, use the following compiler invocation to see which compiler flags are enabled in your toolchain by default (for example, to check if -funwind-tables is enabled by default):
$ gcc -Q --help=common
For GCC and Clang, add -### to the compiler invocation command to see which compiler flags are actually being used.
Since EHABI and DWARF information is compiled on per-unit basis (every .cpp or .c file, as well as every static library, can be built with or without this information), presence of the ELF sections does not guarantee that every function has necessary unwind information.
Frame pointers are required by the Aarch64 Procedure Call Standard. Adding frame pointers slows down execution time, but in most cases the difference is negligible.
24. Launch Processes in Stopped State
In many cases, it is important to profile an application from the very beginning of its execution. When launching processes, Nsight Systems takes care of it by making sure that the profiling session is fully initialized before making the exec() system call on Linux, and by using the JDWP protocol on Android.
If the process launch capabilities of Nsight Systems are not sufficient, the application should be launched manually, and the profiler should be configured to attach to the already launched process. One approach would be to call sleep() somewhere early in the application code, which would provide time for the user to attach to the process in Nsight Systems Embedded Platforms Edition, but there are two other more convenient mechanisms that can be used on Linux, without the need to recompile the application. (Note that the rest of this section is only applicable to Linux-based target devices, not Windows or Android.)
Both mechanisms ensure that between the time the process is created (and therefore its PID is known) and the time any of the application's code is called, the process is stopped and waits for a signal to be delivered before continuing.
24.1. LD_PRELOAD
The first mechanism uses LD_PRELOAD environment variable. It only works with dynamically linked binaries, since static binaries do not invoke the runtime linker, and therefore are not affected by the LD_PRELOAD environment variable.
-
For ARMv7 binaries, preload
/opt/nvidia/nsight_systems/libLauncher32.so
-
Otherwise if running from host, preload
/opt/nvidia/nsight_systems/libLauncher64.so
-
Otherwise if running from CLI, preload
[installation_directory]/libLauncher64.so
The most common way to do that is to specify the environment variable as part of the process launch command, for example:
$ LD_PRELOAD=/opt/nvidia/nsight_systems/libLauncher64.so ./my-aarch64-binary --arguments
When loaded, this library will send itself a SIGSTOP signal, which is equivalent to typing Ctrl+Z in the terminal. The process is now a background job, and you can use standard commands like jobs, fg and bg to control them. Use jobs -l to see the PID of the launched process.
When attaching to a stopped process, Nsight Systems will send SIGCONT signal, which is equivalent to using the bg command.
24.2. Launcher
The second mechanism can be used with any binary. Use [installation_directory]/launcher to launch your application, for example:
$ /opt/nvidia/nsight_systems/launcher ./my-binary --arguments
The process will be launched, daemonized, and wait for SIGUSR1 signal. After attaching to the process with Nsight Systems, the user needs to manually resume execution of the process from command line:
$ pkill -USR1 launcher
|
Note: |
Note that pkill will send the signal to any process with the matching name. If that is not desirable, use kill to send it to a specific process. The standard output and error streams are redirected to /tmp/stdout_<PID>.txt and /tmp/stderr_<PID>.txt. |
The launcher mechanism is more complex and less automated than the LD_PRELOAD option, but gives more control to the user.
25. Import NVTXT
ImportNvtxt is an utility which allows conversion of a NVTXT file to a Nsight Systems report file (*.qdrep) or to merge it with an existing report file.
Note: NvtxtImport supports custom TimeBase values. Only these values are supported:
-
Manual — timestamps are set using absolute values.
-
Relative — timestamps are set using relative values with regards to report file which is being merged with nvtxt file.
-
ClockMonotonicRaw — timestamps values in nvtxt file are considered to be gathered on the same target as the report file which is to be merged with nvtxt using clock_gettime(CLOCK_MONOTONIC_RAW, ...) call.
-
CNTVCT — timestamps values in nvtxt file are considered to be gathered on the same target as the report file which is to be merged with nvtxt using CNTVCT values.
You can get usage info via help message:
Print help message:
-h [ --help ]
Show information about report file:
--cmd info -i [--input] arg
Create report file from existing nvtxt file:
--cmd create -n [--nvtxt] arg -o [--output] arg [-m [--mode] mode_name mode_args] [--target <Hw:Vm>] [--update_report_time]
Merge nvtxt file to existing report file:
--cmd merge -i [--input] arg -n [--nvtxt] arg -o [--output] arg [-m [--mode] mode_name mode_args] [--target <Hw:Vm>] [--update_report_time]
-
lerp - Insert with linear interpolation
--mode lerp --ns_a arg --ns_b arg [--nvtxt_a arg --nvtxt_b arg]
-
lin - insert with linear equation
--mode lin --ns_a arg --freq arg [--nvtxt_a arg]
-
ns_a - a nanoseconds value
-
ns_b - a nanoseconds value (greater than ns_a)
-
nvtxt_a - an nvtxt file's time unit value corresponding to ns_a nanoseconds
-
nvtxt_b - an nvtxt file's time unit value corresponding to ns_b nanoseconds
-
freq - the nvtxt file's timer frequency
-
--target <Hw:Vm> - specify target id, e.g. --target 0:1
-
--update_report_time - prolong report's profiling session time while merging if needed. Without this option all events outside the profiling session time window will be skipped during merging.
Commands
Info
To find out report's start and end time use info command.
Usage:
ImportNvtxt --cmd info -i [--input] arg
Example:
ImportNvtxt info Report.qdrep
Analysis start (ns)	83501026500000
Analysis end (ns)	83506375000000
Create
You can create a report file using existing NVTXT with create command.
Usage:
ImportNvtxt --cmd create -n [--nvtxt] arg -o [--output] arg [-m [--mode] mode_name mode_args]
-
lerp — insert with linear interpolation.
-
lin — insert with linear equation.
Usage for lerp mode is:
--mode lerp --ns_a arg --ns_b arg [--nvtxt_a arg --nvtxt_b arg]
-
ns_a — a nanoseconds value.
-
ns_b — a nanoseconds value (greater than ns_a).
-
nvtxt_a — an nvtxt file's time unit value corresponding to ns_a nanoseconds.
-
nvtxt_b — an nvtxt file's time unit value corresponding to ns_b nanoseconds.
If nvtxt_a and nvtxt_b are not specified, they are repectively set to nvtxt file's minimum and maximum time value.
Usage for lin mode is:
--mode lin --ns_a arg --freq arg [--nvtxt_a arg]
-
ns_a — a nanoseconds value.
-
freq — the nvtxt file's timer frequency.
-
nvtxt_a — an nvtxt file's time unit value corresponding to ns_a nanoseconds.
If nvtxt_a is not specified, it is set to nvtxt file's minimum time value.
Examples:
ImportNvtxt --cmd create -n Sample.nvtxt -o Report.qdrep
The output will be a new generated report file which can be opened and viewed by Nsight Systems.
Merge
To merge NVTXT file with an existing report file use merge command.
Usage:
ImportNvtxt --cmd merge -i [--input] arg -n [--nvtxt] arg -o [--output] arg [-m [--mode] mode_name mode_args]
-
lerp — insert with linear interpolation.
-
lin — insert with linear equation.
Usage for lerp mode is:
--mode lerp --ns_a arg --ns_b arg [--nvtxt_a arg --nvtxt_b arg]
-
ns_a — a nanoseconds value.
-
ns_b — a nanoseconds value (greater than ns_a).
-
nvtxt_a — an nvtxt file's time unit value corresponding to ns_a nanoseconds.
-
nvtxt_b — an nvtxt file's time unit value corresponding to ns_b nanoseconds.
If nvtxt_a and nvtxt_b are not specified, they are repectively set to nvtxt file's minimum and maximum time value.
Usage for lin mode is:
--mode lin --ns_a arg --freq arg [--nvtxt_a arg]
-
ns_a — a nanoseconds value.
-
freq — the nvtxt file's timer frequency.
-
nvtxt_a — an nvtxt file's time unit value corresponding to ns_a nanoseconds.
If nvtxt_a is not specified, it is set to nvtxt file's minimum time value.
Time values in <filename.nvtxt> are assumed to be nanoseconds if no mode specified.
Example
ImportNvtxt --cmd merge -i Report.qdrep -n Sample.nvtxt -o NewReport.qdrep
Visual Studio Integration
NVIDIA Nsight Integration is a Visual Studio extension that allows you to access the power of Nsight Systems from within Visual Studio.
When Nsight Systems is installed along with NVIDIA Nsight Integration, Nsight Systems activities will appear under the NVIDIA Nsight menu in the Visual Studio menu bar. These activities launch Nsight Systems with the current project settings and executable.
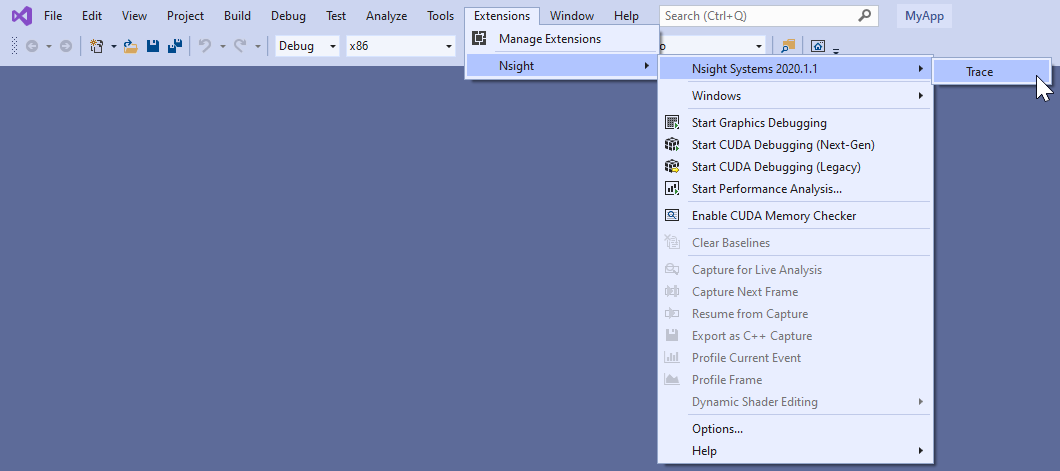
-
Target application path
-
Command line parameters
-
Working folder
If the "Trace" command has already been used with this Visual Studio project then Nsight Systems will load the respective Nsight Systems project and any previously captured trace sessions will be available for review using the Nsight Systems project explorer tree.
27. Troubleshooting
- Close the host application.
- Restart the target device.
- Start the host application and connect to the target device.
To enable logging on the host, refer to this config file:
host-linux-x64/nvlog.config.template
When reporting any bugs please include the build version number as described in the Help → About dialog. If possible, attach log files and report (.qdrep) files, as they already contain necessary version information.
Nsight Systems uses a settings file (NVIDIA Nsight Systems.ini) on the host to store information about loaded projects, report files, window layout configuration, etc. Location of the settings file is described in the Help → About dialog. Deleting the settings file will restore Nsight Systems to a fresh state, but all projects and reports will disappear from the Project Explorer.
GUI Troubleshooting
If opening the Nsight Systems Linux GUI fails with the following error, you may be missing some required libraries:
This application failed to start because it could not find or load the Qt platform plugin "xcb" in "". Available platform plugins are: xcb. Reinstalling the application may fix this problem.
Launch Nsight Systems using the following command line to determine which libraries are missing and install them.
$ QT_DEBUG_PLUGINS=1 ./nsys-ui
If the workload does not run when launched via Nsight Systems or the timeline is empty, check the stderr.log and stdout.log (click on drop-down menu showing Timeline View and click on Files) to see the errors encountered by the app.
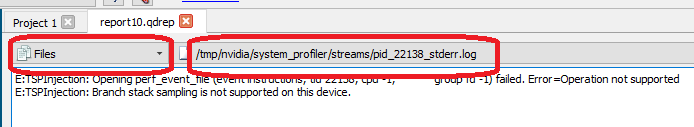
Android Targets
When connecting to an Android-based device, Nsight Systems installs its executable and library files into the following directory:
/data/local/tmp/com.nvidia.nsightsystems.tools/
Logs on the target device are collected into this file:
/data/local/tmp/com.nvidia.nsightsystems.tools/nsys.log
-
Close the host application.
-
Place nvlog.config from host directory to /sdcard/ directory on target.
-
Restart the target device.
-
From ADB shell, launch the following command:
/data/local/tmp/com.nvidia.nsightsystems.tools/nsys --daemon --debug
On rooted Android devices, the command above should be started from superuser (e.g., adb shell su -c ...).
-
Start the host application and connect to the target device.
Please note that in some cases, debug logging can significantly slow down the profiler
Symbol Resolution
If stack trace information is missing symbols and you have a symbol file, you can manually re-resolve using the ResolveSymbols utility. You will find this utility in the [installation_path]\Host directory. This utility works with ELF format files or files where each line is in the format <start><length><name>.
| Short | Long | Argument | Description |
|---|---|---|---|
| -h | --help | Help message providing information about available options. | |
| -l | --process-list | Print global process IDs list | |
| -s | --sym-file | filename | Path to symbol file |
| -b | --base-addr | address | If set then <start> in symbol file is treated as relative address starting from this base address |
| -p | --global-pid | pid | Which process in the report should be resolved. May be omitted if there is only one process in the report. |
| -f | --force | This option forces use of a given symbol file. | |
| -i | --report | filename | Path to the report with unresolved symbols. |
| -o | --output | filename | Path and name of the output file. If it is omitted then "resolved" suffix is added to the original filename. |
Verbose Logging on Linux Targets
Verbose logging is available when connecting to a Linux-based device from the GUI on the host. This extra debug information is not available when launching via the command line. Nsight Systems installs its executable and library files into the following directory:
/opt/nvidia/nsight_systems/
-
Close the host application.
-
Restart the target device.
-
Place nvlog.config from host directory to the /opt/nvidia/nsight_systems directory on target.
-
From SSH console, launch the following command:
sudo /opt/nvidia/nsight_systems/nsys --daemon --debug
-
Start the host application and connect to the target device.
Logs on the target devices are collected into this file (if enabled):
nsys.log
in the directory where nsys command was launched.
Please note that in some cases, debug logging can significantly slow down the profiler.
Verbose Logging on Windows Targets
Verbose logging is available when connecting to a Windows-based device from the GUI on the host. Nsight Systems installs its executable and library files into the following directory by default:
C:\Program Files\NVIDIA Corporation\Nsight Systems 2020.3
-
Close the host application.
-
Terminate the nsys process.
-
Place nvlog.config from host directory next to Nsight Systems Windows agent on the target device
-
Local Windows target:
C:\Program Files\NVIDIA Corporation\Nsight Systems 2020.3\target-windows-x64
-
Remote Windows target:
C:\Users\<user name>\AppData\Local\Temp\nvidia\nsight_systems
-
-
Start the host application and connect to the target device.
Logs on the target devices are collected into this file (if enabled):
nsight-sys.log
in the same directory as Nsight Systems Windows agent.
Please note that in some cases debug logging can significantly slow down the profiler.
QNX Troubleshooting
-
Make sure that tracelogger utility is available and can be run on the target.
-
Make sure that /tmp directory is accessible and supports sub-directories.
-
When switching between Nsight Systems versions, processes related to the previous version, including profiled applications forked by the daemon, must be killed before the new version is used. If you experience issues after switching between Nsight Systems versions, try rebooting the target.
Other Resources
Looking for information to help you use Nsight Systems the most effectively? Here are some more resources you might want to review:
Feature Videos
Short videos, only a minute or two, to introduce new features.
- 2019.3.6 release video - Statistics Driven Profiling
Blog Posts
NVIDIA developer blogs, these are longer form, technical pieces written by tool and domain experts.
Conference Presentations
- GTC 2019 - Using Nsight Tools to Optimize the NAMD Molecular Dynamics Simulation Program
- GTC 2019 - Optimizing Facebook AI Workloads for NVIDIA GPUs
- GTC 2018 - Optimizing HPC Simulation and Visualization Codes Using NVIDIA Nsight Systems
- GTC 2018 - Israel - Boost DNN Training Performance using NVIDIA Tools
- Siggraph 2018 - Taming the Beast; Using NVIDIA Tools to Unlock Hidden GPU Performance
For More Support
To file a bug report or to ask a question on the Nsight Systems forums, you will need to register with the NVIDIA Developer Program. See the FAQ. You do not need to register to read the forums.
After that, you can access Nsight Systems Forums and the NVIDIA Bug Tracking System.
To submit feedback directly from the GUI, go to Help->Send Feedback and fill out the form. Enter your email address if you would like to hear back from the Nsight Systems team.
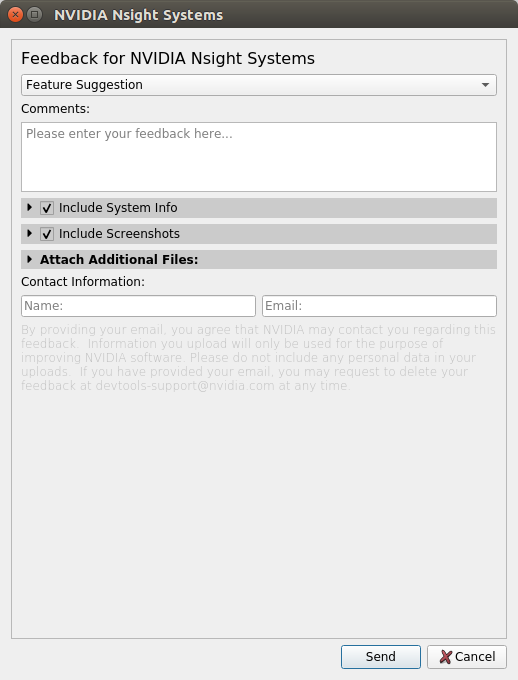
NDA Documents
29.1. NDA - Profiling NVIDIA DRIVE
Analysis on DRIVE devices is similar analysis described elsewhere in this document. The major differences on these platforms are listed below:
DRIVE Platforms Supported
NVIDIA DRIVE(with Linux or QNX) supports the following packages
- DRIVE CX 2 (P2382)
- DRIVE PX 2 (P2379 — AutoChauffeur, P3407 — AutoCruise)
- DRIVE AGX Developer Kit (E3550\_B00 Parker, E3550\_B01 Xavier)
GPU Process Trace
GPU process trace, also known as GPU context switch trace, is a trace of a set of events the GPU will emit asynchronously as it switches contexts. This in turn allows visualization of workload emitted by multiple CPU processes as it is being executed on the GPU.

Memory Bandwidth Sampling
On compatible devices, memory bandwidth utilization can be sampled, as reported by Memory Controller (MC) and External Memory Controller (EMC). Multiple counters can be sampled simultaneously. The number of available counters depends on the generation of Tegra; for example, Tegra K1 only provides 2 counters, Tegra X1 provides 4, Parker provides 8, and future generations can have 8 or more available counters.
Note: on Parker, MC is typically disabled, and only EMC is available. This means that only overall memory bandwidth consumption can be sampled, without per-client breakdown.
Memory bandwidth settings only appear on the project configuration tab when a compatible device is connected and successfully validated (Device is ready text is displayed).
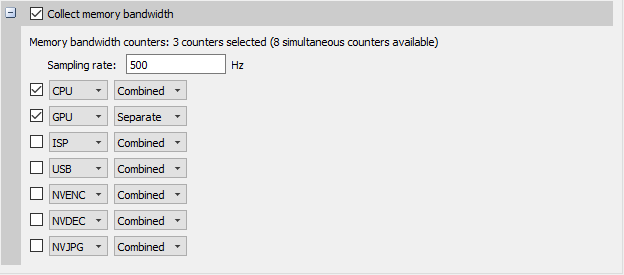
To enable this feature, select the Collect memory bandwidth checkbox. Specify the desired sampling rate, and choose which counters to sample. The following memory bandwidth client are supported:
- CPU
- GPU
- ISP (Tegra Image Signal Processor)
- USB
- NVENC (hardware video encoding unit)
- NVDEC (hardware video decoding unit)
- NVJPG (hardware JPEG encoding and decoding unit)
Information about each client can be collected in 4 ways
- Read — only read traffic (uses 1 counter)
- Write — only write traffic (uses 1 counter)
- Combined — all traffic, read and write simultaneously (uses 1 counter)
- Separate — read and write traffic separately (uses 2 counters)
Hypervisor Trace
With Nsight Systems it is possible to trace how the virtualization software stack works.
-
Flash your DRIVE devkit with a hypervisor (option -H for
bootburn.sh). (When using DriveInstall, this happens by
default.)
Please note that not all virtual configurations support tracing events from the hypervisor. linux and linux-linux are known to work.
At least one of the guest machines needs to be Linux, and there should be mempools (shared memory) mappings between event providers and this Linux guest VM.
-
Enable hypervisor trace events using the hypervisor console. Please refer
to the PDK documentation for further details. The following tracing
switches should be enabled:
- Scheduling events (S).
- IRQ events (I).
- Hypervisor trapping (R).
Please note, that these switches must be re-enabled after each board reboot.
-
In Nsight Systems, select Collect HV trace checkbox.
Next, specify the location of the pct.json file corresponding to the used virtual configuration.
- Run a profiling session as usual.
- In the resulting report, expand the Cross-hypervisor trace row to see the events. Detailed information is available in tooltips.
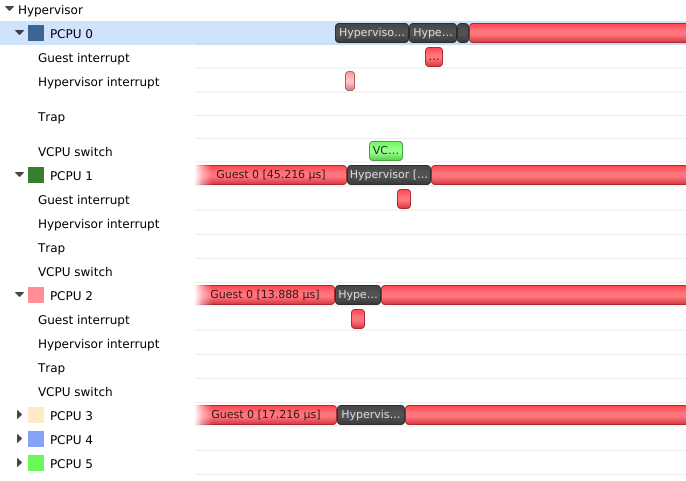
Note: CPU cores use different numbering inside guest VMs and in the hypervisor trace rows:
- Hypervisor trace uses physical core numbers.
- Guest VMs uses virtual core numbers, which might not map directly to the physical core numbers. On Linux guests, it is customary that the first CPU core number is always 0.
- Mapping between guest VM CPUs (virtual CPUs) and physical CPUs can be obtained from the guest VM CPU timeline. For each virtual CPU corresponding physical CPU is indicated by line the at the bottom of the virtual CPU row.
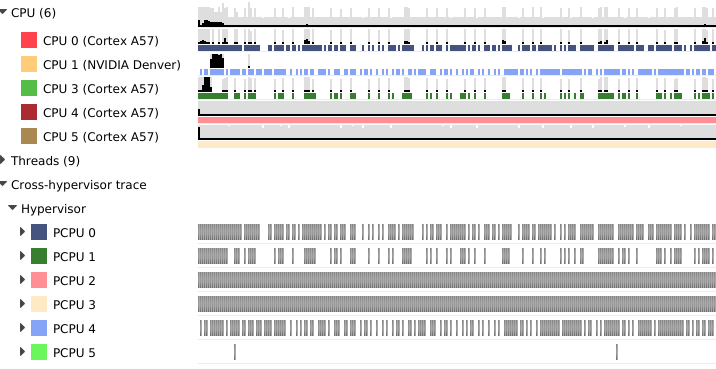
GPU Process Trace
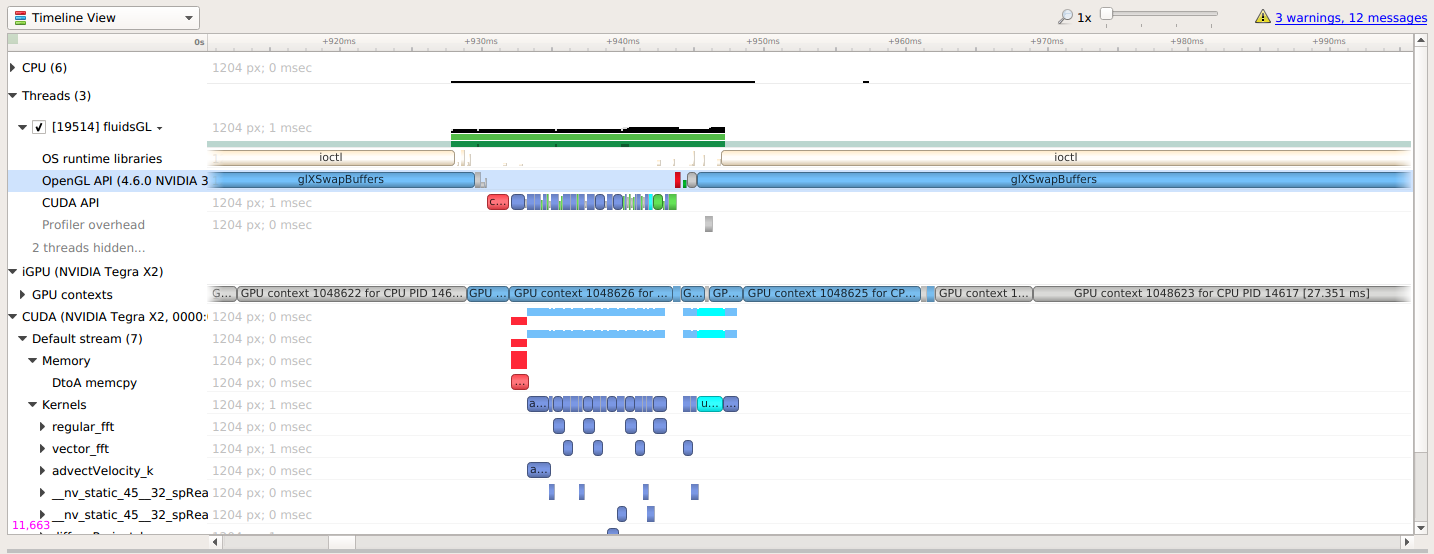
The image above shows a GPU node in the timeline's row tree on the left. Under the GPU node, you can see the master context switch trace and CUDA trace. The process trace row provides an overview of the GPU's context switching.
Gray ranges are contexts not related to the process being profiled, so that users may be able to distinguish between idle and time sharing with other contexts. This row is typically enough to let a user investigate if something is taking too long on the GPU, because of GPU context switching during a particular CUDA kernel or OpenGL workload batch.
If the Process Trace node is opened further, additional details appear. A Context Switch Request row shows the key events triggering a context save, if the context cannot finish its work within a short period of time. Following this is a row for each process or thread ID. For each thread, users can see the individual ranges for context restore (orange), work time (green), and context save (yellow). Other process IDs not being profiled will continue to appear as gray.
A second appearance of the thread ID related data will appear as a row under the thread itself, to improve locality to OpenGL GPU workload batch traces, so users may also be able to see when OpenGL workload batch processing may be interrupted by a GPU context switch, and extend its processing time.
Memory Bandwidth
If the report contains information about memory bandwidth consumption, it will appear on the timeline as separate rows:
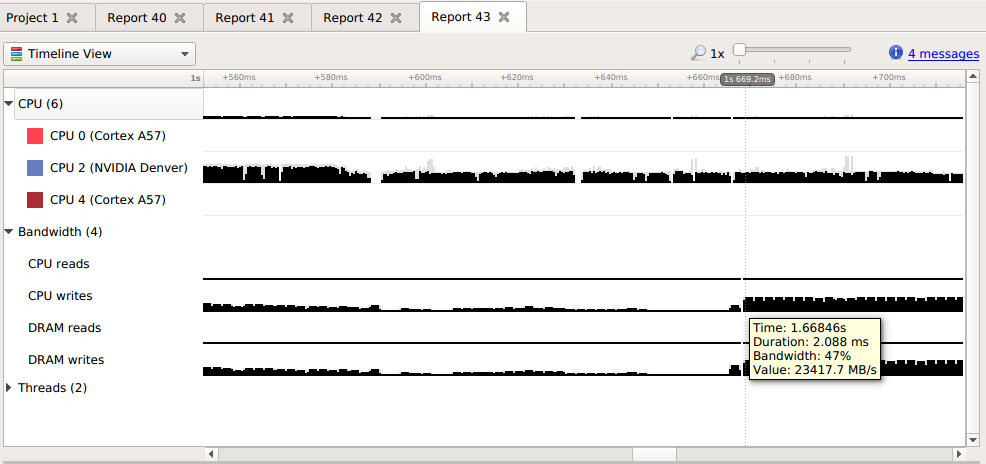
Charts on the timeline are scaled based on the theoretic maximum memory bandwidth available on the Tegra device that is used to collect the data.
To see how much data has been transferred over a period of time, click and drag the left mouse button on a corresponding row in the timeline.