Benchmark Planner Decisions with DynoSim

Compare topology and scaling decisions against a saved trace
View as Markdown

This tutorial runs the Dynamo Planner inside DynoSim so you can compare aggregated and disaggregated topologies, tune SLA targets, and test sensitivity to worker startup time without a live cluster.

The production Planner scales Kubernetes or Global Planner deployments; it does not autoscale a local CLI deployment. Although python -m dynamo.replay executes on your local machine, this tutorial evaluates Planner decisions for a Kubernetes deployment through the virtual simulation environment.

For the general replay workflow, see Run a DynoSim Simulation. For Planner field types and defaults, see the Planner Configuration reference. For how the simulation supplies metrics to the Planner, see DynoSim Architecture.

Prerequisites

Build the Rust runtime bindings and install the Python components from the repository root. Activate the project virtual environment so the remaining commands use its python executable:

$source .venv/bin/activate
$maturin develop --release -m lib/bindings/python/Cargo.toml
$uv pip install -e .

Use a release build because repeated simulation runs are CPU-bound.

The commands below use AIConfigurator-backed engine timing. The relevant fields are documented in the DynoSim Replay CLI Reference.

Set prefill_engine_num_gpu and decode_engine_num_gpu explicitly in every simulated Planner run. The simulation adapter cannot auto-detect a deployment GPU count, and leaving both values unset causes cumulative GPU-hours to report as zero.

1

Compare aggregated and disaggregated deployments

Download the trace:

$mkdir -p traces/mooncake_fast25 && cd traces/mooncake_fast25
$curl -sLO https://raw.githubusercontent.com/kvcache-ai/Mooncake/main/FAST25-release/traces/toolagent_trace.jsonl

Run agg (2 workers, TP=1):

$python -m dynamo.replay traces/mooncake_fast25/toolagent_trace.jsonl \
> --planner-config '{
> "mode": "agg",
> "optimization_target": "sla",
> "ttft_ms": 1500, "itl_ms": 50,
> "enable_throughput_scaling": true, "enable_load_scaling": true,
> "pre_deployment_sweeping_mode": "rapid",
> "throughput_adjustment_interval_seconds": 300, "load_adjustment_interval_seconds": 10,
> "prefill_engine_num_gpu": 1, "decode_engine_num_gpu": 1,
> "report_filename": "dynosim_agg.html"
> }' \
> --extra-engine-args '{"aic_backend": "vllm", "aic_system": "h200_sxm", "aic_model_path": "nvidia/Llama-3.1-8B-Instruct-FP8", "aic_tp_size": 1}' \
> --num-workers 2 --arrival-speedup-ratio 1.0

Run disagg (1P1D, TP=1):

$python -m dynamo.replay traces/mooncake_fast25/toolagent_trace.jsonl \
> --planner-config '{
> "mode": "disagg",
> "optimization_target": "sla",
> "ttft_ms": 1500, "itl_ms": 50,
> "enable_throughput_scaling": true, "enable_load_scaling": true,
> "pre_deployment_sweeping_mode": "rapid",
> "throughput_adjustment_interval_seconds": 300, "load_adjustment_interval_seconds": 10,
> "prefill_engine_num_gpu": 1, "decode_engine_num_gpu": 1,
> "report_filename": "dynosim_disagg.html"
> }' \
> --prefill-engine-args '{"aic_backend": "vllm", "aic_system": "h200_sxm", "aic_model_path": "nvidia/Llama-3.1-8B-Instruct-FP8", "aic_tp_size": 1}' \
> --decode-engine-args '{"aic_backend": "vllm", "aic_system": "h200_sxm", "aic_model_path": "nvidia/Llama-3.1-8B-Instruct-FP8", "aic_tp_size": 1}' \
> --num-prefill-workers 1 --num-decode-workers 1 --arrival-speedup-ratio 1.0

Each run prints the AIPerf summary table to stdout and writes an HTML diagnostics report to ./planner_reports/<report_filename>. For this trace with a long ISL and short OSL, agg is better than disagg, which gets slightly better ITL at the cost noticeably more GPU-hours.

2

Sweep cold-start time

How sensitive is SLA attainment to engine startup time? Sweep startup_time from 0 to 300 seconds in 10-second steps and record TTFT/ITL/GPU-hours per run.

$#!/usr/bin/env bash
$set -euo pipefail
$
$TRACE=traces/mooncake_fast25/toolagent_trace.jsonl
$OUT=planner_reports/sweep_startup
$mkdir -p "$OUT"
$
$run_one() {
> local s=$1
> local name=$(printf "dynosim_agg_startup_%03d.html" "$s")
> local extra
> if [[ "$s" -eq 0 ]]; then
> extra='{"aic_backend":"vllm","aic_system":"h200_sxm","aic_model_path":"nvidia/Llama-3.1-8B-Instruct-FP8","aic_tp_size":1}'
> else
> extra=$(printf '{"aic_backend":"vllm","aic_system":"h200_sxm","aic_model_path":"nvidia/Llama-3.1-8B-Instruct-FP8","aic_tp_size":1,"startup_time":%d}' "$s")
> fi
> python -m dynamo.replay "$TRACE" \
> --planner-config "$(printf '{"mode":"agg","optimization_target":"sla","ttft_ms":1500,"itl_ms":50,"enable_throughput_scaling":true,"enable_load_scaling":true,"pre_deployment_sweeping_mode":"rapid","throughput_adjustment_interval_seconds":300,"load_adjustment_interval_seconds":10,"prefill_engine_num_gpu":1,"decode_engine_num_gpu":1,"report_filename":"%s"}' "$name")" \
> --extra-engine-args "$extra" \
> --num-workers 2 --arrival-speedup-ratio 1.0 \
> --report-json "$OUT/startup_$(printf '%03d' "$s").json" \
> >"$OUT/startup_$(printf '%03d' "$s").log" 2>&1
>}
$
$export -f run_one
$# Run 12 sweeps in parallel; adjust -P for your machine.
$seq 0 10 300 | xargs -n1 -P12 -I{} bash -c 'run_one "$@"' _ {}

Each run emits the AIPerf metrics table (parse TTFT / ITL avg / p90) and its HTML report (grep GPU hours: <float>). Plotting those against startup_time gives:
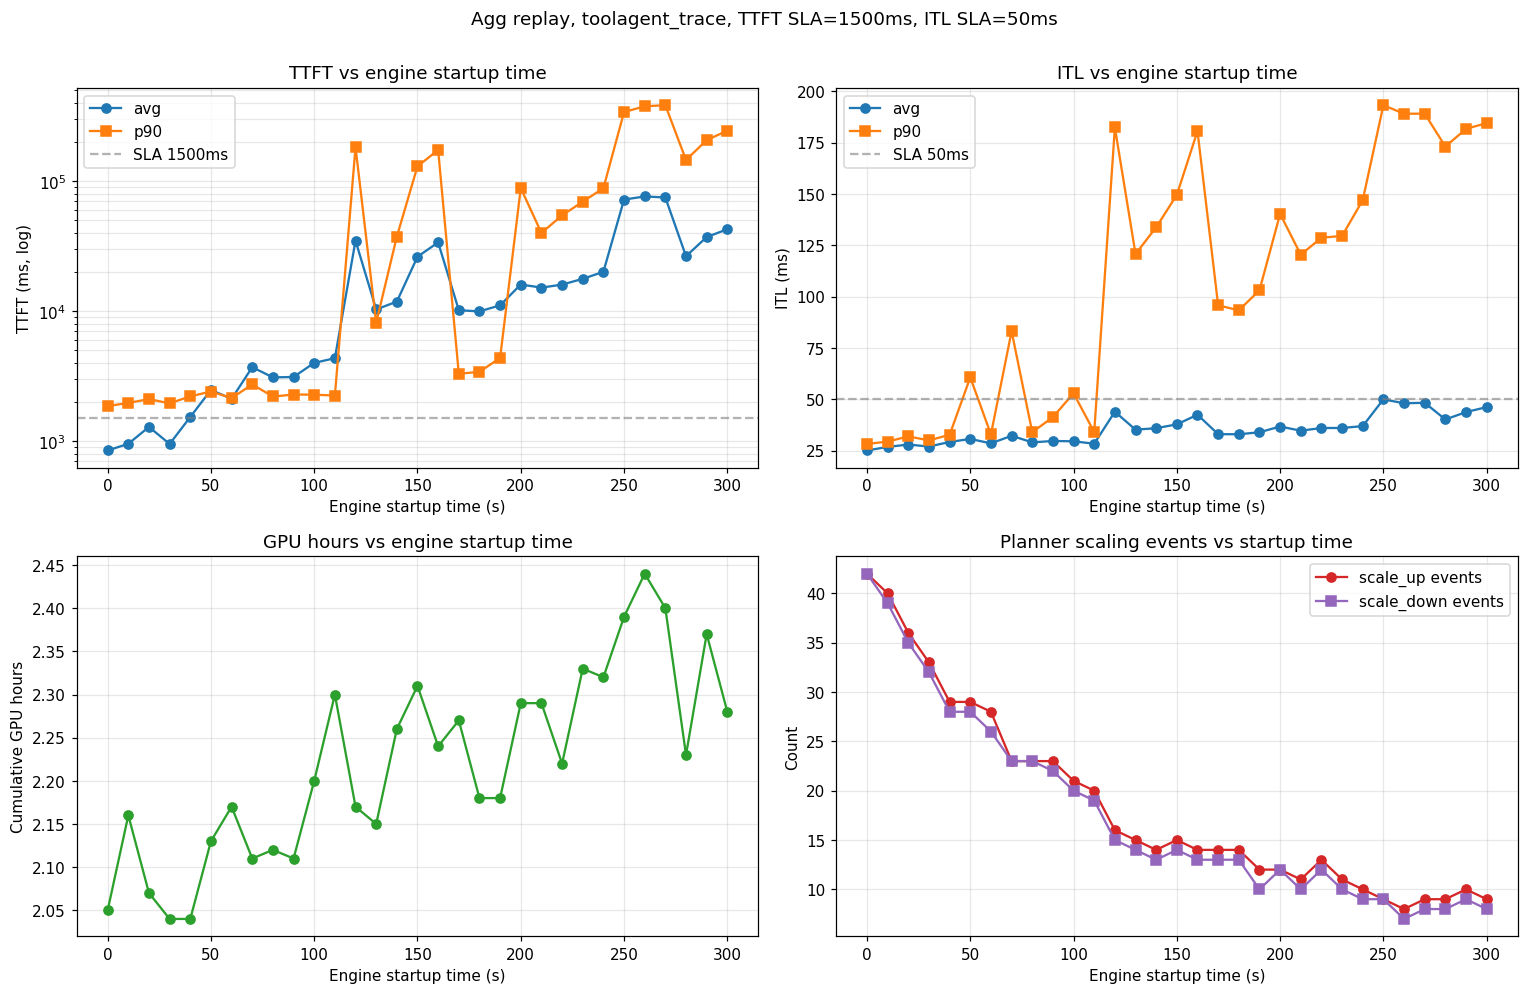
Planner DynoSim — startup time sweep

Observations from this sweep (agg, TTFT SLA 1,500 ms, ITL SLA 50 ms, H200-SXM, Llama-3.1-8B-FP8, TP=1):

  • SLA cliff near 100–120 s. Below that, the planner scales up fast enough to hold TTFT; above it, p99 TTFT diverges and the system stays perpetually backlogged.
  • Scaling-event count drops monotonically (42 → 8) as startup grows — long-startup runs require load planner to wait for stabilization before the next scaling decision.
  • ITL is less sensitive than TTFT until the queue saturates. Below the cliff, ITL rises modestly (25 → 30 ms avg); above it, p90 ITL jumps to ~200 ms as decode requests starve.