

Profile and Simulate RL Rollouts
Inspect a live rollout in Perfetto, then replay its request-plane workload
Start with the live run: correlate framework and Dynamo identity, localize the bottleneck, and validate the capture. Then replay or simulate the request plane. Dynamo does not reproduce the trainer, reward pipeline, policy transitions, sample acceptance, or model-dependent decisions.
Join the Right Data
No single component owns the complete RL timeline:
Keep high-cardinality rollout, sample, attempt, and policy IDs in framework records, traces, or logs. Use Prometheus labels only for bounded dimensions such as model, backend, worker role, and status class.
Establish Request Identity
For multi-turn trajectories, send Dynamo session headers when their semantics match:
Use x-request-id for cross-component logs and distributed traces. Native SGLang /generate gives a body rid precedence over that header, so use one stable rid or omit it.
Dynamo does not define typed RL rollout, trainer-step, or policy-version fields. Keep those values in the framework and join them through opaque request or session identity. Session identity supports correlation; it does not enable affinity unless the router is configured for it and does not validate policy freshness.
Capture Request Traces
Enable compact request-end traces:
Use Request Trace Reference for the exact schema and sink settings. Validate trace counts against framework attempts before interpreting timing. Canceled, failed, retried, and accepted attempts must remain distinguishable.
The OpenAI chat-completion path can also capture explicitly allowlisted application headers on request_payload rows. Those records can contain unredacted request and response data. Use opaque IDs and follow the workload’s retention and access policy; never capture credentials or sensitive prompts by default.
Profile a Rollout in Perfetto
Convert the trace into a timeline:
Open the result in the Perfetto UI. The timeline shows request, prefill, and decode slices; agentic workloads can also include inferred or explicitly reported tool spans. Use the framework’s rollout and attempt records alongside the timeline to distinguish serving time from environment, tool, reward, and trainer time. See Agent Tracing for tool-event capture and detailed Perfetto guidance.
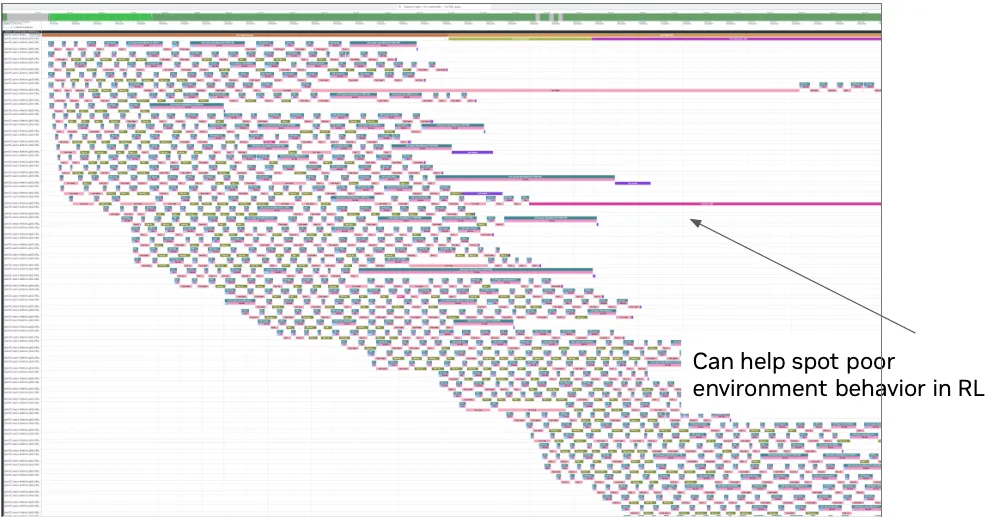
Use the overview to scan concurrent rollouts for long-tail environment or tool behavior.
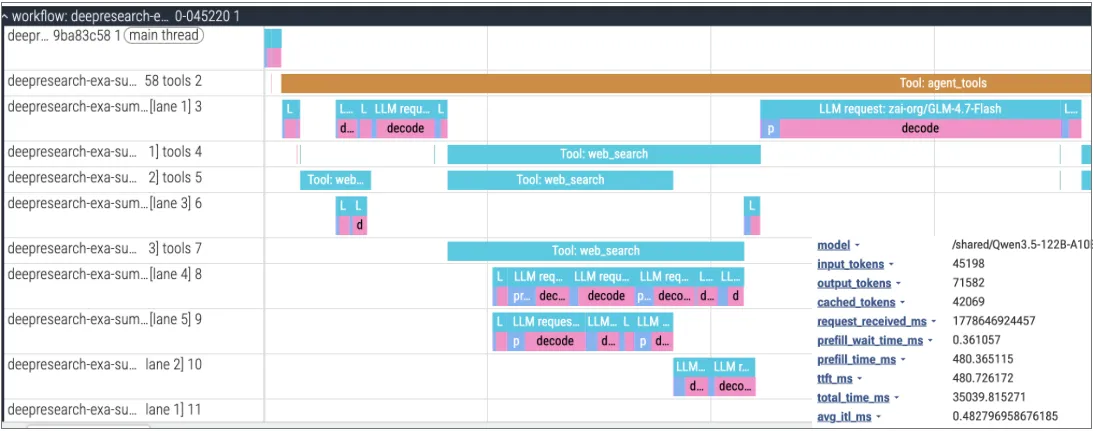
Zoom in on a rollout to separate tool time from request processing, prefill, and decode, then inspect token and latency fields for a selected request.
Diagnose the Live Run
Work from the framework inward:
- Framework: Was the attempt dispatched, canceled, retried, accepted, rejected, or blocked outside serving?
- Frontend and router: Did the request arrive, wait in a queue, and reach the expected worker?
- Backend: Did the engine queue, prefill, decode, cancel, error, or restart?
- Policy update: Which target policy and worker set should have been active, and had verification completed?
Align clocks before comparing sub-second timing.
Queueing
Compare framework dispatch, frontend receipt, router queue time, engine queue state, active prefill/decode work, request length, and timeout behavior. A gap before frontend receipt belongs outside Dynamo. Router queue time means Dynamo intentionally deferred dispatch; engine queueing after dispatch points to backend capacity or worker imbalance.
Cache Reuse
For repeated prompts, compare trace sequence hashes, model and tokenizer identity, cache events, router overlap signals, worker placement, and reset boundaries. After a policy update, expect old-policy cache state to be cleared and separate the required warm-up from a regression.
Policy Refresh
Compare the framework gate, selected worker set, per-worker pause, transfer, cache, version, readiness, resume, and post-update results. Request traces do not contain a standardized weight-update event, so preserve that lifecycle in framework or control records and place it on the same time axis.
Build a Minimum Operations View
A useful dashboard or query pack answers:
- How many attempts were dispatched, completed, canceled, retried, accepted, or rejected?
- Where is time spent before and inside serving?
- Are shared prompts reusing KV state?
- Are requests and active work balanced across workers?
- Which policy and worker set should be serving?
- How long do gate, transfer, cache reset, verification, and warm-up take?
- Did a serving improvement increase accepted or fresh trajectories per unit time?
Define the numerator, denominator, freshness rule, and phase boundary for every RL throughput or goodput metric.
Replay the Request Plane
A validated request_end trace preserves request schedule, input and output lengths, sequence-sharing hashes, KV block size, and supported session relationships. Before replaying, reconcile request and token counts, session counts, block size, skipped rows, and final trace shards.
Save an offline prediction config as /tmp/rl-run/dynosim.yaml. Set the engine identity to match
the deployment that produced the trace, and list every trace shard explicitly under paths:
Run DynoSim on the captured trace:
Change one serving factor at a time. Use DynoSim for the complete workflow and Agent Trace Replay for the live synthetic replay path.
Understand Fidelity
Do not call this closed-loop RL simulation. It reproduces serving questions for a captured request graph.
Calibrate Results
For any simulated configuration that informs a decision:
- Run the trace against the matching live deployment.
- Run the matching DynoSim configuration.
- Compare request and token totals, queueing, cache behavior, latency, and utilization where modeled.
- Report repeated-run spread plus absolute and relative error for the decision metrics.
- Validate the shortlisted configuration on real GPUs before publishing performance numbers.
Recalibrate when the model, backend, hardware, topology, router, or timing model changes. If variance changes the ranking, report the comparison as inconclusive rather than selecting the favorable run.