

Tracing
Overview
Dynamo supports OpenTelemetry-based distributed tracing for visualizing request flows across Frontend and Worker components. Traces are exported to Tempo via OTLP (OpenTelemetry Protocol) and visualized in Grafana.
Requirements: Set DYN_LOGGING_JSONL=true and OTEL_EXPORT_ENABLED=true to export traces to Tempo.
Note: When OTLP export is enabled, Dynamo exports both traces and logs. Traces are sent to Tempo and logs are sent to Loki (via the OpenTelemetry Collector). To send logs to a separate endpoint, set OTEL_EXPORTER_OTLP_LOGS_ENDPOINT; otherwise it falls back to the generic OTEL_EXPORTER_OTLP_ENDPOINT, then the protocol default — it does not follow the traces endpoint. See Logging for details.
This guide covers single GPU demo setup using Docker Compose. For Kubernetes deployments, see Kubernetes Deployment.
Note: This section has overlap with Logging of OpenTelemetry Tracing since OpenTelemetry has aspects of both logging and tracing. The tracing approach documented here is for persistent trace visualization and analysis. For short debugging sessions examining trace context directly in logs, see the Logging guide.
Environment Variables
Getting Started Quickly
1. Start Observability Stack
Start the observability stack (Prometheus, Grafana, Tempo, exporters). See Observability Getting Started for instructions.
2. Start Dynamo Components (Single GPU)
For a simple single-GPU deployment, run the aggregated tracing launch script. This script enables tracing, sets per-component service names, and starts a frontend with a single vLLM worker:
To override the Tempo endpoint (default http://localhost:4317):
This runs a single aggregated worker on one GPU, providing a simpler setup for testing tracing.
Alternative: Disaggregated Deployment (2 GPUs)
For a disaggregated deployment with tracing, run the disaggregated tracing launch script. This script sets up tracing and launches a frontend, a decode worker on GPU 0, and a prefill worker on GPU 1:
This separates prefill and decode onto different GPUs for better resource utilization.
3. Generate Traces
Send requests to the frontend to generate traces (works for both aggregated and disaggregated deployments). The launch scripts print an example curl command on startup with the correct model name.
Tip: Add an x-request-id header to easily search for a specific trace in Grafana:
4. View Traces in Grafana Tempo
- Open Grafana at
http://localhost:3000 - Login with username
dynamoand passworddynamo - Navigate to Explore (compass icon in the left sidebar)
- Select Tempo as the data source (should be selected by default)
- In the query type, select “Search” (not TraceQL, not Service Graph)
- Use the Search tab to find traces:
- Search by Service Name (e.g.,
dynamo-frontend) - Search by Span Name (e.g.,
http-request,handle_payload) - Search by Tags (e.g.,
x_request_id=test-trace-001)
- Search by Service Name (e.g.,
- Click on a trace to view the detailed flame graph
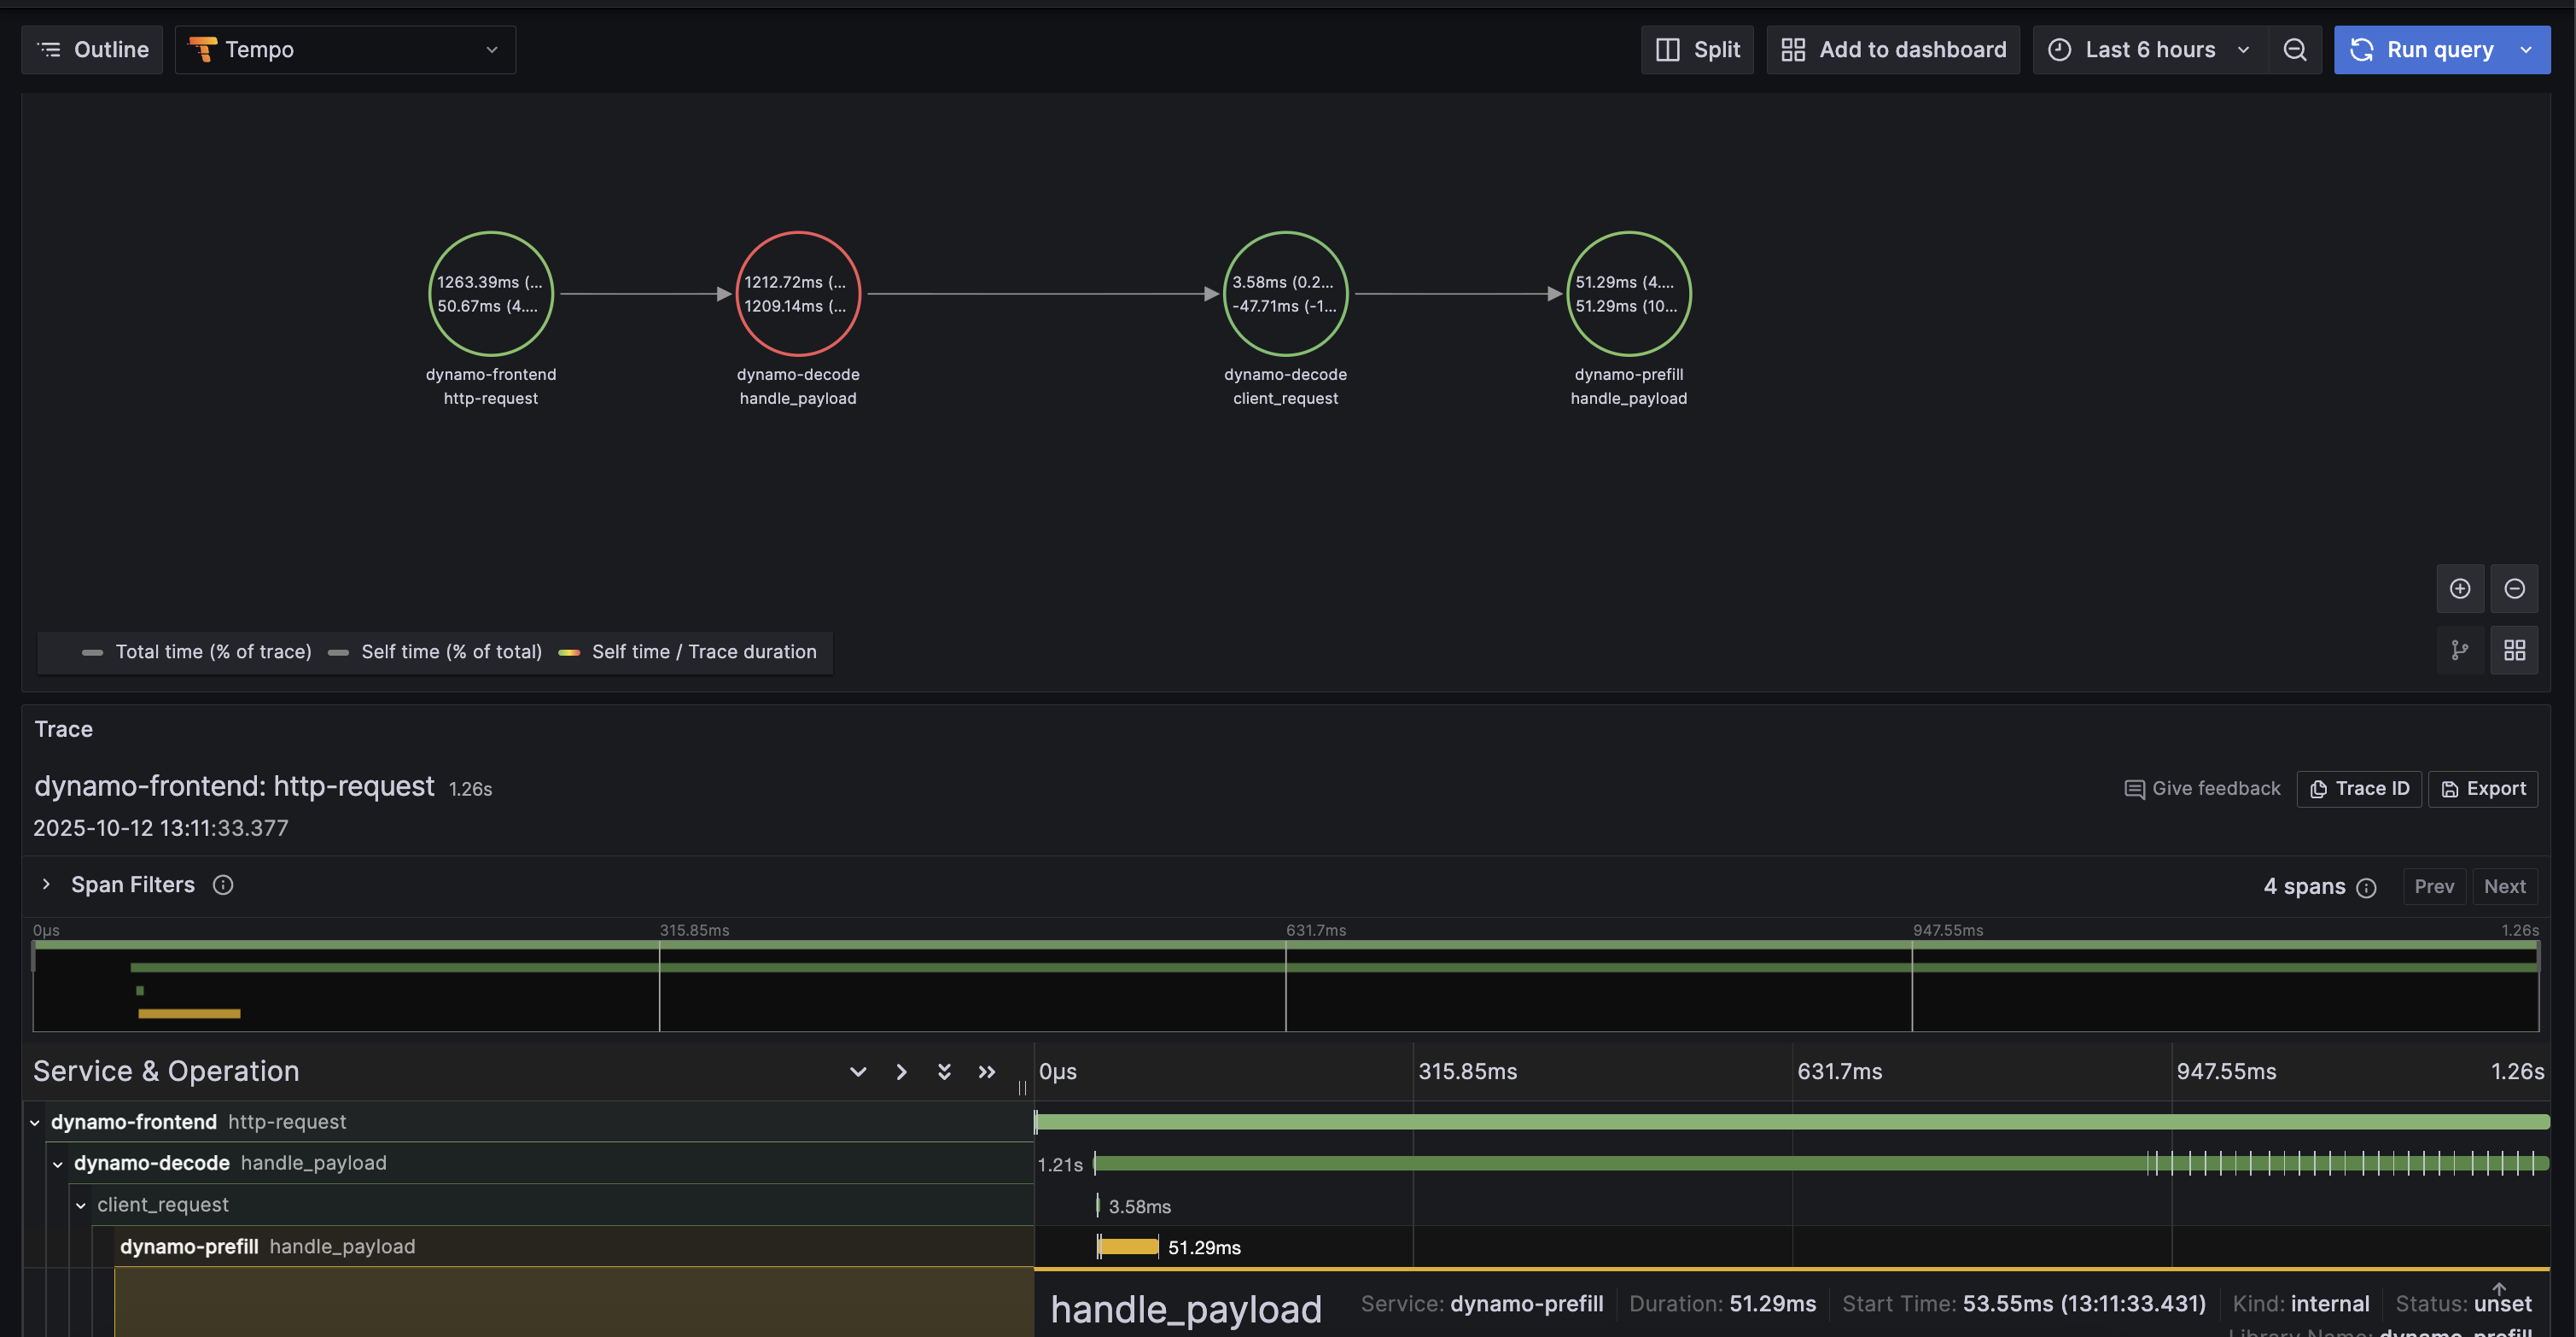
Example Trace View
Below is an example of what a trace looks like in Grafana Tempo:
5. Stop Services
When done, stop the observability stack. See Observability Getting Started for Docker Compose commands.
Kubernetes Deployment
For Kubernetes deployments, ensure you have a Tempo instance deployed and accessible (e.g., http://tempo.observability.svc.cluster.local:4317).
Modify DynamoGraphDeployment for Tracing
Tracing-enabled variants of the example deployments are provided:
- Aggregated:
examples/backends/vllm/deploy/agg_tracing.yaml - Disaggregated:
examples/backends/vllm/deploy/disagg_tracing.yaml
These add the Environment Variables to the base agg.yaml / disagg.yaml deployments. To override the Tempo endpoint, edit OTEL_EXPORTER_OTLP_TRACES_ENDPOINT in the YAML.
Apply a tracing-enabled deployment:
Traces will now be exported to Tempo and can be viewed in Grafana.