

Planner Retune: Staying on the Pareto Frontier as Traffic Drifts
Hongkuan Zhou — November 2026
In AISim: Simulating the Pareto Frontier we used simulation to find the best serving configuration before a deployment goes live. That configuration is only best for the traffic it was tuned on. Production traffic does not hold still: a RAG workload in the morning, reasoning-heavy chat in the afternoon, an agent fleet at night. The settings that were optimal at deploy time quietly drift away from the frontier.
Planner Retune closes that gap. Dynamo frontends record the traffic a deployment actually serves. The Planner replays the most recent window in AISim for a grid of KV-router and Planner settings and switches the running deployment to the winner, with no restart. Here is what it bought in our experiments:
- Real H200, router retune: +13.1% goodput per GPU after the first decision, with SLA attainment up from 51% to 58% and median time to first token down 17%.
- Real H200, router and Planner retune with autoscaling: +4.6% goodput per GPU and +6.1 points more requests within SLA, using about 5% more GPUs.
- Simulation, traffic switches: after the traffic changes, retune catches up in one window and gains about +11% goodput per GPU on the next one.
- Simulation, router and Planner together: +10.8% over a day by fixing a router setting that only breaks once the Planner autoscales.
- Fast: 5 to 7 minutes from the end of a window to the new settings serving traffic.1
1 Measured in the two real-GPU runs in Section 4, with a one-hour retune window. This time depends on the retune window size and the traffic load, which set how many requests each replay covers, and on the speed of the CPUs that run the sweep.
1. The best settings move with the traffic
Two components decide how well a Dynamo deployment uses its GPUs from minute to minute. The KV router decides which worker serves each request, trading KV-cache reuse (send a request to the worker that already holds its prefix) against load balance (send it to the least busy worker). The Planner decides how many workers to run and how quickly to add or remove them. Both have a handful of knobs, and the right values depend on the traffic.
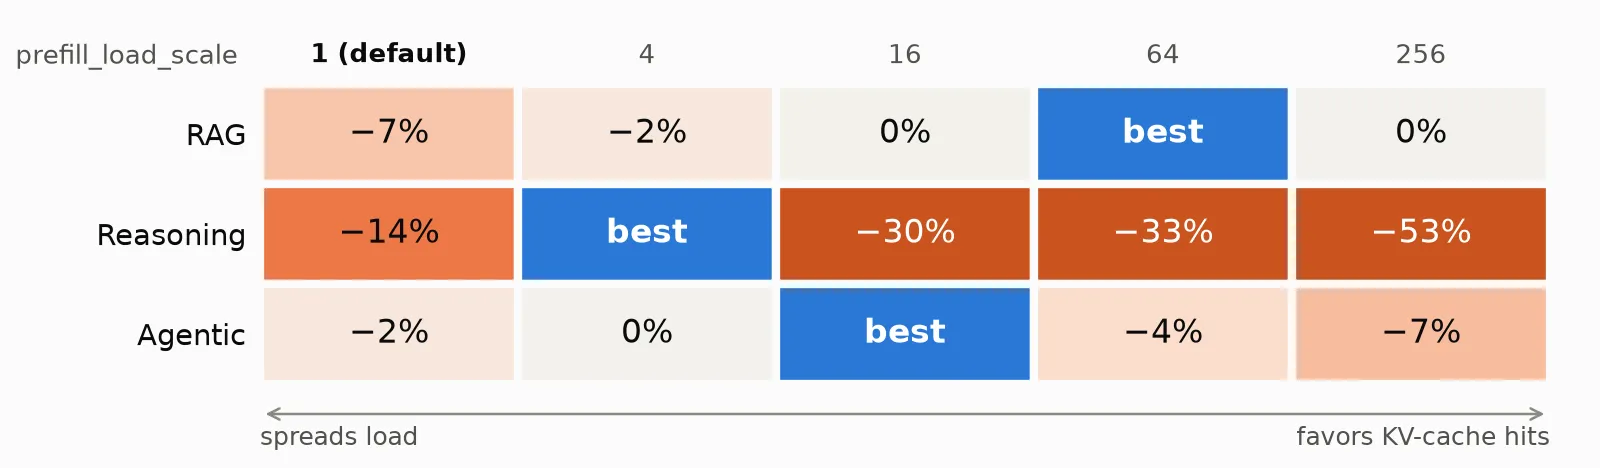
Simulation (AISim replay). Each cell is goodput per GPU relative to the best setting in its row; blue marks the
best. Five values of prefill_load_scale at overlap_score_credit 1, DeepSeek-V4-Pro on a fixed fleet of 128 B300
GPUs, one day of each traffic type.
On the router side (Figure 1a), RAG traffic wants strong cache affinity: prefill_load_scale 64 is best. The same
setting loses 33% on single-tenant reasoning traffic, where long decodes pile up on the few workers that hold the
hot prefixes; there, a much lighter prefill_load_scale 4 wins. Agentic traffic lands in between, at 16. The default
(credit 1, scale 1) is never the best and gives up 2 to 14%.
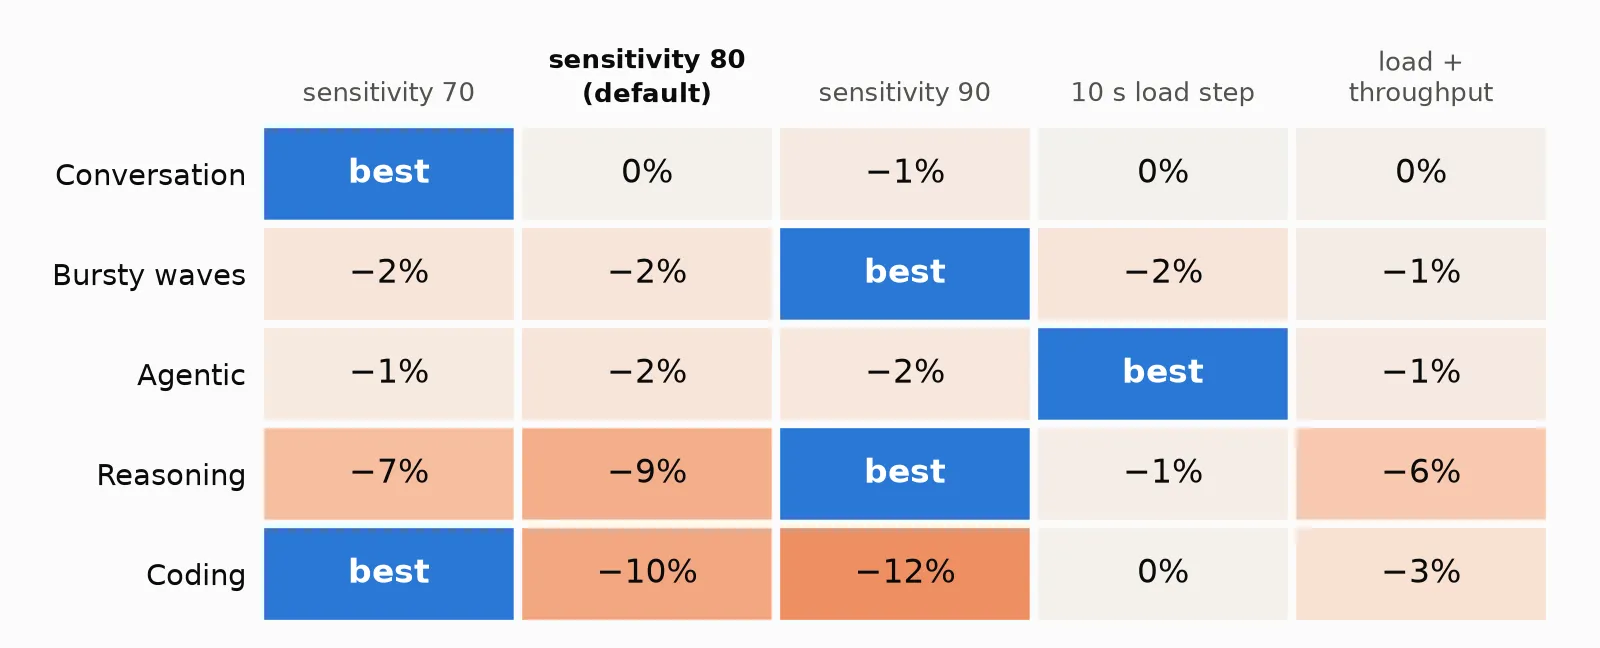
Simulation (AISim replay), read like Figure 1a. Five Planner scaling settings: load-based scaling with a scale-down sensitivity of 70, 80 (the default) or 90, load-based scaling with a 10-second step, and load plus throughput scaling. Qwen3-32B with the Planner autoscaling between 1 and 8 H200 GPUs, two hours of each traffic type.
The Planner shows the same pattern (Figure 1b). On reasoning traffic and bursty waves, scaling down conservatively (sensitivity 90) is best and the default sensitivity of 80 loses up to 9%. On coding traffic it is the reverse: aggressive scale-down (sensitivity 70) is best and the conservative setting loses 12%. Agentic traffic prefers a slower 10-second load step.
No single setting wins everywhere, so any setting tuned once at deploy time leaves goodput on the table as soon as the mix shifts. Tuning has to follow the traffic.
2. How retune works
Retune turns the AISim workflow into a loop that runs next to the deployment.
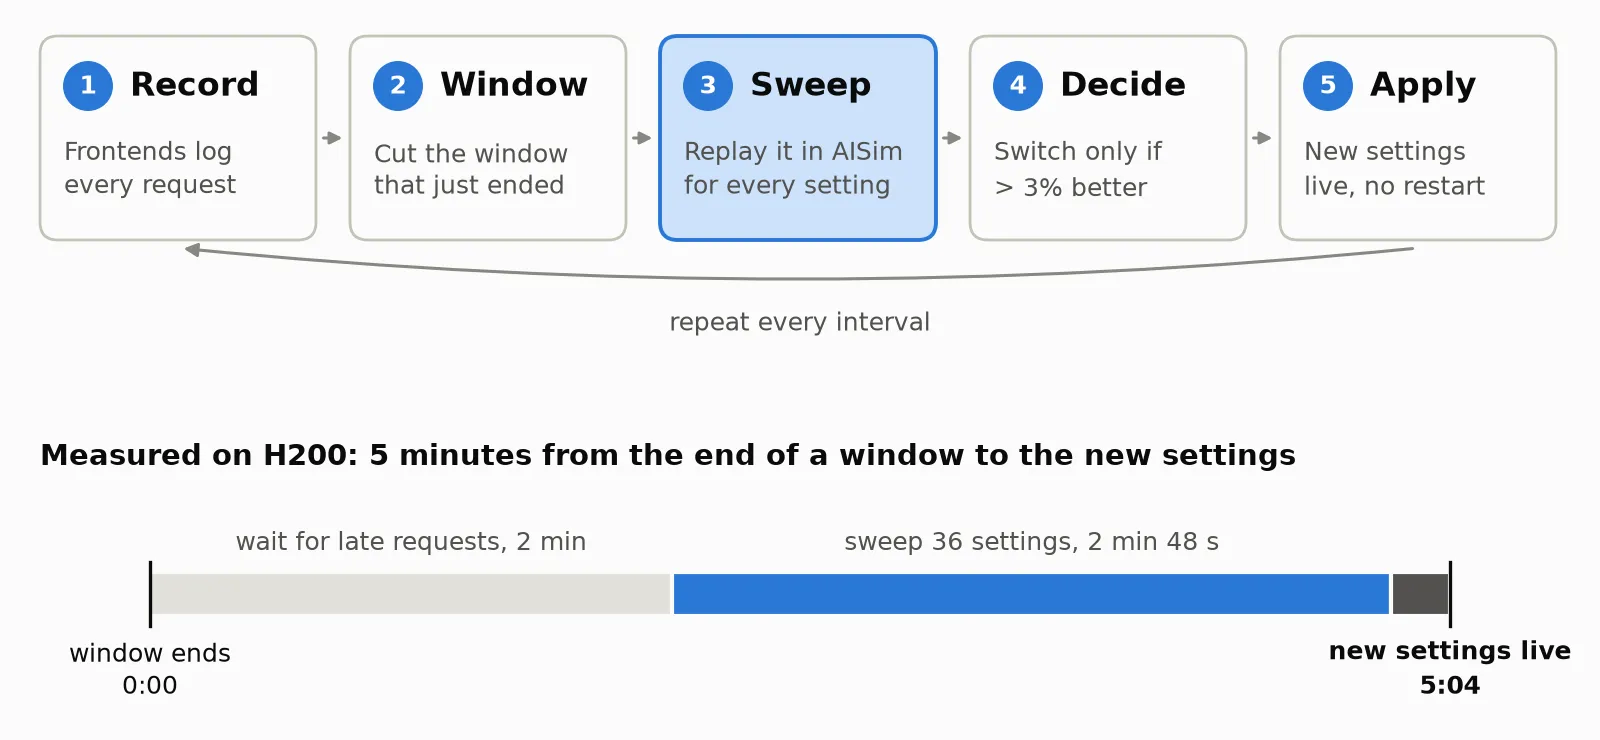
The timeline is the first live decision of the autoscaling experiment in Section 4: the sweep started 2 minutes after the window ended, scored 36 router and Planner settings in 2 minutes 48 seconds, and the new Planner and router settings were live at 4:50 and 5:04.
- Record. Every frontend writes one record per request it serves: timing, token counts, and hashes of the prompt’s KV blocks, which is what a KV-aware replay needs. The prompt text itself is not recorded.
- Window. Every
interval_seconds(one hour in our runs), the Planner cuts the records of the window that just ended into one trace. - Sweep. The Planner replays that window in AISim once for every candidate router and Planner setting. On Kubernetes the replays run as DynamoGraphDeploymentRequests, in parallel, next to the deployment.
- Decide. Each candidate is scored on goodput per GPU: the output tokens per second of requests that meet the time-to-first-token and inter-token-latency SLA, divided by the GPUs provisioned. (The results in this post count those requests instead of their tokens.) The best candidate replaces the current settings only if it is more than 3% better on the same window. The decision is written to a Kubernetes Lease before anything changes.
- Apply. The Planner pushes the router settings to every frontend and applies its own new settings in place. Traffic keeps flowing; nothing restarts.
Three properties make the loop safe to leave on. All candidates replay with the same random seed, so a setting that
changes no routing or scaling decision scores exactly like the current one and is never picked by chance; together
with the 3% threshold, this keeps retune from switching back and forth on noise. Decisions are written to a Lease
before they act, and windows are aligned to wall-clock time, so a restarted Planner continues the same windows. And
advisory mode records every decision without applying it, so you can watch what retune would do first.
Experimental. Retune is an experimental feature, and on a running deployment it is for development clusters only: the Planner sets router parameters through the frontend’s admin API, which has no authentication yet. Do not enable it on a cluster that serves production traffic.
Turning it on is a block in the Planner configuration. This is the one from our autoscaling run, shortened: with
executor: dgdr the Planner also needs a retune.dgdr section, which says where the recorded traffic is stored and
which model and engine the replays simulate. See
Planner Live Retune for the complete setup.
Retune comes in two forms. Replay retune runs the whole loop inside a simulation, so you can measure what it would gain on your own traces before touching a cluster; Section 3 uses it. Live retune runs it on a Kubernetes deployment; Section 4 uses it.
3. Simulation: following the traffic
We first ran retune in simulation, where the same traffic can be replayed with retune on and off and nothing else changes.
Catching up after a traffic switch
To see whether retune keeps up when the traffic changes, we replayed four days of traffic that switch between two very different workloads, RAG and reasoning, in both orders.
The RAG days come from RAGPulse, a public trace of a university-wide question-answering service built on retrieval. One day of it holds about a thousand requests, so we replay 256 copies of every request, each copy with its own KV prefixes and shifted by up to 30 seconds. A RAG request is light: about 2,800 input tokens and 300 output tokens. The request rate follows the day, from 7 requests per second in the busiest hour to almost nothing in the quiet hours.
The reasoning days come from the thinking-model trace of the Qwen-Bailian usage traces: two hours of anonymized production requests from a Qwen serving cluster on Alibaba Cloud Bailian. We replay it at three times its rate and repeat it to fill two days. The rate is steady at about 4.5 requests per second, and each request is much heavier: about 4,800 input tokens and 3,700 output tokens, twelve times the output of a RAG request. About a third of the RAG input and almost half of the reasoning input repeats a prefix that an earlier request already sent.
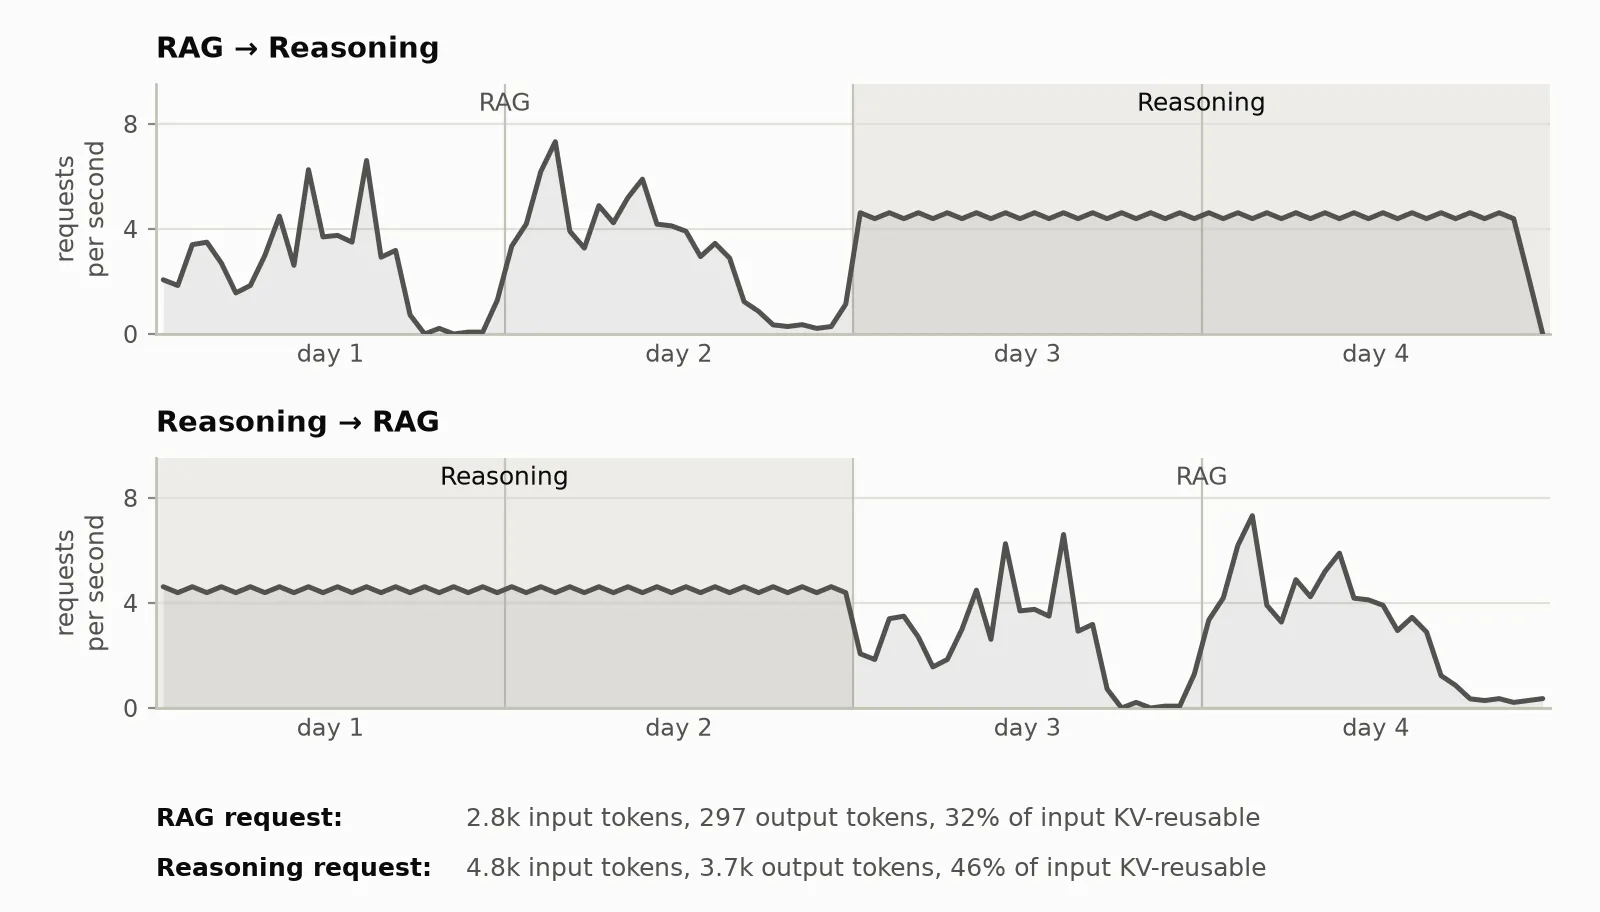
Hourly request rate of the replayed traces; the reasoning days are tinted. KV-reusable input is the share of input tokens whose prefix already appeared earlier in the trace: the most a KV cache could reuse. A real deployment reuses less.
The deployment is DeepSeek-V4-Pro on up to 32 B300 GPUs with the SLA Planner autoscaling, and retune runs once per day, searching router settings and the Planner’s load predictor.
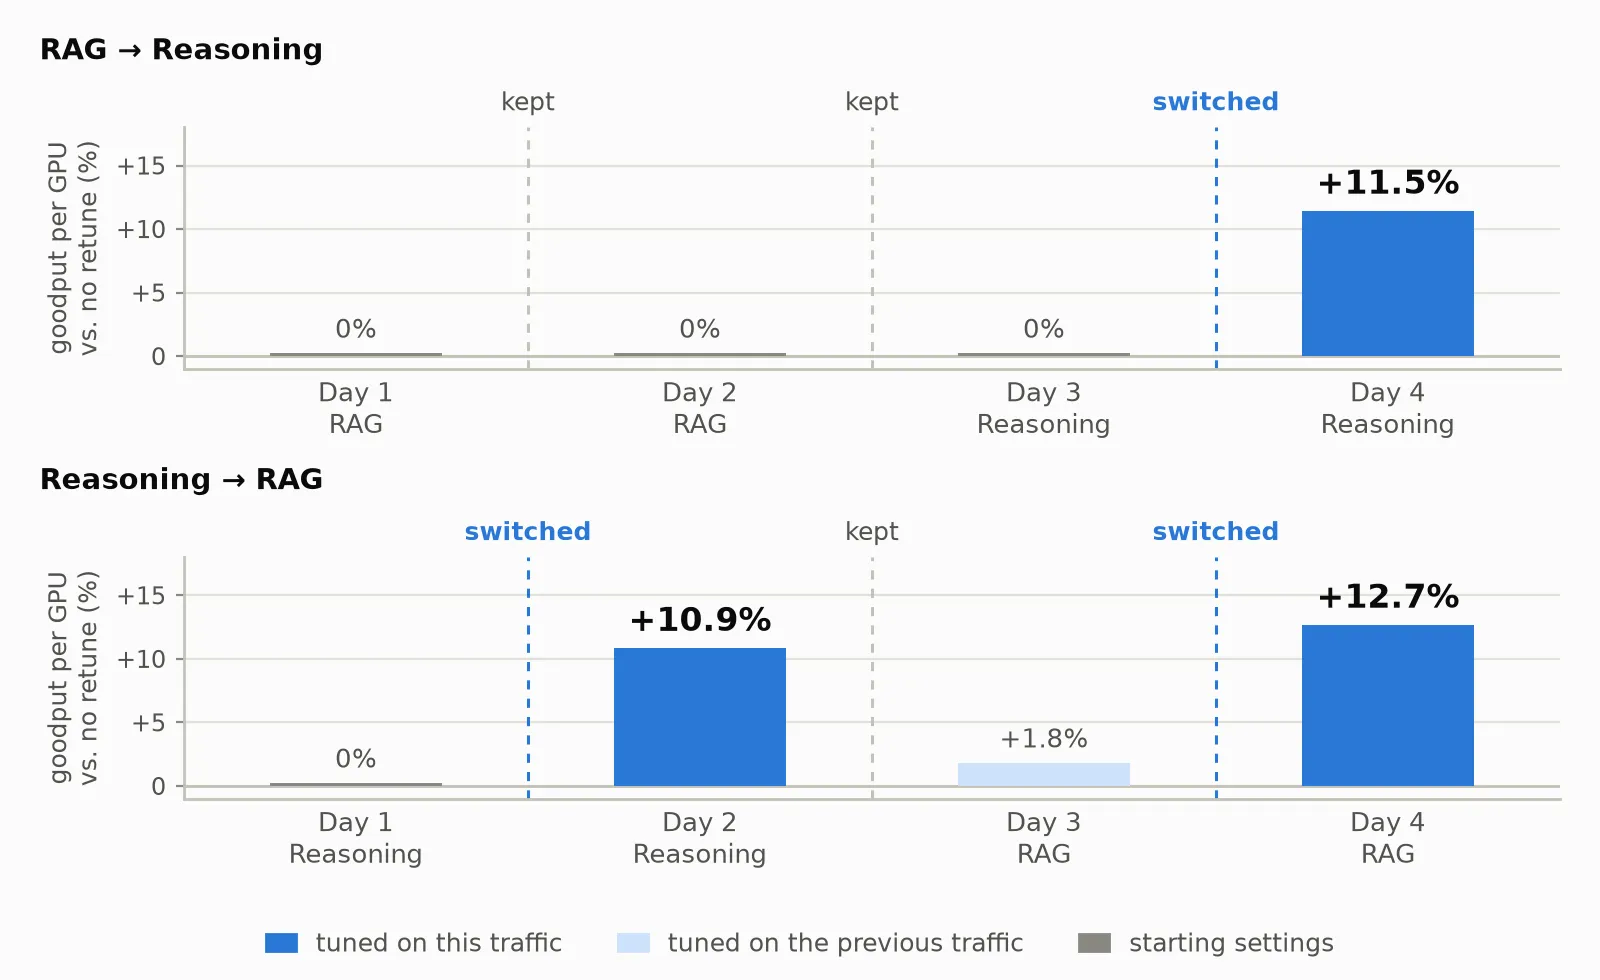
Simulation (AISim replay). Goodput per GPU with router and Planner retune versus without, per day; one retune window is one day. Dashed lines mark decisions.
In both orders, retune switches as soon as it has seen one window of the new traffic, and the next day gains +11.5% and +10.9% goodput per GPU, with SLA attainment rising from 58% to 64%. When nothing is clearly better, it keeps the current settings: on the two RAG days of the first sequence, every sweep found less than 3%, so nothing changed and nothing was lost. Carrying reasoning-tuned settings into the first RAG day did not hurt either (+1.8%).
The last RAG day gains +12.7% in a different way: retune switched the router to credit 2, scale 1 and the Planner’s load predictor from ARIMA to Kalman, and the deployment ran 26% fewer GPUs while SLA attainment fell from 75% to 62%. Goodput per GPU rewards that trade. This is a recovery rather than a better RAG setting: after two reasoning days the deployment without retune, whose load predictor was fitted to reasoning traffic, stays at about 32 GPUs through both RAG days, and retune brings the fleet back to where the starting settings run when RAG comes first (about 22 GPUs on the same day, with goodput per GPU within 1% of the retuned run). If SLA attainment matters more than GPU count for your service, keep an eye on it when choosing the objective.
Tuning the router and the Planner together
The router and the Planner also interact. A router setting that is ideal for a fixed fleet can hurt once the Planner
starts adding and removing workers: with SLA Planner autoscaling on a day of RAG traffic, the fixed-fleet favorite
prefill_load_scale 64 loses 14% to the default.
The traffic here is one day of the same RAGPulse trace at four times the scale: 1,024 copies, 1.08 million requests. The requests look the same all day (about 2,700 input tokens, 300 output tokens, a third of the input reusable), but the rate does not: 17 requests per second on average for the first 16 hours, with 15-minute peaks near 40, and then about 2 requests per second for the last 8 hours.
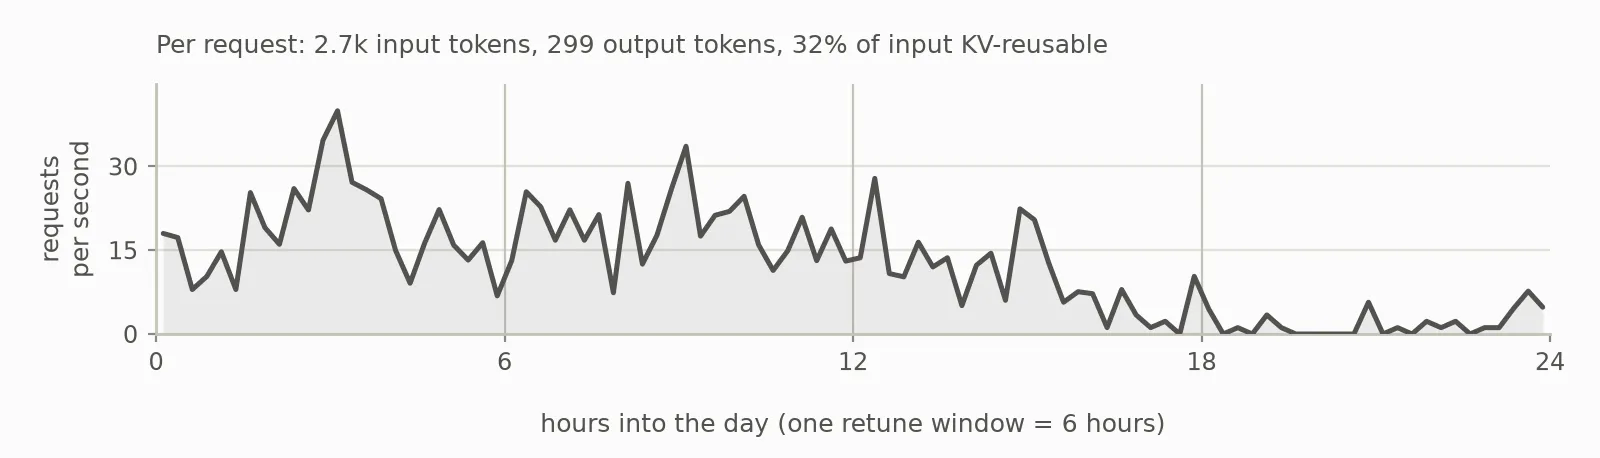
Request rate of the replayed trace in 15-minute bins; KV-reusable input as in Figure 3a. Vertical lines mark the 6-hour retune windows.
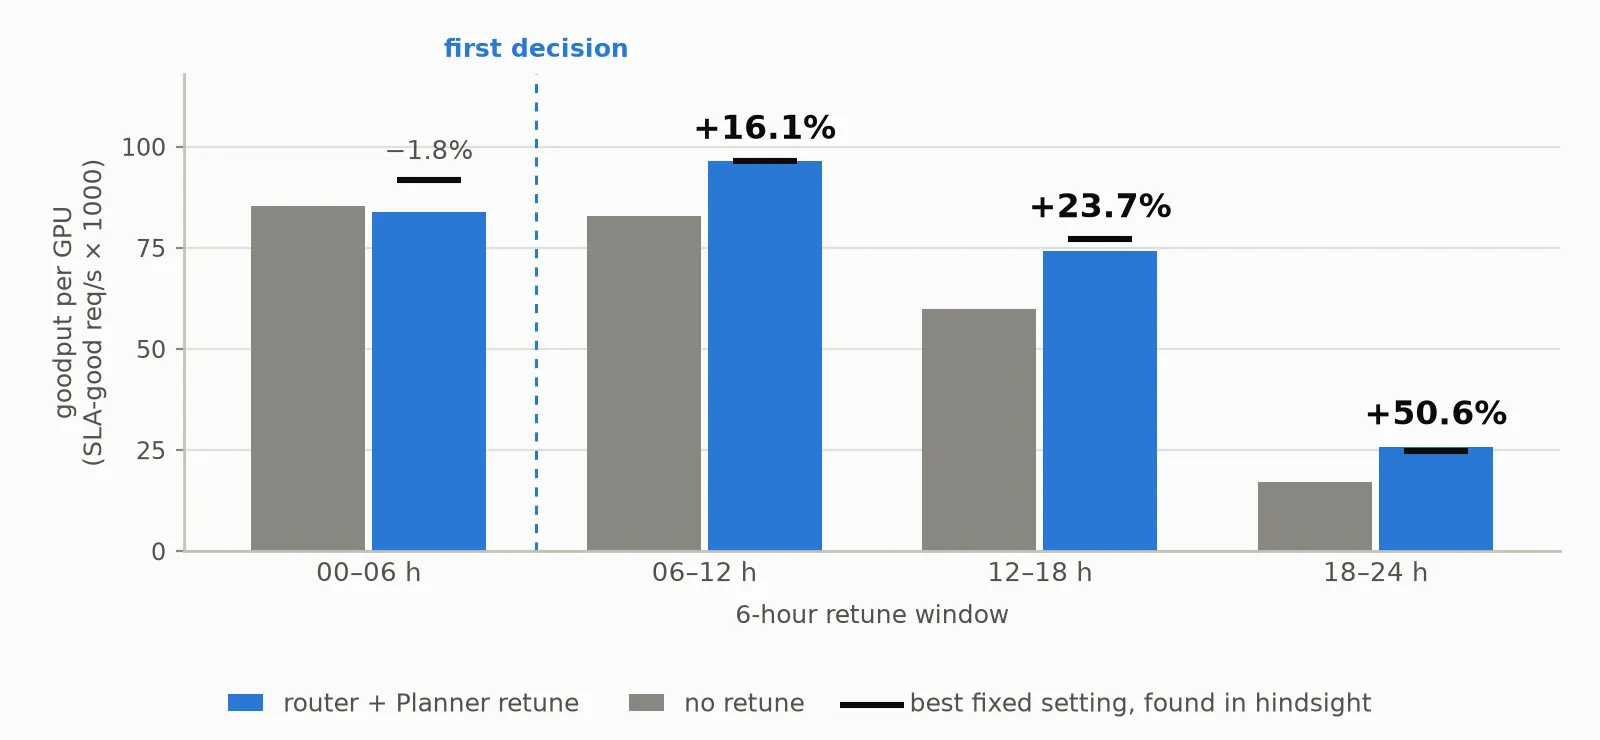
Simulation (AISim replay). DeepSeek-V4-Pro on up to 128 B300 GPUs with SLA Planner autoscaling, one day of RAG traffic, retune every 6 hours. Without retune the router stays on the fixed-fleet setting. Black ticks mark the best fixed setting, found in hindsight. Both runs use the same settings in the first window, so the −1.8% gap there is run-to-run randomness.
Starting from that setting, retune searches router and Planner settings together. Its first decision switches the
router back to prefill_load_scale 1 and the Planner’s load predictor from ARIMA to Prophet. Every window after it
gains 16 to 51% and stays within 4% of the best fixed setting. Over the whole day that is +10.8% goodput per GPU.
The day’s number is lower than those windows because it divides all SLA-good requests by all GPU time: the first
window, which ran before any decision, holds about a third of that GPU time, and the 51% comes from the quiet last
window, which holds about 3% of the day’s requests. Because every candidate replays with the Planner in the loop,
retune sees an interaction that a router sweep on a fixed fleet misses.
4. Real GPUs
Simulation tells us where the gains are. To show them on hardware, we ran live retune on H200 GPUs in two experiments. Each one runs two identical Dynamo deployments of Qwen3-32B (vLLM 0.33, KV router) side by side on the same Kubernetes cluster and replays the same two-hour trace into both with AIPerf on a fixed schedule. Only one deployment has retune on. For the first hour both run the same settings, and retune only records traffic, so the first hour also measures how much two identical deployments differ by chance. Each experiment is a single run on one trace, so its numbers show what retune gained on that traffic and are not a general figure.
Router retune: +13% goodput per GPU
The first experiment keeps four H200 GPUs per deployment and lets retune search the default router grid
(router: default), 108 settings: overlap_score_credit (0, 0.5, 1) × prefill_load_scale (0, 0.25, 0.5, 1, 2, 4,
8, 16, 32) × temperature (0, 0.2, 0.5, 1).
The traffic is the conversation trace published with Mooncake (FAST ‘25): one hour of online conversation requests, multi-turn chats that carry their history with them. To fit four GPUs we replay it at 0.4 times its rate and drop the 5% of requests that exceed the model’s 40,960-token context. We play the hour twice, the second time with new prefixes for everything except the most widely shared ones. The result is 9,477 requests at a steady 1.3 requests per second, about 9,400 input tokens and 340 output tokens each, with 39% of the input repeating an earlier prefix.
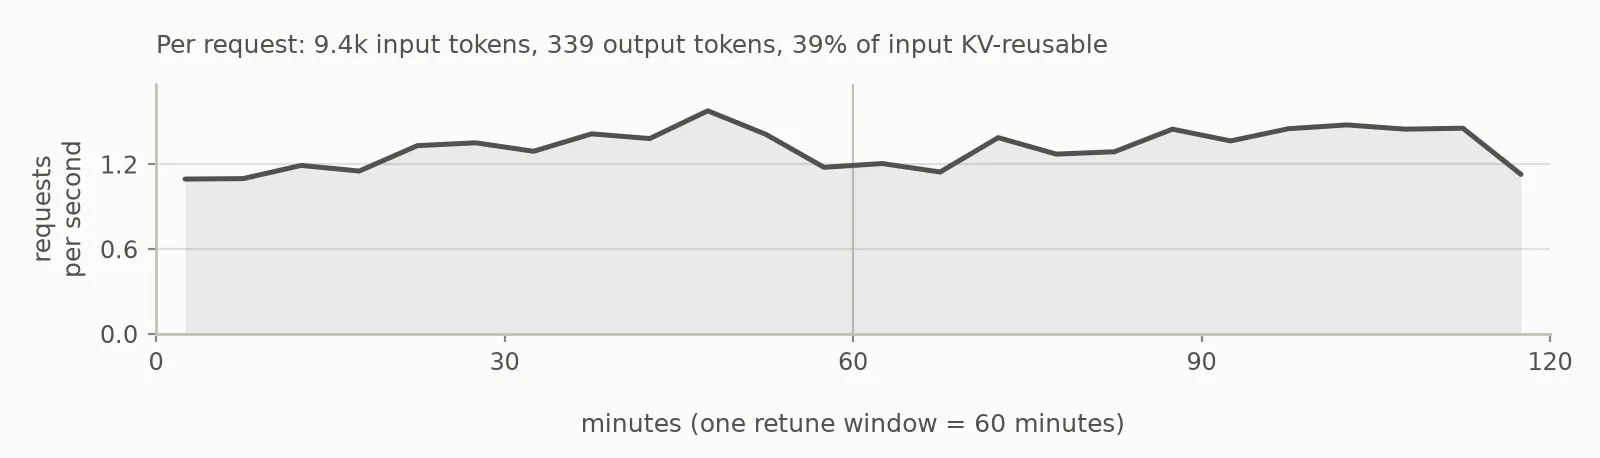
Request rate of the replayed trace in 5-minute bins; KV-reusable input as in Figure 3a. The vertical line marks the end of the first retune window.
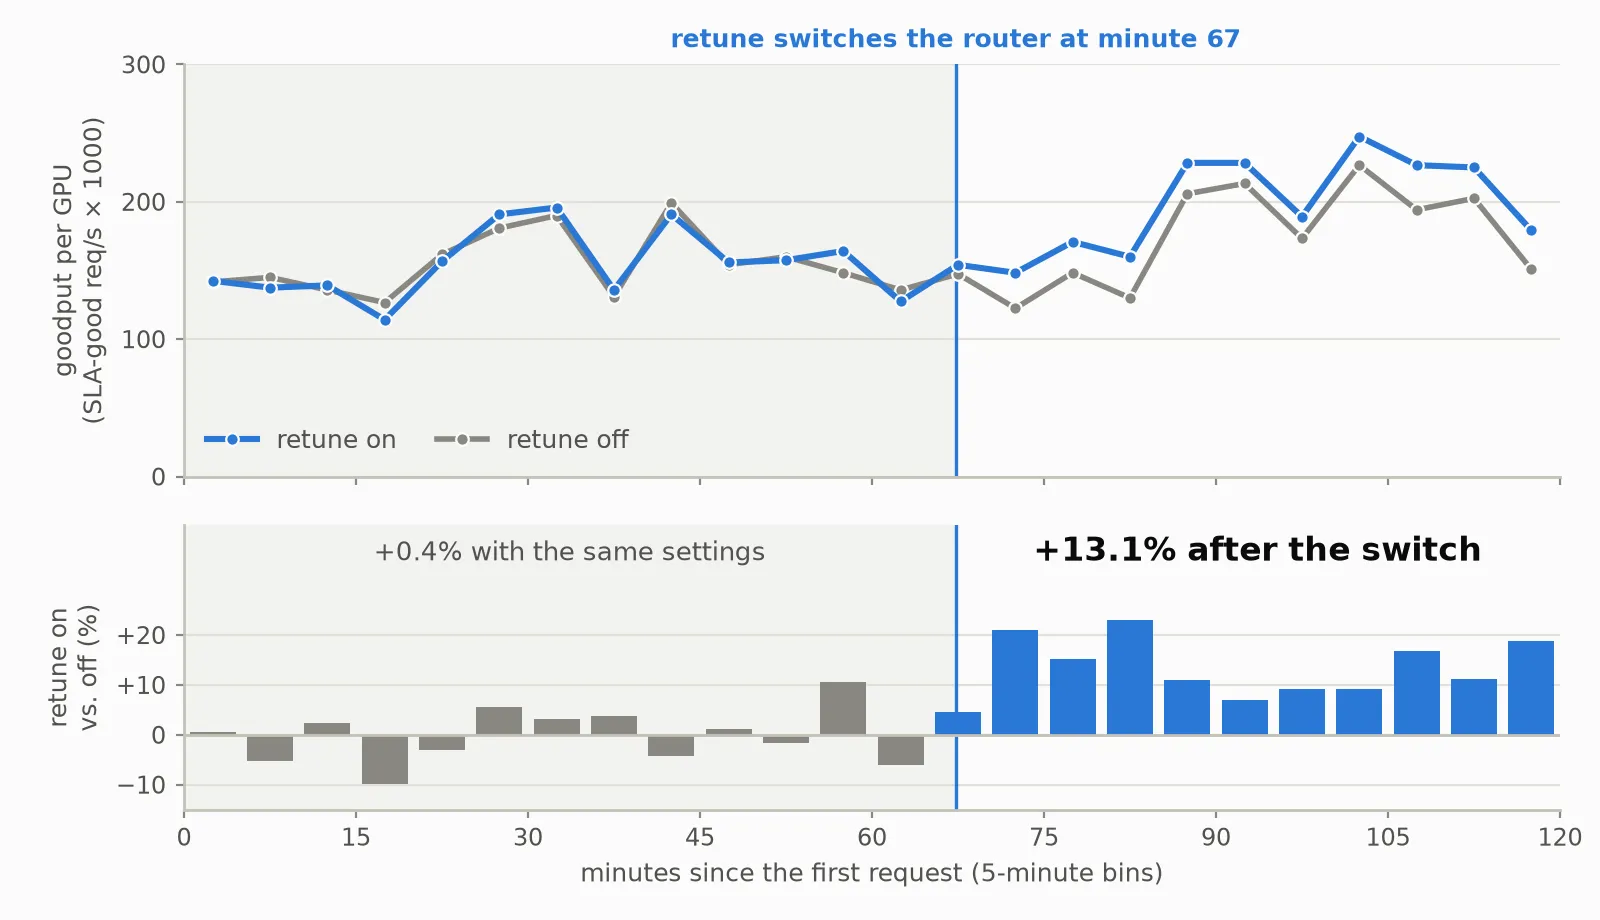
Measured on H200. Top: goodput per GPU in 5-minute bins. Bottom: retune on versus off. In the first hour both deployments run the same settings, so the +0.4% difference is run-to-run randomness.
Seven minutes after the first hour ended, retune changed one setting, prefill_load_scale from 1 to 16, chosen from
108 candidates. On this trace, the retuned deployment was ahead in every 5-minute bin from then on:
+13.1% goodput per GPU, SLA attainment up from 51% to 58%, and median time to first token down 17%. An hour later
the next sweep found nothing more than 3% better and kept the setting, as it should when the traffic has not changed.
Router and Planner retune with autoscaling: +4.6%
The second experiment lets the Planner scale each deployment between one and four H200 GPUs as traffic rises and falls in waves, and lets retune search router and Planner settings together. Fast scaling matters here, so new workers start from a Dynamo Snapshot: they are ready in about 20 seconds instead of about 2.5 minutes for a cold start.
The traffic is the same conversation trace, reshaped into waves: we keep or drop whole conversations so that the request rate rises and falls twice per hour, between about 0.2 and 0.9 requests per second. Each request still looks like those of the first experiment: about 9,800 input tokens and 330 output tokens, with 41% of the input reusable. The second hour repeats the conversations of the first hour with new prefixes, so both hours offer the same load: 3,472 requests in total.
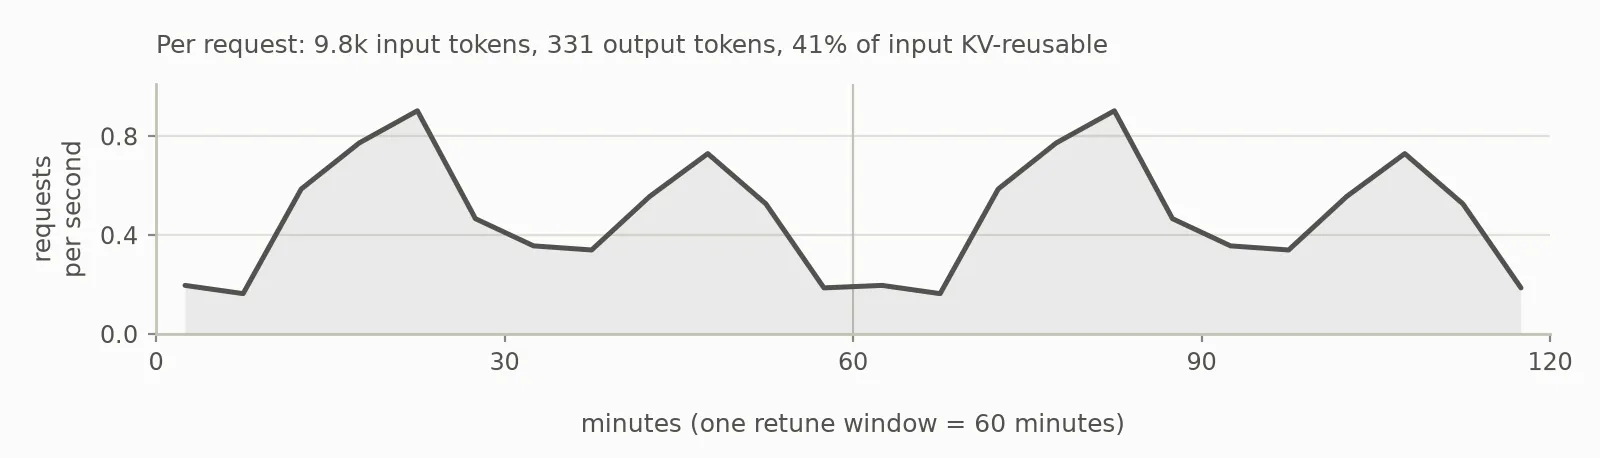
Request rate of the replayed trace in 5-minute bins; KV-reusable input as in Figure 3a. The vertical line marks the end of the first retune window.
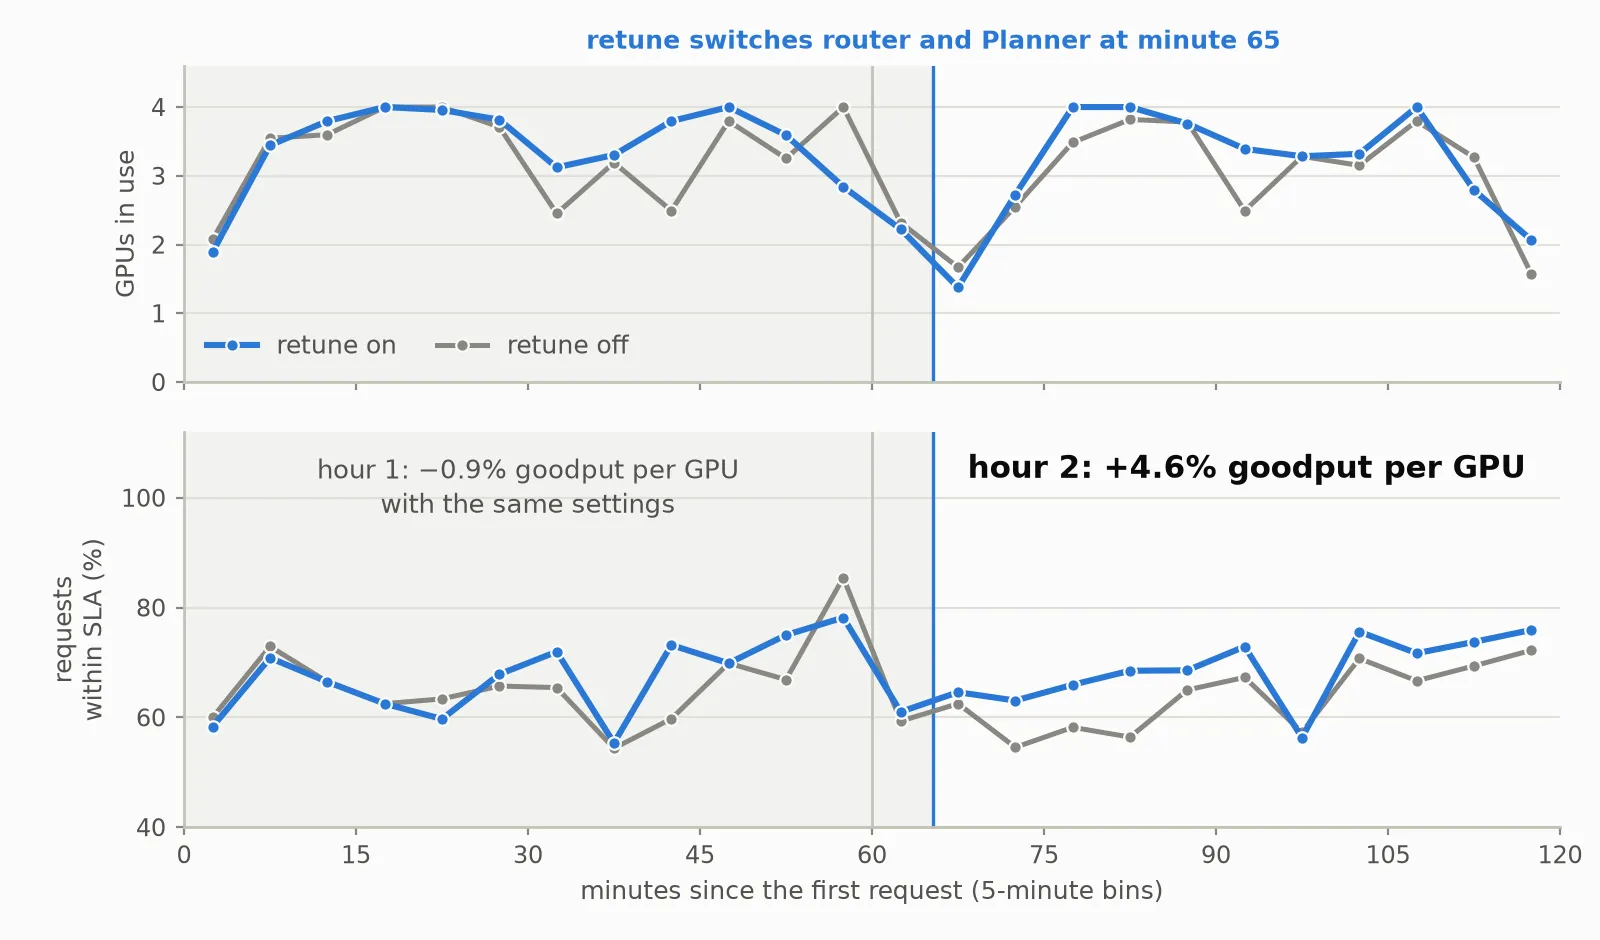
Measured on H200, in 5-minute bins. Top: GPUs in use. Bottom: share of requests within SLA. In the first hour both deployments run the same settings, so the −0.9% difference in goodput per GPU is run-to-run randomness.
Five minutes after the first hour ended, retune changed two settings at once: the router’s prefill_load_scale from 1
to 16 and the Planner’s scale-down sensitivity from 80 to 70. In the second hour the retuned deployment served
+4.6% goodput per GPU and kept 68.6% of requests within SLA versus 62.5% without retune. It used about 5% more
GPUs on average (3.08 versus 2.93), so part of the SLA gain may come from that capacity; goodput per GPU already
divides by it.
Cost and limits
What a sweep costs. The replays are simulations and need no GPU. In these two experiments each sweep ran as four CPU-only pods next to the deployment and scored 108 candidates in about five minutes and 36 in about three.
If a switch does not pay off. Retune decides on simulation alone, and simulated performance can differ from real
deployments. Retune also has no way to monitor whether the new settings really do better than the old ones once they
are live: the next window repeats the search in simulation, and there is no automatic rollback. If that is a concern,
start in advisory mode and check the recommended settings in a small-scale test or an A/B test before you let retune
apply them. To undo a switch by hand, set advisory: true: the Planner then returns the routers to their startup
settings, and a restarted Planner runs its configured values again. See
Disable.
Try it
- Measure the gain on your own traffic first with replay retune: Simulate Retune.
- Then turn it on for a development deployment, in
advisorymode first: Planner Live Retune. - Every field of the
retuneblock is in the Planner configuration reference.