When using the Frame Debugger feature of Linux Graphics Debugger, you may wish to do a deep dive into a specific draw call, in order to analyze your application further. To do this, go to the Frame Debugger menu and select API Inspector. The API Inspector view will open.
There are three different categories of API Inspector navigation.
The first category is laid out like a "virtual GPU pipeline." Note that the control is pinnable, if you wish to have it constantly open, or you can unpin it to conserve space. This pipeline section of the API Inspector consists of the following:
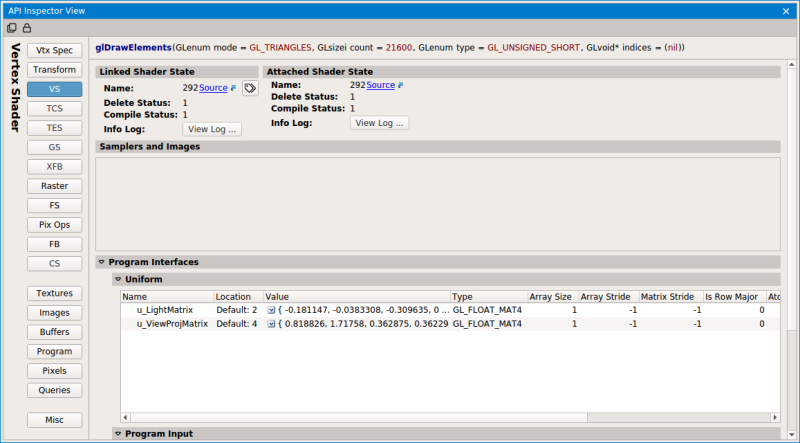
VS (Vertex Shader) | Vertex shader state, including attributes, samplers, uniforms, etc. |
TCS (Tessellation Control Shader) | Tessellation control shader state, including attributes, samplers, uniforms, control state, etc. |
TES (Tessellation Evaluation Shader) | Tessellation evaluation shader state, including attributes, samplers, uniforms, evaluation state, etc. |
GS (Geometry Shader) | Geometry shader state, including attributes, samplers, uniforms, geometry state, etc. |
FS (Fragment Shader) | Fragment shader state, including attributes, samplers, uniforms, etc. |
CS (Compute Shader) | All of the shader resource and unordered access views and constant buffers bound to the Compute Shader stage, as well as links to the source code and other shader information. |
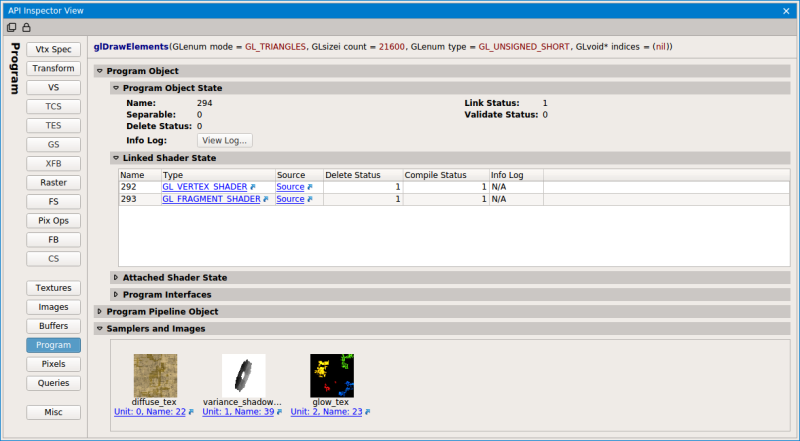
On the shader pages, there is an icon on under the Linked Shader State section; clicking this button will create a new row on the scrubber that highlights where in the scene that particular shader is used.
The object and pixel state inspectors section of the API Inspector consists of the following:
For information on how to dynamically edit a shader from the Program page, see Dynamic Shader Editing.
The miscellaneous screen contains additional information such as shader limits, implementation dependent values, transform feedback limits, and various minimum/maximum values.
![]()
NVIDIA® GameWorks™ Documentation Rev. 1.0.180426 ©2014-2018. NVIDIA Corporation. All Rights Reserved.