The source window includes additional commands in the context menu for debugging.
The Output Window shows build results and debug messages. Selecting the Debug > Windows > Output menu shows the window. If logging is enabled by selecting the Tegra > Windows > Android Log (logcat) menu item, an Android Log pane will be shown and display log messages from the currently selected device (see Device Logging).
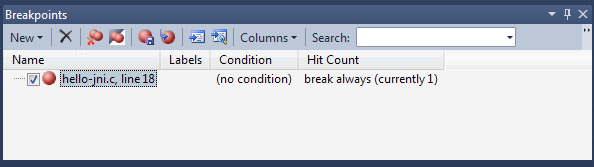
The Breakpoints Window displays information for breakpoints set in the current program. The Debug > Windows > Breakpoints menu shows the window.
Breakpoints that have been set when debugging an application will be re-installed when the program is debugged again. Breakpoints can be set while the program is running. The program will be temporarily suspended and then resumed after the breakpoint is installed.
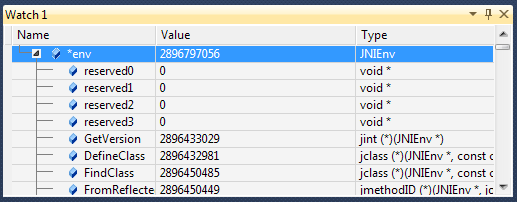
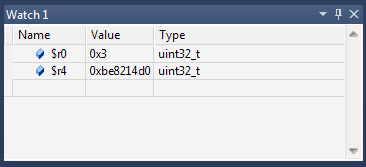
The Watch Window is used to display variable and expression values. The Debug > Windows > Watch menu shows the window. Any valid GDB expression can be entered.
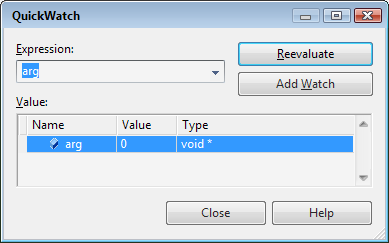
Variables can also be added to the Watch Window by selecting Add Watch from the source window context menu. A variable can be quickly inspected by right-clicking in the source window and selecting QuickWatch…
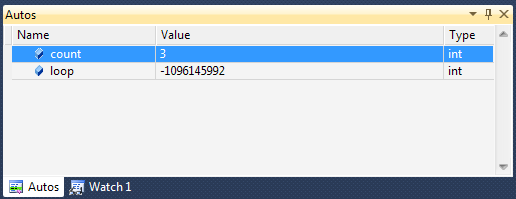
The Autos Window is used to display and edit the values for local variables around the currently executing statement. The Debug > Windows > Autos menu shows the window.
The Immediate Window is to evaluate expressions.
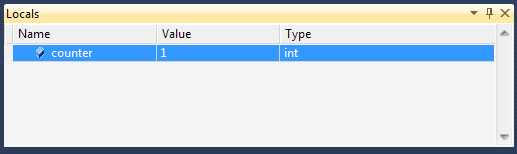
The Locals Window is used to display and edit the values for local variables and function arguments for the current stack frame. The Debug > Windows > Locals menu shows the window.
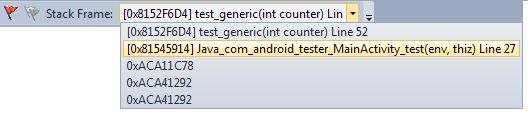
The Call Stack Window displays the names of the current functions on the call stack. The Debug > Windows > Call Stack menu shows the window. The functions can be located in the source window by double-clicking.
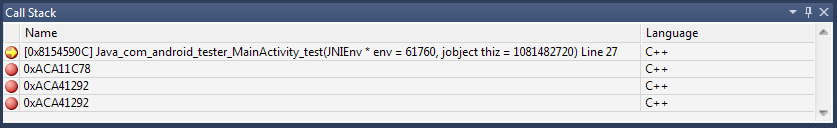
Stack frames can also be selected from the main toolbar.
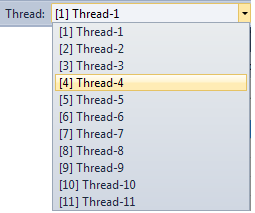
The Threads Window shows information for the current program threads. The Debug > Windows > Threads menu shows the window. Double-clicking on a thread will locate its current location in the source window.
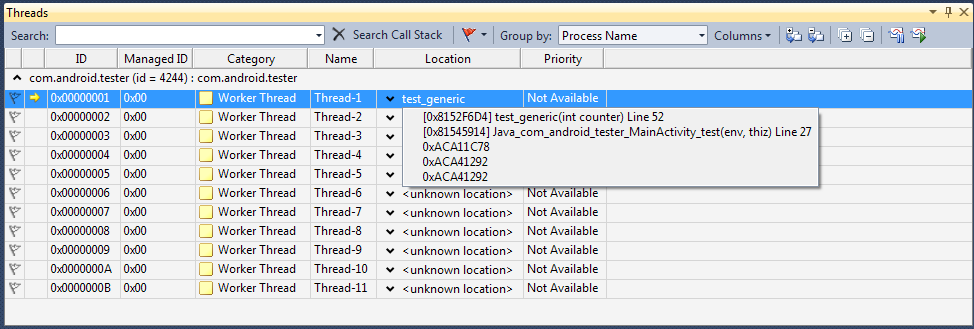
A thread can also be selected from the main toolbar,
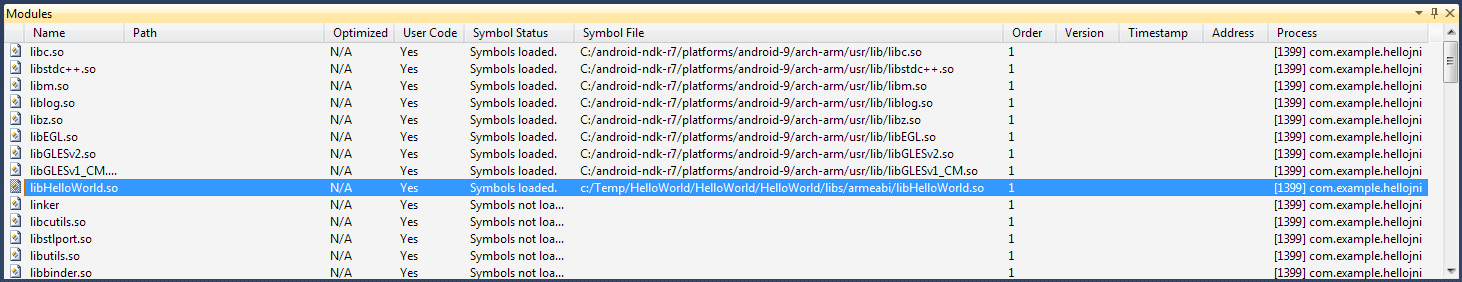
The Modules Window shows information for the currently loaded modules. The Debug > Windows > Modules menu shows the window.
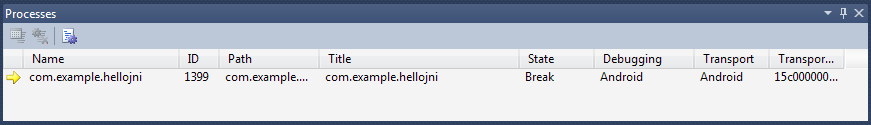
The Processes Window shows information for the current process. The Debug > Windows > Processes menu displays the window.
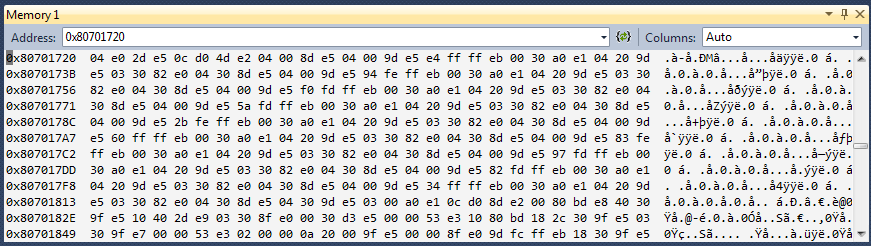
The Memory Window is used to view and edit program memory. Up to four memory views can be opened using the Debug > Windows > Memory menus. Any valid GDB expression can be entered for the address.
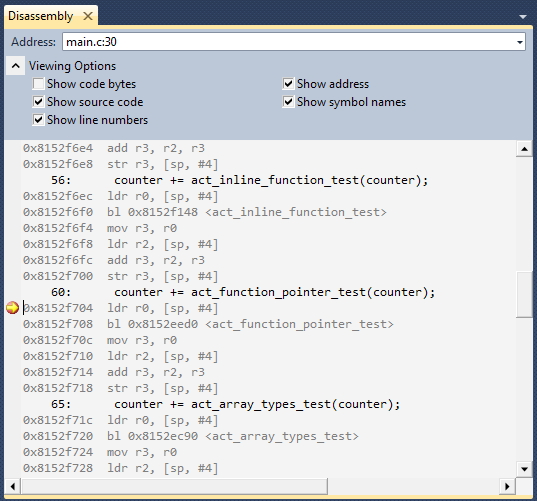
The Disassembly Window is used to display disassembled program code. The Debug > Windows > Disassembly menu opens the window. The window can also be opened by right-clicking in the source window and selecting Go To Disassembly.
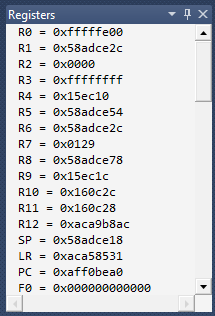
The Registers Window is used to view and edit target core registers. The Debug > Windows > Registers menu opens the window. Registers are written each time a value digit is modified.
Registers can also be displayed and edited using the Watch window (see Watch Window). Enter the lowercase name of the register prefixed with “$” as the watch expression.

NVIDIA® GameWorks™ Documentation Rev. 1.0.211026 ©2014-2021. NVIDIA Corporation and affiliates. All Rights Reserved.