Open topic with navigation
Download and Install TADP
After you download and install the Tegra Android Development Pack, you should have a fully-configured Android development environment ready for development. The Tegra Android Toolkit installs additional Tegra specific tools required to do in-depth debugging and analysis on Tegra devices.
If you are developing on a Tegra Development Kit, please download the latest OS Image and flash the device. This will ensure you have the most up-to-date system with the latest optimizations.
Download TADP
You can download the latest version of TADP from the NVIDIA GameWorks Download Center page.
Installing TADP
When you begin, you will walk through an installation wizard that helps you customize your TADP environment.
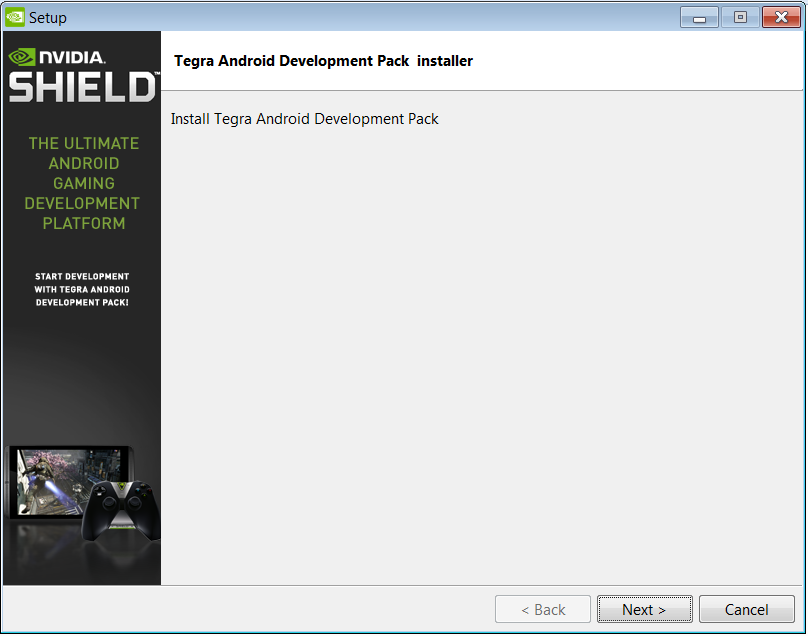
- The first page you see will be the installer welcome page. Click Next.
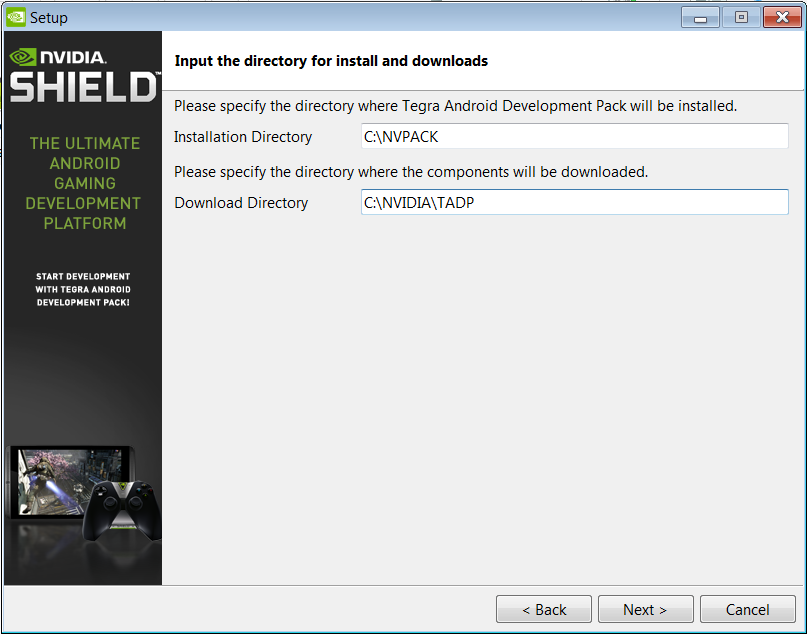
- Enter the directories where TADP will be installed, and where the files will be downloaded. By default, TADP is installed to
C:\NVPACK, and the downloads are saved to C:\NVIDIA\TADP.
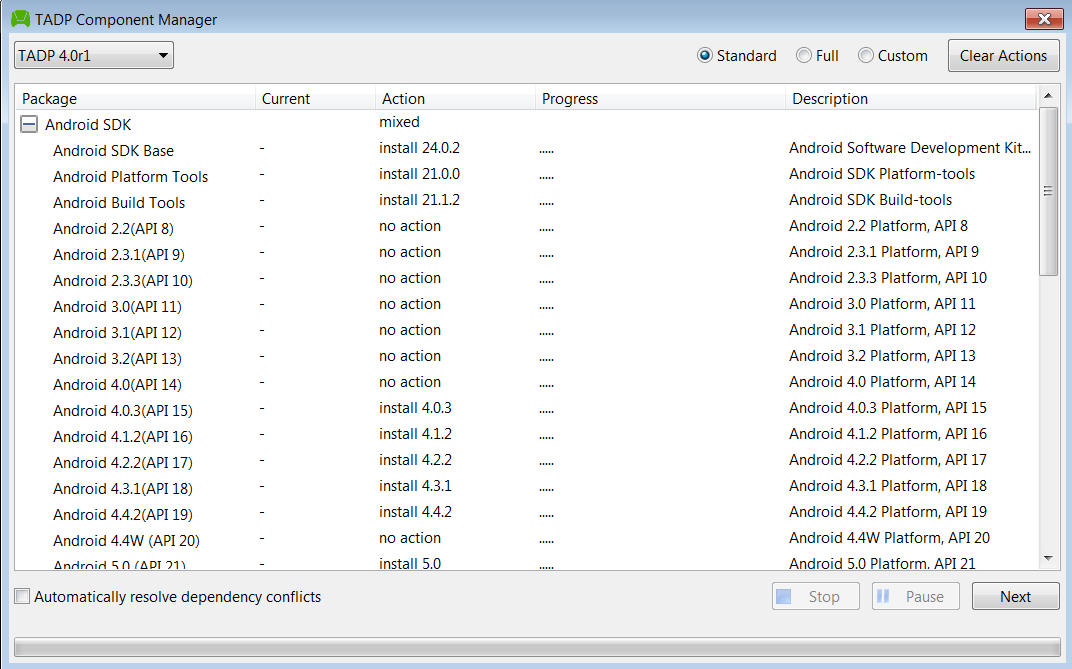
- Next, the TADP Component Manager will open in a new window, and allow you to select whether you want to install a Standard, Full, or Custom version of TADP.
If you selected the Custom installation type, the default options are pre-selected, and you can select or deselect the other components as needed, by choosing the dropdown menu in the Action column for each component.
- After you have selected the components you wish to install, click Next to begin the download and installation process.
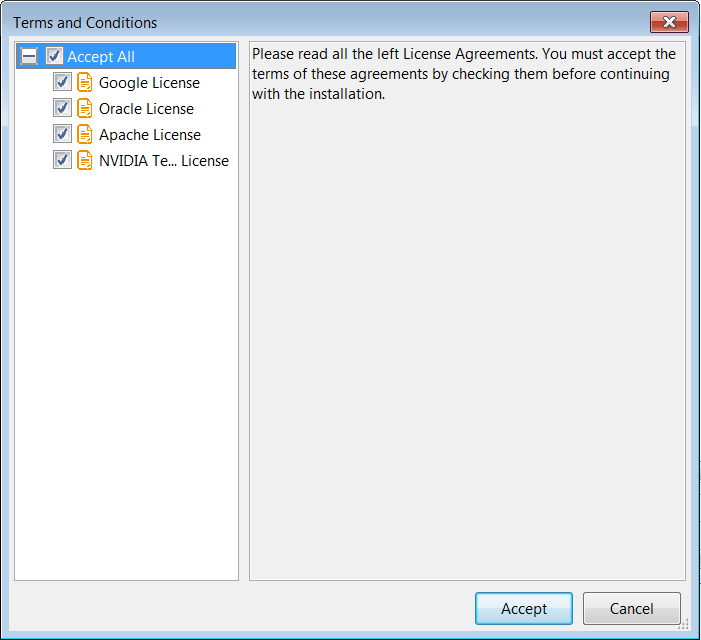
- The license agreements for the components you have selected will be shown in a pop-up menu. Review the license agreements, then click Accept to continue.
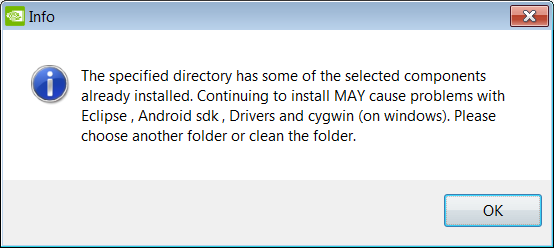
- If you have an older version of TADP installed on your machine, you will get a warning that the old version needs to be uninstalled before you can proceed.
You can do this through the Control Panel, by running C:\NVPACK\tadp_uninstall.exe, or by manually deleting all of the files in C:\NVPACK. Running the uninstaller will require a system reboot.
 |
In some instances, the uninstaller may not clean the system sufficiently to allow the installer to be run. If you encounter this, manually delete the remaining content in C:\NVPACK before running the installer again. |
- Note that depending on your connection speed, the download process may take a long time. If the installer has been previously run, the components will already be cached in
C:\NVIDIA\TADP, and will not need to be downloaded again.
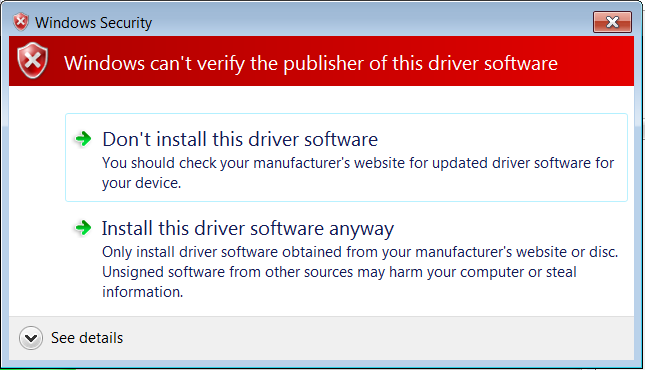
- If you have chosen to install the USB Driver, you may get a pop-up warning that the driver is unverified. Click Install this driver software anyway to continue.
- Installers for other applications will be launched automatically. Some installers may require manual input.
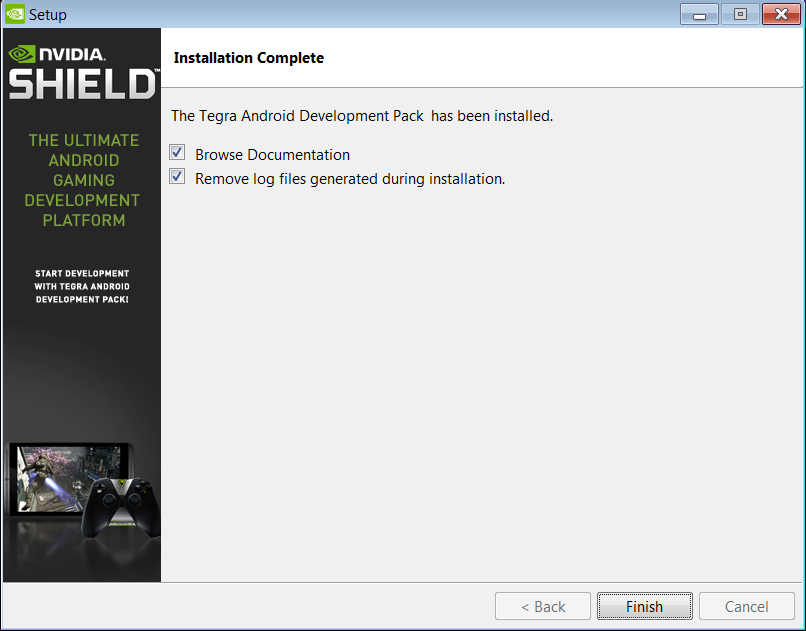
- The main installer menu will appear when installation has completed. Select whether you want to browse the documentation or remove the log files that were automatically generated, then click Finish.
How to Install Drivers
NVIDIA devices are generally compatible with Google's Android drivers, but in some cases, Google drivers will not have the additional device identifiers for automatic recognition. In these cases, you will need to apply drivers manually through the Device Manager in your operating system's Control Panel.
Drivers can be found in the following location:
C:\NVPACK\Drivers\
To install drivers, do the following:
- It is recommended that you re-scan your device list.
- Locate the device in the hardware list. Typically, it will have a yellow triangle with an exclamation point, indicating that it is not fully recognized yet.
 | Note: The device's name may appear different between standard Android Debugging Interface mode and Boot Loader Interface or fastboot mode. The device will not appear as fastboot, unless it has been specifically booted into this mode. |
- Right-click on the device and select to update the drivers.
- Select Browse my computer for driver software.
- Select Let me pick from a list of device drivers on my computer.
- Select Have Disk….
- Select Browse.
- Navigate to the driver folder.
If you are using Windows 8:
C:\NVPACK\Drivers\Win8\
If you are using Windows 7, Vista, or XP:
C:\NVPACK\Drivers\Win7+Vista+XP\
If you are installing drivers for SHIELD:
C:\NVPACK\Drivers\SHIELD\
- Select
android_winusb.inf.
- If the device appears as FastBoot or Android Bootloader Interface, then select Android Bootloader Interface. Otherwise select Android Composite ADB Interface.
- If you are using Windows 8, you may receive a warning that this driver may not be compatible with the device. Select Yes to continue.
This issue will be fixed in future releases.
- If you are using Windows 7, Vista, or XP, you may receive a warning that the driver is not signed. Select Yes to continue.
This issue will be fixed in future releases.
Next Steps
Application Development and Debugging (CPU)
To start developing your Android application, or to debug an existing project in an integrated development environment, launch the Eclipse IDE, found here:
C:\NVPACK\eclipse
You can also debug your applications using Nsight Tegra, which can be launched through Microsoft Visual Studio 2010, or Visual Studio 2012.
Application Profiling (CPU)
To profile your native Tegra Android application, use the Tegra Profiler sampling profiler, found here:
C:\NVPACK\tegra-profiler
Graphics Debugging and Profiling (GPU)
To debug, optimize, and profile your OpenGL ES 2.0, OpenGL ES 3.0, OpenGL 4.x applications on NVIDIA Tegra K1, use Tegra Graphics Debugger tool included with this TADP release.
For more information on Tegra Graphics Debugger, see the Tegra Graphics Debugger Documentation.
To optimize your OpenGL ES 2.0 applications on Tegra 4 or older Tegra devices, use the PerfHUD ES tool, typically found here:
C:\NVPACK\perfhud_es
For more information on PerfHUD ES, see PerfHUD ES: An Introduction.

NVIDIA® GameWorks™ Documentation Rev. 1.0.220830 ©2014-2022. NVIDIA Corporation and affiliates. All Rights Reserved.