

Our Architecture
The engineering challenge behind AV Safety Evaluation stems from the stringency of the safety targets that need to be proven. Most AV safety performance targets are grounded in human benchmarks, and require evidence that the system will not result in a fatality more often than once every 107 to 108 hours of driving1. Naively testing this volume of hours in-car is infeasible. Simulation technology is thus key to establishing these performance bounds, though it immediately raises the question of simulation fidelity.
Volume aside, we face operational challenges of data collection, labeling and curation at vast scale. We must provision data centers to store petabyte-scale driving logs and execute our simulators on them. We must sift through thousands of performance metrics to identify and prioritize safety issues, ground-truth errors, and simulation realism gaps. We contend with questions of how to effectively guard against overfitting in our pipeline, and how to account for compounding errors from many chained automated tools.
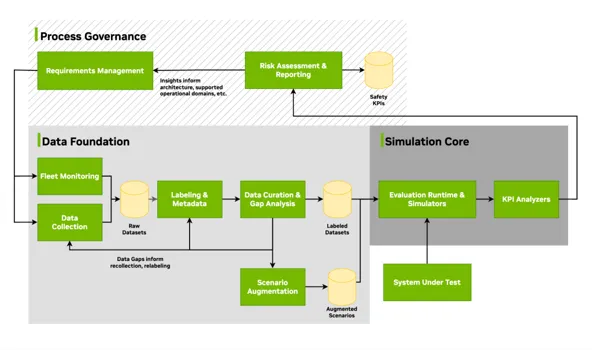
Halos SAFE provides specific and actionable guidelines, along with industry-leading tools that resolve these issues. It allows for the measurement of Key Performance Indicators (KPIs) that provide evidence to support the automotive safety case. It comprises three primary components:
- Process Governance: A safety lifecycle management process for requirements and data-driven risk assessment of KPI results
- The Data Foundation: a set of tools for creating, labeling, curating, and augmenting datasets
- The Simulation Core: a variety of simulators, automated analysis software, and a result visualization platform for generating safety evidence.
The overall safety framework is designed to be cyclic and iterative, where past findings and releases inform new requirements for data, labeling simulation, and analysis. Halos SAFE is a flywheel that generates evidence to support automotive safety cases. We’ll now trace a path through Halos SAFE, walking through each component in detail.
Process Governance: Requirements Management
The core goal of Halos SAFE is to provide statistical guarantees confirming that the system adheres to its safety goals. Simply put, it works on the principle that a safety requirement must not only specify a necessary system property but also define the objective level of certainty required for its validation. As such, the definition and management of these safety concepts and requirements are the starting point of Halos SAFE.
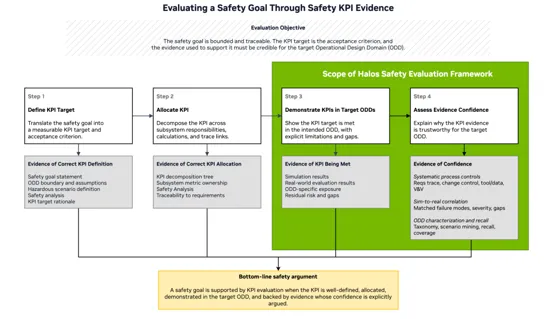
Safety requirements are derived through a first-principles, holistic safety-case-driven approach. We anchor our analysis in the application’s ODD to identify both system malfunctions and risks from environmental triggers, known performance limitations and operational assumptions. These analyses are then translated into safety concepts that allocate safety requirements and acceptance criteria across the system, software, hardware, AI/data lifecycle, and operational controls. The allocated requirements define the technical measures, interfaces, monitoring, redundancy, fault-tolerant behavior, and V&V evidence needed to keep risk within acceptable bounds. For more details on deriving quantifiable safety KPIs and managing triggering conditions within AI and machine learning lifecycles, see Effective and reflective assurance for AI-based autonomy.
This is all brought together in a structured safety assurance argument, also known as the safety case, which demonstrates that residual risk has been brought down to an acceptable level. It is a living document that provides safety assurance not just at initial launch, but throughout the product life cycle. The entire safety case framework is built upon the foundational requirements of industry standards. Standards such as ISO 26262, ISO 21448/SOTIF, ISO PAS 8800, and UL 4600 provide the frameworks to structure and prove these assurance arguments in our safety case. TÜV Rheinland has successfully completed an independent safety assessment for the NVIDIA NDAS SAE Level 4 autonomous system’s safety management planning. Built on the NVIDIA DRIVE AGX Hyperion 10 platform, the system’s Functional Safety, SOTIF, and AI Safety Management planning — along with its V&V strategy — were assessed against ISO 26262, ISO 21448 (SOTIF), and ISO/PAS 8800 standards. Throughout the assessment, NVIDIA demonstrated relevant competencies on the required safety activities and safety-driven processes required for the next generation of autonomous mobility.
Figure 3 below illustrates a representative safety case argument structure in this context.
Each safety requirement can be thought of as tracing a particular path through our safety evaluation framework, touching only the elements necessary for demonstration. Different partners pursuing different autonomy levels may opt to invest in the paths most relevant to their business strategies. As we walk through the components of Halos SAFE, we will use the safety requirements below as illustrative examples of how the different components come together to form a complete safety story.
Table 1: A sampling of illustrative safety requirement examples.
Data Foundation
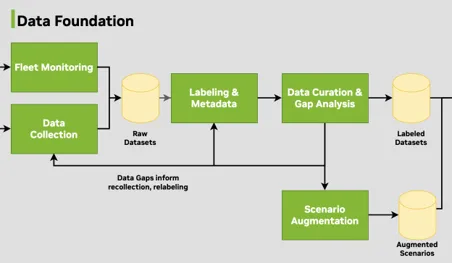
The Data Foundation of Halos SAFE concerns itself with constructing the datasets necessary for safety evaluation, from data collection to labeling, curation, and augmentation.
Data Collection
The primary factors guiding data collection are the volume and distribution of the dataset in question. Demonstrating a 20,000-hour KPI target with 95% confidence requires roughly three times that volume of error-free driving. Furthermore, in order for a statistical argument based on this data to hold water, it must be sampled according to the expected customer distribution. A dataset that overrepresents highway miles, for example, cannot be used to make claims about urban intersection performance. Our fleet therefore requires dedicated tooling to both plan collection operations and to analyze the resulting data they produce, ensuring that volume and distribution targets are met before the data is released into downstream pipelines.
Labeling and Metadata
In order to perform data distribution analysis, as well as to enable many downstream Halos SAFE components, ingested data must be labeled appropriately. Different KPIs come with different labeling requirements, from obstacle cuboids to lane polylines, to weather metadata. NVIDIA has built a host of automated and human-supervised data labeling tools on top of the Hyperion sensor platform that allow us to create relevant labels at scale.
It is important to note that for any such tool, the precision and recall of the labels themselves must be characterized and accounted for in downstream safety arguments. A systematic issue in lane graph autolabels, for instance, can percolate throughout our safety claim and bias the final result.
As an example of the collection and labeling tooling that NVIDIA has built, earlier this year we open-sourced 1,700 hours of labeled data in the Physical AI Autonomous Vehicles Dataset.
Curation and Gap Analysis
60,000 hours of labeled driving logs are a significant amount of data to store and simulate. We note, however, that the L2++ safety requirement in our running example focuses on intersection performance. We may thus curate a significantly more efficient subset of that 60,000 hours for testing, focused on scenarios relevant to the safety requirement at hand. Tailoring datasets to the safety requirements often opens up opportunities for optimizing dataset structure and reducing simulation cost by orders of magnitude.
It is at this stage that we may also identify systematic gaps in our dataset that warrant recollection. NVIDIA leverages a host of traditional statistical methods for this task in conjunction with cutting-edge AI-based tools. Vector embedding search technologies such as NVIDIA Cosmos Dataset Search open up unique opportunities for semantic curation, allowing engineers to find not just driving logs that match on metadata, but logs that match on the underlying driving situation. Gaps identified at this stage feed back into the data collection plan, closing a loop between what the safety requirement demands and what the fleet goes out to capture.
Data Augmentation
While generating a dataset that represents 60,000 hours of intersection traversals is sufficient to prove our statistical performance bounds, certain scenarios may be reasonably foreseeable yet very unlikely to be sampled, falling in the infamous long tail of autonomous driving.
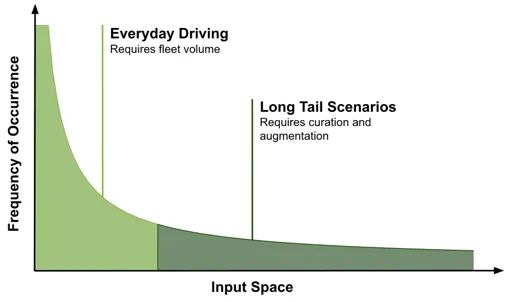
Long tail scenario specifications can be mined from literature and national crash databases, but are inherently rare and sometimes dangerous to collect. Data augmentation technologies are thus an excellent solution for long-tail scenario coverage.
Augmentation can take two forms: synthetic scenario generation and scenario perturbation. While both approaches are valid, at NVIDIA we focus on the latter. During scenario perturbation, an existing log is modified to produce variants of the original encounter – adjusting ego approach speed, shifting the timing of a cross-traffic actor, or introducing a completely new occluding vehicle at a critical moment. NVIDIA NuRec in particular allows us to leverage neural reconstruction to render the perturbed scene at high fidelity. Technologies such as Cosmos Transfer furthermore allow us to expand the operational domain of our testing by modelling environmental effects such as rain, snow, or wildfire smoke.
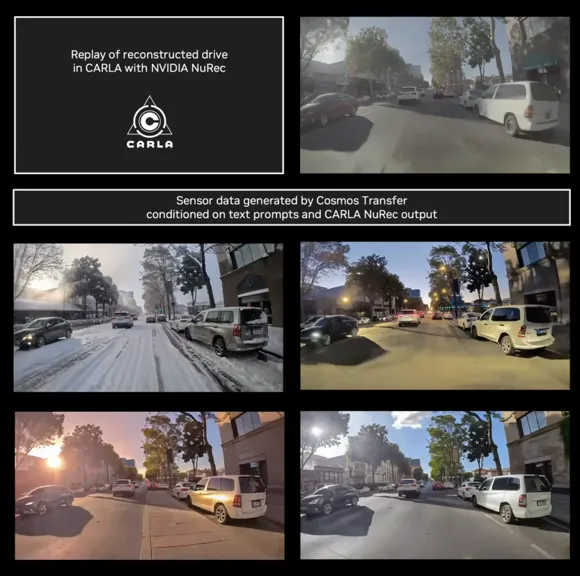
Real driving logs anchor our statistical claims to the true customer distribution, while augmented data ensures rare-but-foreseeable scenarios are represented with sufficient density. As with autolabels, the realism characteristics of our augmentation tooling must themselves be accounted for in downstream safety arguments. Once produced, augmented data enters our pipeline alongside real logs, forming a dataset ready for the Simulation Core.
Fleet Monitoring
Safety requirements need to be proven before a new feature is brought to market. For initial bring-up, this evaluation is typically performed using a dedicated and carefully monitored development fleet. Once a feature is released to the market, customer logs become an immensely valuable data source2. The customer fleet dataset enables post-release KPIs that answer questions such as: were our development-time assumptions about the customer operational distribution accurate? Are measured failure rates consistent with what the deployed fleet experiences? Can we find any scenarios that warrant targeted recollection or augmentation?
Customer datasets can cover orders of magnitude more driving mileage than a development fleet. At this scale, we must rely on the same Data Foundation tooling used elsewhere in Halos SAFE to ingest, store, label, and curate incoming logs – sifting data streams down to the subsets relevant for each safety claim. Fleet monitoring turns the safety case from a one-time bring-up exercise into a continuously maintained property of the deployed system.
Simulation Core
Now that we have constructed a dataset to evaluate our system, we are positioned to simulate our system and produce the safety performance evidence that we are after.
Evaluation Runtime and Simulators
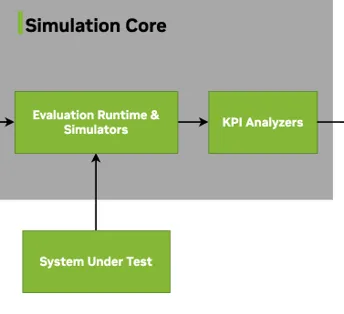
Different safety claims impose different demands on scale, fidelity, and cost of the necessary simulation. Halos SAFE does not prescribe a single simulator. Instead, it provides a menu of simulation technologies, along with guidelines for choosing the right tool for the claim at hand. For our running L2++ intersection example, evaluating collision avoidance during unprotected turns, requires closed-loop simulation with high sensor realism: the system’s actuation must influence the trajectories of surrounding agents, and the rendered sensor stream must be faithful enough that the perception stack behaves as it would in the real world. Contrast this with an AEB false-positive claim, where open-loop replay of recorded sensor data is not only sufficient but orders of magnitude cheaper – the mere presence of a ghost-brake trigger counts as evidence, and there is no need to model downstream vehicle dynamics. The space of possible simulation technologies becomes even more complicated as we start considering HiL & PiL setups where modelling correct behavior requires actual hardware components present in the production vehicle.
At NVIDIA, our most advanced simulators use NuRec – a neural reconstruction and rendering technology that produces photoreal, sensor-accurate recreations of real driving scenes. NuRec allows us to take a recorded log, reconstruct the 3D scene, and re-simulate it in a closed-loop with neurally rendered novel view synthesis. As mentioned in our Data Augmentation section, NuRec allows us to perturb ego behavior and inject new actors in the scene, all while preserving the sensor realism that AI-based perception stacks demand. This capability is what makes claims like our L2++ intersection target tractable: we can take real intersection encounters, simulate novel ego trajectories through the scene, and measure collision outcomes at a scale that is challenging with pure synthetic simulation.
Regardless of which simulator is chosen, its realism must itself be characterized before its outputs can be trusted as safety evidence. A common technique in Halos SAFE is a log-to-sim consistency check: we take a real-world driving log, hold every variable constant – the same vehicle build, the same software version, the same sensor inputs – and re-run it through simulation. Any divergence between what happened on the road and what the simulator reports is a measure of the simulator’s realism gap. Sim realism should be continuously measured throughout the project lifecycle, as both the simulator and vehicle software evolve. These gaps are tracked per claim and factored into the downstream safety argument.
KPI Analyzers
Once the simulation completes, we must analyze the resulting logs to understand which safety requirement-relevant behaviors actually occurred. Halos SAFE pairs simulation with a suite of automated KPI analyzers that consume the simulator’s output alongside ground truth and validate adherence to the safety properties in question. For our L2++ intersection goal, the analyzer checks each simulated intersection traversal for collision events of Severity 2 or greater. For the AEB ghost-brake claim, it detects unwarranted trigger events in nominal driving. Some of our more advanced analyzers encode formally verifiable safety properties within them, such as HJ-Reachability based Safety Zones that NVIDIA has pioneered to understand which obstacles are actually safety-relevant to a given driving task.
A key architectural property of Halos SAFE is the abstraction layer that sits between the simulator, the system under test (SUT), and the analyzer. Each of these three components speaks to the others through a standardized interface, which means any one of them can be swapped without disturbing the rest of the pipeline. We can exchange an open-loop replay simulator for a NuRec-backed closed-loop run, migrate from one version of the SUT to the next, or substitute a human-labeled ground truth source for an auto-labeled one, and the downstream analyzer continues to operate unchanged.
It is worth noting that safety analyzers are typically tuned to err on the side of caution, trading precision for recall. A missed failure is far more costly than a false alarm, and thus a layer of manual review is applied to triage flagged events and separate true failures from benign triggers. This reviewed output is what ultimately feeds the KPI numbers reported to Process Governance.
Process Governance: KPI Analysis and Reporting
Once the evidence supporting our safety case has been generated, we find ourselves once again in the Process Governance section, where we analyze and risk-assess the results.
A raw failure rate is not, on its own, a safety argument. Results must be contextualized against their confidence bands, their data distributions, and the known precision and recall characteristics of the tools that produced them. They must be shown to be free from Risk Transfer3 – situations where failure rates are within specifications, but their distributions are concentrated in unexpected ways.
Our result visualization tools and underlying data science platform are purpose-built to support this analysis, allowing safety engineers to drill from an aggregate KPI down into the individual driving logs, labels, and simulator outputs that contributed to it. This is also where NVIDIA-pioneered statistical tools such as Sim2Val come into play, allowing for efficient quantification of simulation realism in our resulting safety assurance.
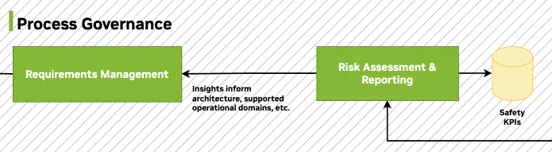
Every piece of safety evidence that Halos SAFE generates is designed to be traced back to a concrete, auditable requirement using our KPI management tools and result visualization platforms. This bookends the overall safety framework by connecting our KPI result analysis and risk assessment back to our requirements management.
The AV Safety Flywheel
As analysis of evaluation results feed back into our requirements management process, a feedback loop is formed, which enables us to iterate, and close performance gaps based on data-driven decision-making.
Table 2: Examples of data-driven decisions that Halos SAFE enables through consecutive iterations of its safety flywheel.
As the product lifecycle progresses, the flywheel is turned until we establish a solid foundation of evidence to support the automotive safety case.
Notes
- Human fatality rates occur at a rate between once every 106 to 107 hours of driving, depending significantly on the geographic region in question. The specific target that autonomous vehicles must be held at is subject to debate, but a rough factor of 10 is often applied over top of the human fatality rate to account for impaired driving and other uncertainties. For the purposes of this document, the targets aim to illustrate the magnitude of the evaluation infrastructure necessary to demonstrate the safe deployment of autonomous vehicles. ↩
- Of course, privacy is a key concern whenever collecting and storing customer data, and any such pipeline must be architected around consent, anonymization, and region-specific regulatory requirements from the outset. ↩
- It is not sufficient to develop an autonomous vehicle with an overall fatality rate lower than that of human drivers. We must also demonstrate that no group of individuals are disproportionately put at higher risk by this system. This concept is well explored in Chapter 5.2 of “How Safe Is Safe Enough” by Philip Koopman, where an example is given of a system that has a higher aggregate safety level than that of humans, but to which most accidents occur with pedestrians in high-visibility vests. Such a system may not be deemed acceptable to deploy. ↩