Metrics#
This section describes some of the common LLM inference metrics. Note that there can be variations in the benchmarking results between different tools. The following diagram illustrates some of the widely used LLM inference metrics.
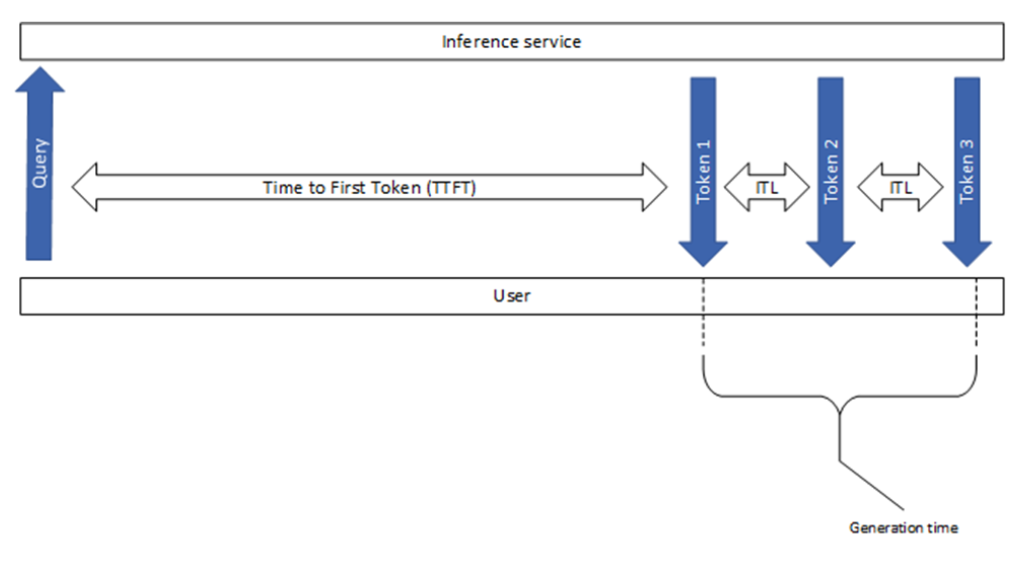
Figure 1. Overview of popular LLM inference performance metrics.#
Time to First Token (TTFT)#
This metric shows how long a user needs to wait before seeing the model’s output. This is the time it takes from submitting the query to receiving the first token (if the response is not empty).
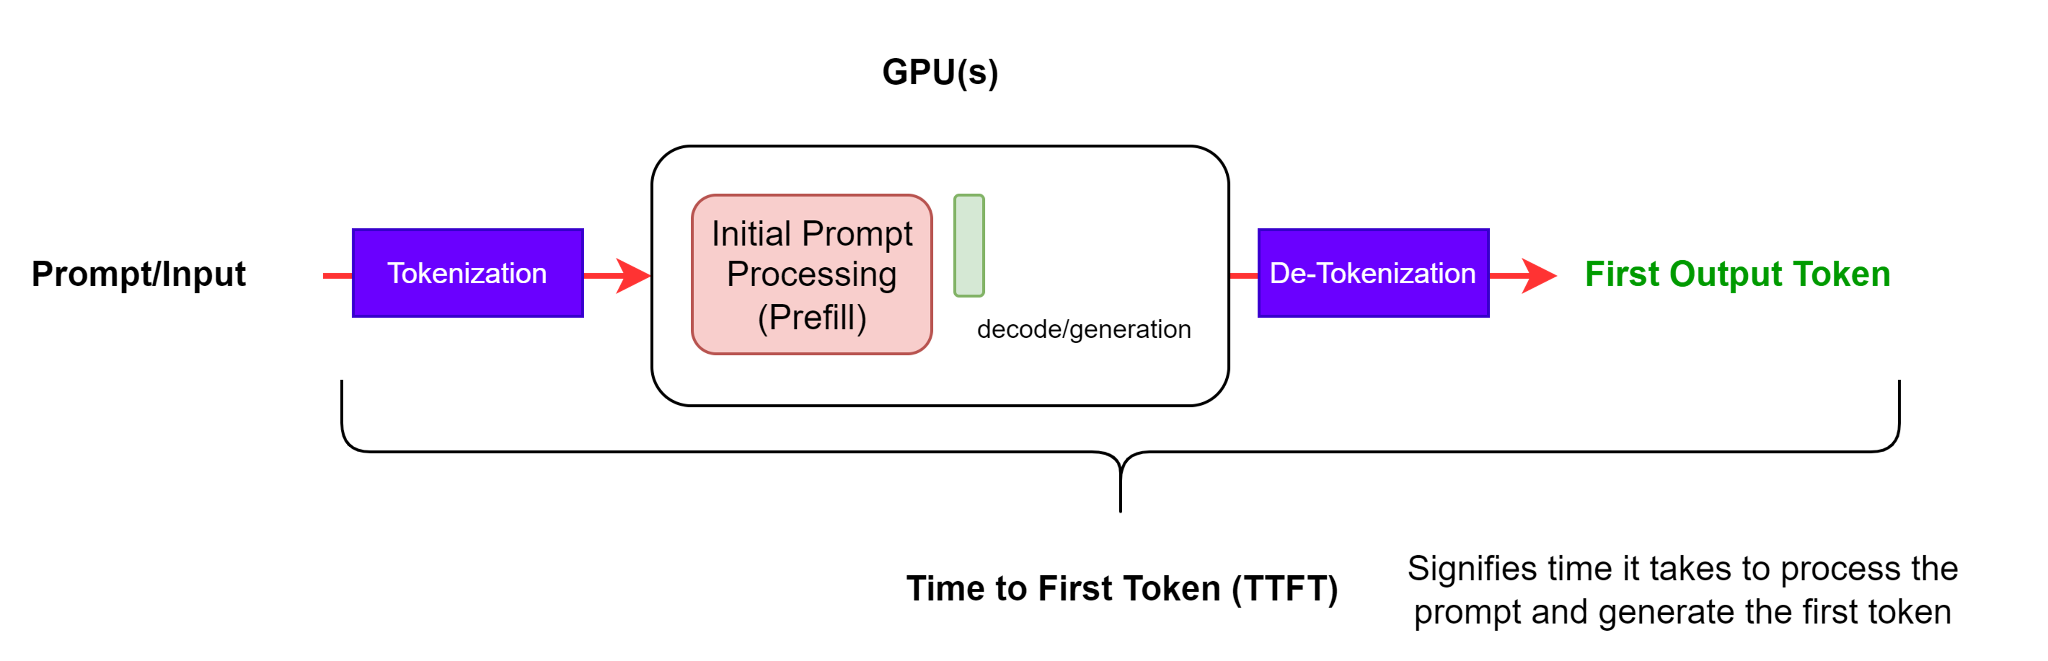
Figure 2: TTFT - Time to First Token including both the tokenization and de-tokenization steps for the first output token.#
Note
Both NVIDIA GenAI-Perf and LLMPerf benchmarking tools disregard the initial responses that have no content or a content with empty string (no token present). This is because the TTFT measurement is meaningless when the first response has no token in it.
Time to first token generally includes both request queuing time, prefill time and network latency. The longer the prompt, the larger the TTFT. This is because the attention mechanism requires the whole input sequence to compute and create the so-called key-value cache (aka.KV-cache), from which point the iterative generation loop can begin. Additionally, a production application can have several requests in progress, therefore one request’s prefill phase may overlap with another request’s generation phase.
Note
Traditional web service benchmarking tools such as K6 can also provide TTFT, via timing events in the HTTP request.
End-to-End Request Latency (e2e_latency)#
This metric indicates how long it takes from submitting a query to receiving the full response, including the performance of your queueing/batching mechanisms and network latencies, as demonstrated in Figure 3.
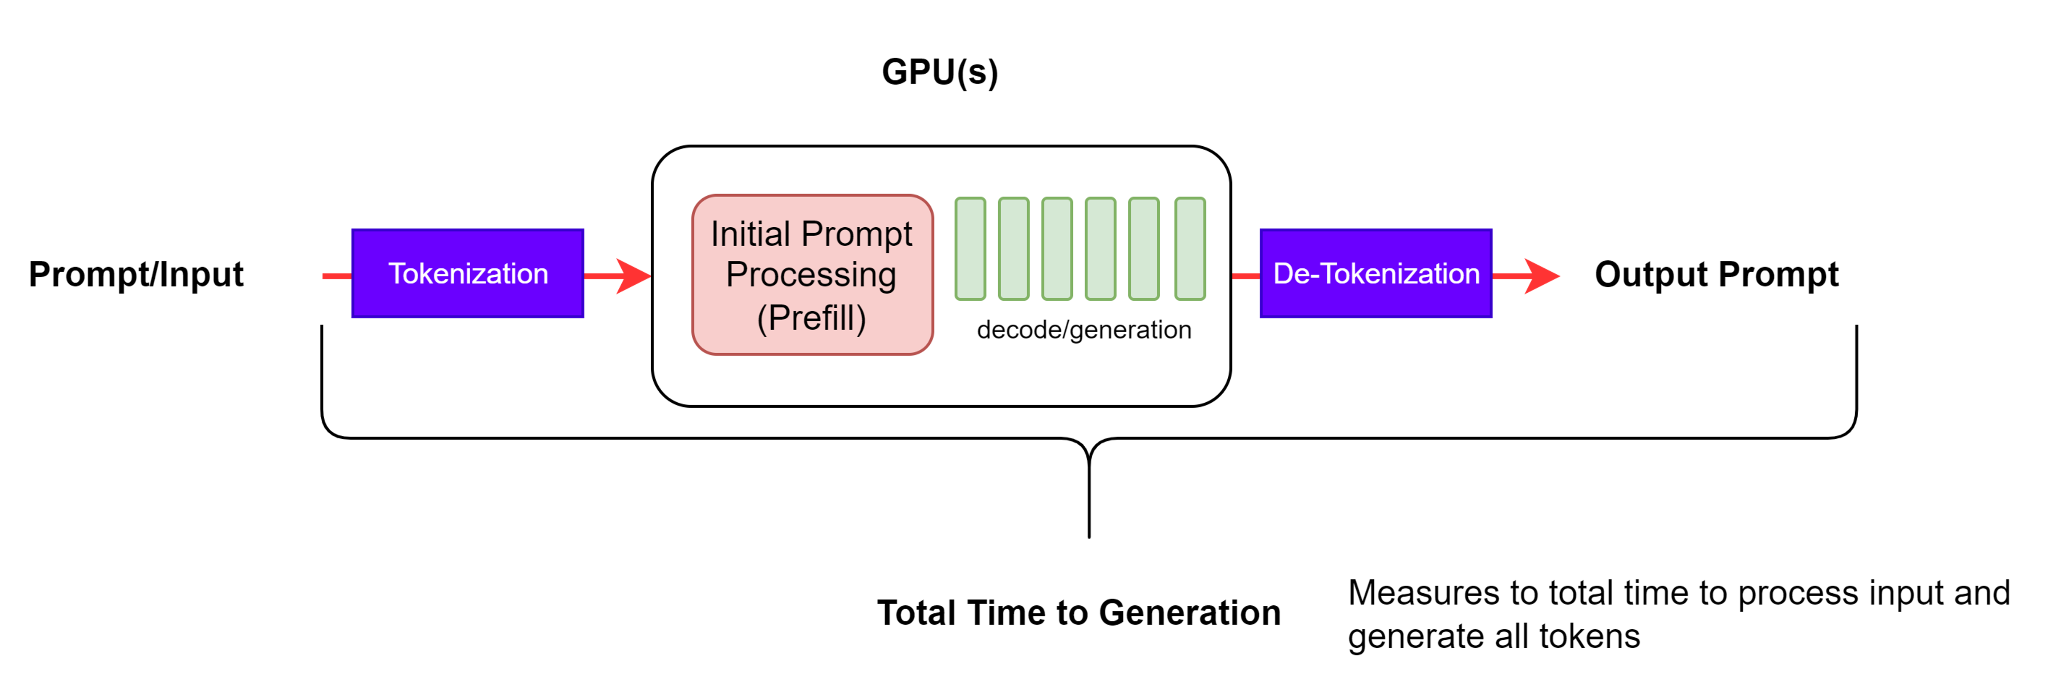
Figure 3. End-to-end Request latency#
Note
In streaming mode, the de-tokenization step can be done multiple times when partial results are returned to the user.
For an individual request, the end-to-end request latency is the time difference between the request sent and the final token received. Therefore:
Note
Generation_time is the duration from the first token received to the final token received, as depicted in Figure 1. In addition, GenAI-Perf removes the last [done] signal or empty response, so they don’t get included in the e2e latency.
Inter-token Latency (ITL)#
This is defined as the average time between consecutive tokens and is also known as time per output token (TPOT).
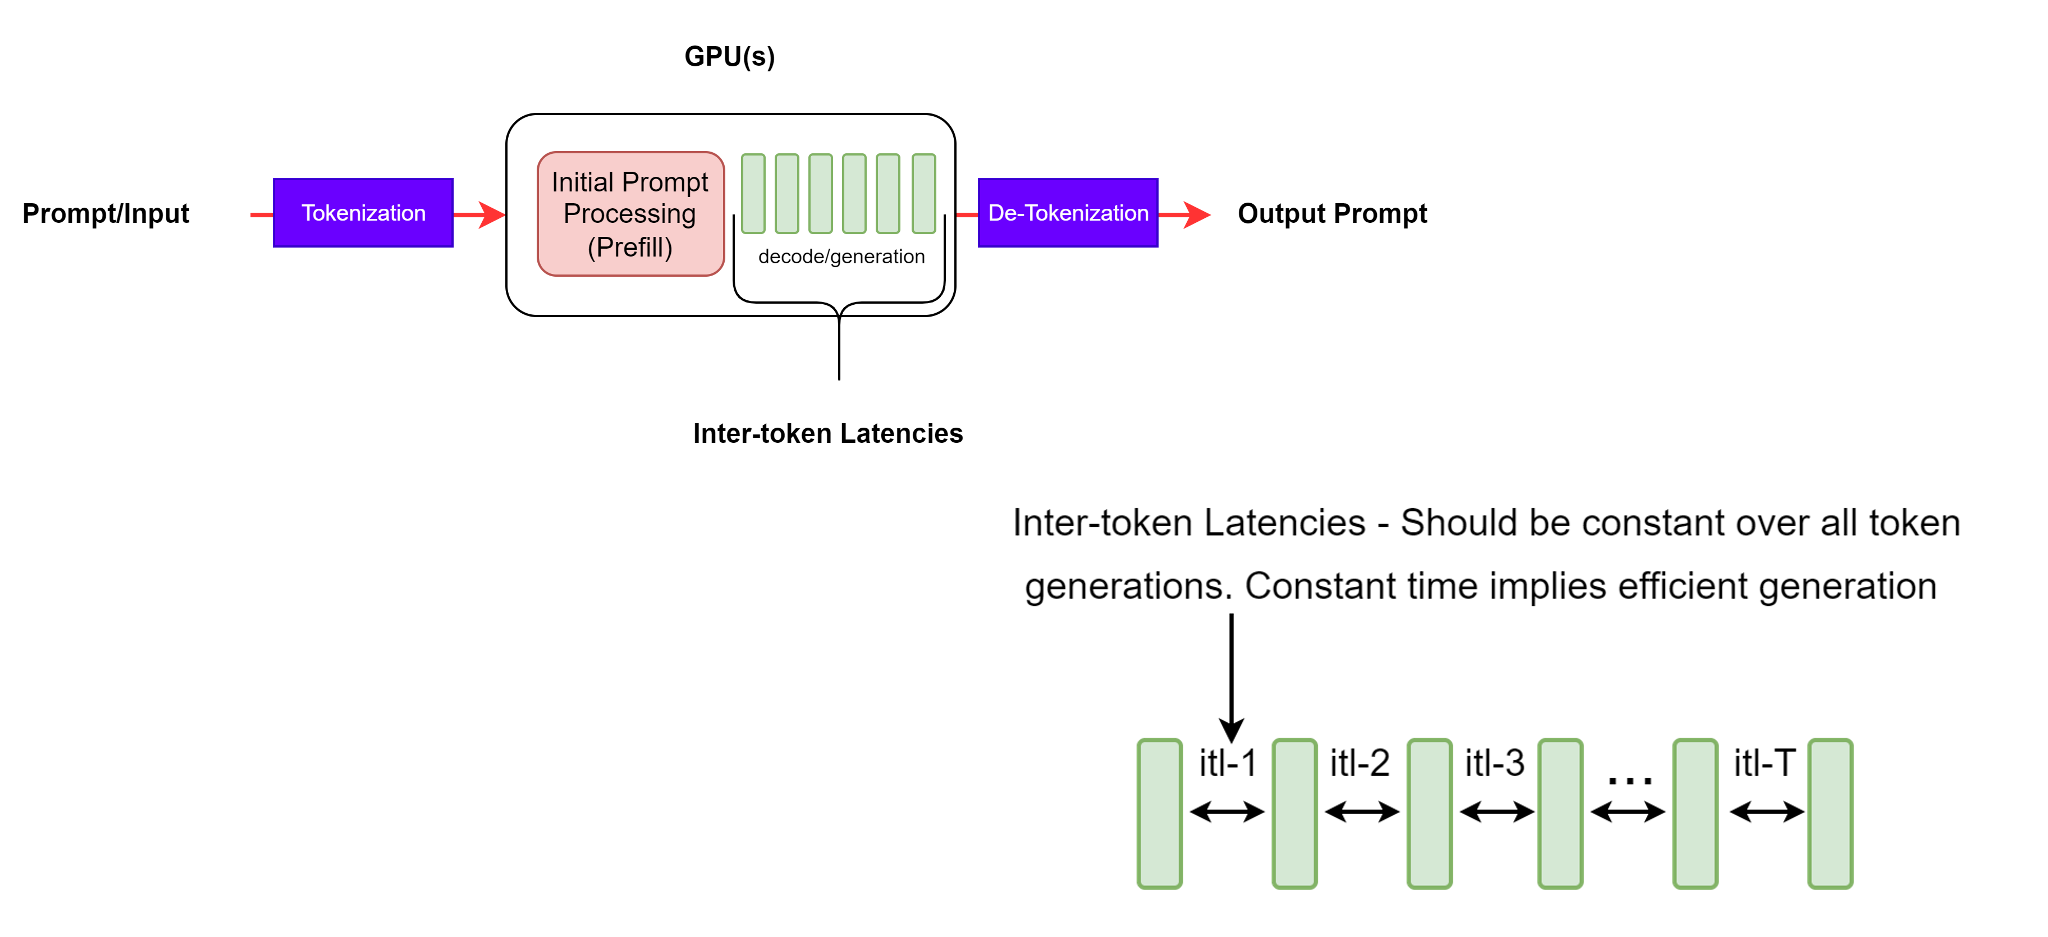
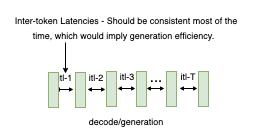
Figure 4: ITL - latency between successive token generations.#
Although this seems a simple and straightforward definition, there are some intricate decisions in which the different benchmarking tools take into account when collecting the metric. Questions such as, should this average calculation include the time to first token (TTFT) or not? NVIDIA genAI-perf does not, while LLMPerf does include this quantity.
GenAI-Perf defines ITL as follows:
The equation used for this metric does not include the first token (hence subtracts 1 in the denominator). This is done in order to have ITL as a characteristic of only the decoding part of the request processing.
It is important to note that with longer output sequences, the KV cache grows and hence the memory cost. The cost of attention computation also grows: for each new token, this cost is linear in the length of the input + output sequence so far (but this computation is generally not compute-bound). Consistent inter-token latencies signifies an efficient memory management, better memory bandwidth as well as efficient attention computation.
Tokens Per Second (TPS)#
Total TPS per system represents the total output tokens per seconds throughput, accounting for all the requests happening simultaneously. As the number of requests increases, the total TPS per system increases, until it reaches a saturation point for all the available GPU compute resources, beyond which it might decrease.
Given the following timeline of the entire benchmark with n total requests.
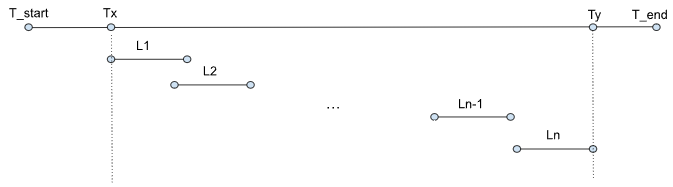
Figure 5: Timeline of events in a benchmarking run#
where
Li : End-to-end latency of i-th request
T_start : start of benchmark
Tx : timestamp of the first request
Ty : timestamp of the last response of the last request
T_end : end of benchmark
GenAI-perf defines the TPS as total output tokens divided by the end-to-end latency between the first request and the last response of the last request.
Note that LLM-perf defines TPS as the total output tokens divided by the entire benchmark duration.
As such, it also includes the following overheads into the metric: (1) Input prompt generation; (2) Request preparation and (3) Storing the responses. In our observation, these overheads in the single concurrency scenario can sometimes account for 33% of the entire benchmark duration.
Note that the previous calculation is done in a batch fashion and is not a live running metric. In addition, GenAI-perf uses a sliding window technique to find stable measurements. This means that the given measurements are from a representative subset of the fully-completed requests, meaning, the “warming up” and “cooling down” requests are not included when calculating the metrics.
TPS per user represents throughput from a single user perspective, and defined as (Output sequence length)/(e2e_latency) for each user’s request, which asymptotically approaches 1/ITL as the output sequence length increases. Note that as the number of concurrent requests increases in the system, the total TPS for the whole system increases, while TPS per user decreases as latency becomes worse.
Requests Per Second (RPS)#
This is the average number of requests that can be successfully completed by the system in a 1-second period. It is calculated as: