

Performance
NVIDIA has greatly optimized the DiffDock inference workflow to improve its performance by optimized CUDA kernels to accelerate the 3D-equivariant graph neural networks and other critical operations in the model.
Accuracy Benchmarks
The DiffDock NIM model (v2.2) has been trained on an expanded dataset that combines the PLINDER dataset with the SAIR (Structurally-Augmented IC50 Repository) dataset. The SAIR dataset augments training with synthetically generated protein-ligand interactions, resulting in improved docking accuracy.
The accuracy benchmarks below compare docking performance across different model versions on H100 GPU:
- Baseline: DiffDock GitHub v1.0
- v2.1: DiffDock NIM trained on PLINDER dataset
- v2.2: DiffDock NIM trained on PLINDER + SAIR datasets
Table 1: RMSD-based Success Rate (%) on H100
Table 2: Docking Rate Success (%) on H100
The expanded training dataset with SAIR simulated data provides consistent accuracy improvements across all metrics compared to the previous version trained on PLINDER alone.
Speed Benchmarks
Speed benchmarks of running the NVIDIA optimized DiffDock NIM compared to the baseline software on different GPU models are displayed in Figure 1 and Table 3. The baseline software used here is the GitHub v1.0 version. The performance metrics are measured by time cost of running 92 docking inference tasks, each of which is set to generate 10 poses with other runtime parameters are set as default values. More details about the hardware platform and the benchmark dataset can be found in the next two sections.
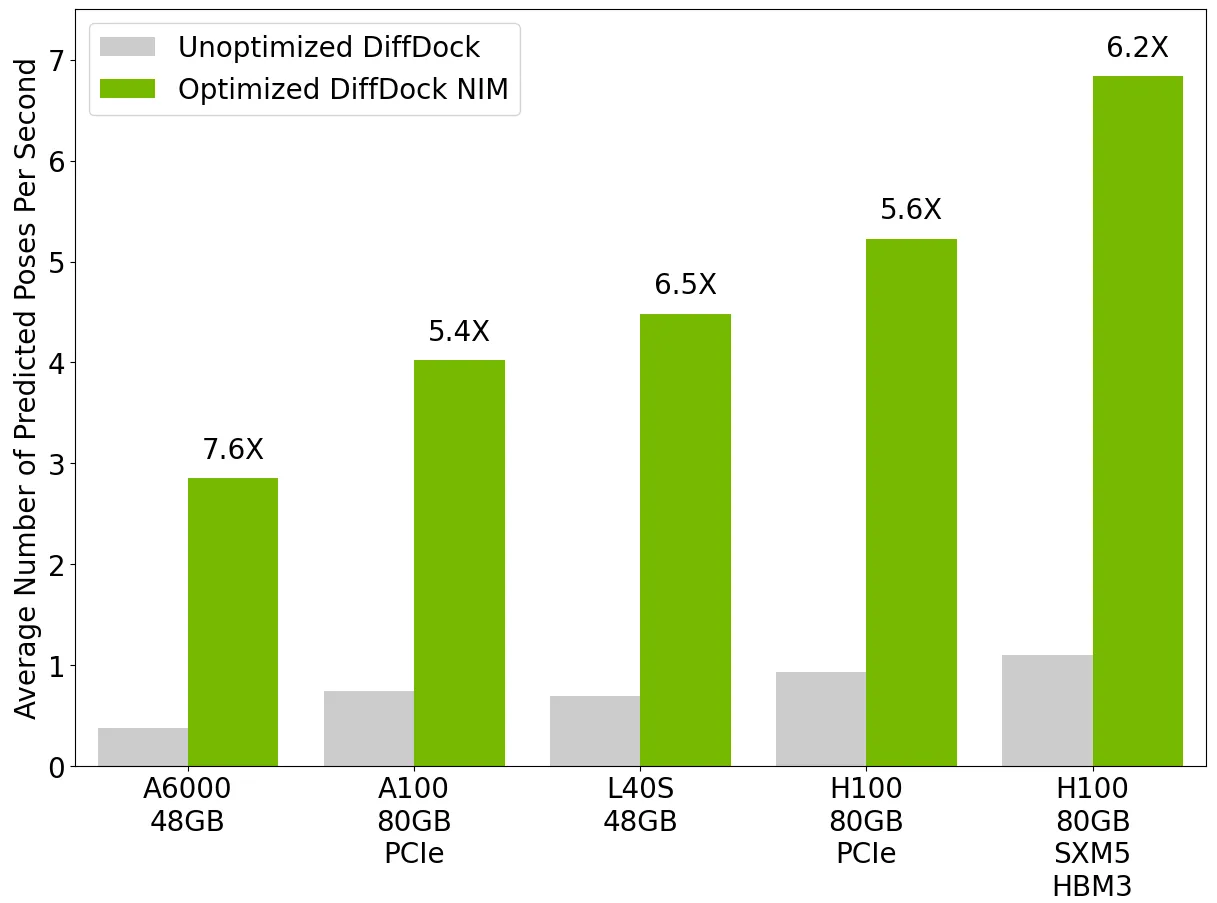
Figure 1
Table 3: Speed Benchmarks
Benchmark Hardware
The full hardware specifications and OS to generate the benchmarks are listed below:
All systems are installed with Ubuntu 22.04 LTS operating systems.
Benchmark Data
The 92 protein-ligand complex systems are selected as a sub-group to the PoseBusters dataset, which is a research work published here. The full data set can be downloaded from Zenodo.
The complex IDs for the 92 systems are below: