User Guide
How To Setup and Inspect GPU Crash Dumps
This section describes how to use the NVIDIA Nsight Aftermath Monitor to generate GPU crash dumps for applications using the Direct3D 12 or Vulkan API, and how to open and inspect those GPU crash dumps with the crash dump inspector plug-in in Nsight Graphics.
Alternatively, developers can also add GPU crash dump collection support into their graphics application using the NVIDIA Nsight Aftermath SDK.
Workflow
The general workflow for working with Nsight Aftermath GPU crash dumps is to:
Run the NVIDIA Nsight Aftermath GPU Crash Dump Monitor.
Configure the desired GPU crash dump features.
Optional: if you want to collect additional information via event markers, you can optionally instrument the graphics application using the Aftermath SDK.
Run the graphics application for which to capture GPU crash dumps and reproduce the GPU crash or hang, allowing the monitor to collect the GPU crash dump.
Open the GPU crash dump in Nsight Graphics.
Configure GPU Crash Dump Inspector settings.
Inspect the crash dump data using the Nsight Graphics crash dump inspector.
See the sections below for details on each step of this process.
The GPU Crash Dump Monitor
The NVIDIA Nsight Aftermath Crash Dump Monitor provides the means to capture GPU crash dump files for GPU crashes or GPU hangs, and to modify the driver configuration settings related to crash dump generation.
Running the GPU Crash Dump Monitor
The NVIDIA Nsight Aftermath Monitor nv-aftermath-monitor.exe is installed to the Nsight Graphics host directory. Typically this is:
<install directory>\host\windows-desktop-nomad-x64
The crash dump monitor application will by default start in the background. Its user interface is accessible through the NVIDA Nsight Aftermath Monitor icon in the Microsoft Windows system notification area (system tray).
Configuring the GPU Crash Dump Monitor
All configuration options related to GPU crash dump creation are available through the GPU Crash Dump Monitor Settings dialog.
Set up directory where crash dump files are stored.
Set up directory where shader debug information files are stored.
Enable Aftermath GPU Crash Dump collection. Either set Aftermath mode to Global to enable crash dumps for all applications using the D3D12 or Vulkan API or selectively enable it for one or more applications by managing an application Whitelist.
Enable the desired Aftermath graphics driver features:
Generate Shader Debug Information to generate shader debug information (line tables for mapping from the shader IL passed to the NVIDIA graphics driver to the shader microcode executed by the GPU) for all shaders loaded by the application.
The GPU Crash Dump Monitor will store the debug information into files with the
.nvdbgextension in the Debug Info Dump Directory directory configured in the General Settings Tab of the GPU Crash Dump Monitor Settings.The shader debug information is required for mapping shader microcode instructions of active or faulted shader warps to shader IL or shader source lines.
See also the section about Source Shader Debug Information for details on how to compile shader source with source-level debug information.
Enable Resource Tracking to enable additional driver-side tracking of live and recently destroyed resources.
This allows Aftermath to identify resources related to GPU virtual addresses seen in the case of a crash due to a GPU page fault. The resource information being tracked includes details about the size of the resource, its format, and the current deletion status of the resource object. D3D12 developers may also consider instrumenting the application using the
GFSDK_Aftermath_DX12_RegisterResourcefunction to register the D3D12 resources the application creates. That will allow Aftermath to track additional information, such as the resources debug names set by the application. For Vulkan applications, the resources debug names set viavkSetDebugUtilsObjectNameEXTwill be captured, too.Enable Call Stack Capturing to enable automatic generation of Aftermath event markers for tracking the origin of all draw calls, compute and ray tracing dispatches, ray tracing acceleration structure build operations, or resource copies initiated by the application.
The automatic event markers are added into the command stream right after the corresponding commands with the CPU call stacks of the functions recording the commands as the data payloads.
Note
Enabling this feature will cause considerable driver overhead for gathering the necessary information.
Note
When this feature is enabled the GPU crash dump file may contain the file path for the crashing application’s executable as well as the file paths for all DLLs or DSOs it has loaded.
Enable Shader Error Reporting to enable a special mode that allows the GPU to report additional runtime shader errors. This may provide additional information when debugging hangs, crashes or unexpected behavior related to shader execution.
Enabling this feature may result in additional crash dumps reporting issues in shaders that exhibit undefined behavior or have hidden bugs, which so far went unnoticed because by default the HW silently ignores them. The additional error checks that are enabled when using this option will cause GPU exceptions for the following situations:
Accessing memory using misaligned addresses, such as reading or writing a byte address that is not a multiple of the access size.
Accessing memory out-of-bounds, such as reading or writing beyond the declared bounds of (group) shared or thread local memory or reading from an out-of-bounds constant buffer address.
Accessing a texture with incompatible format or memory layout.
Hitting call stack limits.
Note
This feature is only supported with NVIDIA graphics driver R515 or later.
Note
On Windows, modifying Aftermath graphics driver settings requires Windows Administrator privileges. Therefore, when any of these settings are modified and applied, a User Account Control confirmation window may pop up asking for permission to modify system settings.
Enable the desired Aftermath systemwide features:
Enable SM Register Data Collection to collect SM register values when faults happen inside SMs. This can provide additional information when debugging GPU crashes related to shader execution.
Since this is a system setting, modifying it might also affect other tools such as Nsight VSE CUDA debugger and may result in unexpected behavior! On Linux, this feature is always enabled without incompability with other tools.
Note
This feature is only supported for the D3D12 and Vulkan APIs with NVIDIA graphics driver R535 or later and requires Nsight Graphics Pro to visualize the data.
Note
On Windows, modifying Aftermath system settings requires Windows Administrator privileges. Therefore, when any of these settings are modified and applied, a User Account Control confirmation window may pop up asking for permission to modify system settings.
The GPU Crash Dump Inspector
The NVIDIA Nsight Aftermath Crash Dump Inspector provides the means to open, inspect, and analyze GPU crash dump files created by the NVIDIA Nsight Aftermath Monitor.
Loading GPU Crash Dump Files
GPU crash dump files use the .nv-gpudmp file extension and can be loaded through File > Open File... This will bring up a GPU Crash Dump Inspector window displaying the crash dump file’s content.
Configuring the GPU Crash Dump Inspector
In order to use all functionality provided by the GPU crash dump inspector, the following configuration settings should be made in the Search Paths Settings.
Add the directories where binary shader files (DXIL or SPIR-V shader files) are stored to Shader Binaries. If the binary shaders cannot be found, the Shader View will not be able to display intermediate shader assembly code or shader source code.
For more information on how to generate these files, see Source Shader Debug Information.
Add the directories where the separate shader debug information files (
.lldor.pdbfiles generated bydxc.exefor instance) are stored to Separate Shader Debug Information. If the shader debug information cannot be found, the Shader View will not be able to map GPU PC addresses of active or faulted warps to intermediate shader assembly or shader source code locations.For more information on how to generate these files, see Source Shader Debug Information.
Add the directories where the NVIDIA shader debug information files generated by the GPU crash dump monitor are stored to NVIDIA Shader Debug Information. If the NVIDIA shader debug information cannot be found, the Shader View will not be able to map GPU PC addresses of active or faulted warps to intermediate shader assembly or shader source code locations.
Optionally, add the directories where shader source files are stored to Shader Source. Usually, this is not required as the shader debug information already includes the shader source. Only if a shader was compiled from source that contains references to other source files, for example via
#linedirectives, may it be necessary to specify additional source directories so that the Shader View will be able to find the correct shader source.Add the directories where to find the symbol files for the graphics application for which the GPU crash dump has been captured to Application Debug Information. This allows the Aftermath Marker Call Stack View to resolve addresses to functions and source locations.
Inspecting GPU Crash Dump Files
Use the GPU Crash Dump Inspector to analyze crash reasons. This is not an exhaustive tutorial on how to analyze GPU crash dumps, because every crash or hang is different, but it should provide some hints to get started.
After loading a crash dump file, it is usually a good start to check the Exception Summary on the Dump Info tab. This will show a high-level fault reason, e.g. whether the graphics device was hung or an error like a page fault has occurred. If there was a page fault or shader fault, this section will contain an analysis which mentions potential causes and provides links to relevant information in the Crash Info tab and Shader View.
In case of a hang it makes sense to check if there is an Active Warps section on the Dump Info tab showing shader activity. This could point towards an issue with very long running shader warps or shader warps being stuck in an infinite loop. In that case the Shader View may help to root cause the problem.
If the device state indicates there was a memory fault, the next step would be to look for a Page Fault section on the Dump Info tab. This may help to pin point problems with out-of-bounds resource access or accessing an already deleted resource.
If the application was instrumented with Aftermath Event markers, a Aftermath Markers section should be available on the Dump Info tab. This may help to pin point the draw or dispatch call that caused problems.
If Call Stack Capturing was enabled when capturing the GPU crash dump, Call Stack links should be available in the Aftermath Markers section, pointing to the draw, dispatch, or copy call that may be related to the problem.
Last, the GPU State section on the Dump Info tab may provide some hints about which parts of the graphics pipeline were active or have faulted when the crash occurred.
Instrumenting Applications with the Aftermath API
The NVIDIA Nsight Aftermath SDK provides the Aftermath API that can be used by developers to instrument their applications. The latest version can be downloaded from https://developer.nvidia.com/nsight-aftermath.
Detailed information about the functionality provided by the library and how to use it in an application can be found in the Readme.md that comes with the SDK package and the header files.
Aftermath Event Markers
In D3D applications, the Aftermath event marker API (GFSDK_Aftermath_SetEventMarker) can be used to inject event markers with user defined data directly into the graphics command stream. If the application is instrumented with event markers, information about the last event markers that were processed by the GPU for each command stream will be captured into the GPU crash dump, including the user provided event data.
Note
Using event markers should be considered carefully. Injecting markers in high-frequency code paths can introduce high CPU overhead. Therefore, on some driver versions, the event marker feature is only available if the Nsight Aftermath GPU Crash Dump Monitor is running on the system. This requirement applies to R495 to R530 drivers for DX12 and R495+ drivers for DX11. No Aftermath configuration needs to be made in the Monitor. It serves only as a dongle to ensure Aftermath event markers do not impact application performance on end user systems.
Similar functionality is available for Vulkan applications with the VK_NV_device_diagnostic_checkpoints extension.
Source Shader Debug Information
For mapping shader instruction addresses for active or faulted shader warps to high-level shader source, shaders need to be compiled with debug information. Since shader compilation is a two-step process - compilation from shader source, such as HLSL or GLSL, to an intermediate shader language representation, such as DXIL or SPIR-V, and graphics driver-level compilation of the shader IL to the actual microcode executed by the GPU - there are two levels of debug information required to accomplish such a mapping. This section describes how to compile shader source code with debug information suitable for consumption by the Aftermath GPU Crash Dump Inspector using the Microsoft DirectX Shader Compiler or the Vulkan SDK toolchain for shader compilation.
The generation of shader debug information for the microcode level needs to be enabled either through the Nsight Aftermath GPU Crash Dump Monitor settings or Aftermath feature flags when using the Nsight Aftermath SDK.
To enable shader instruction mapping when analyzing crash dumps in Nsight Graphics, the debug information must be made available by setting the Search Path Settings as described in Configuring the GPU Crash Dump Inspector.
For D3D12, the following variants of compiling shaders with debug information using the Microsoft DirectX Shader Compiler (dxc.exe) are supported by Aftermath:
Compile and use full shader blobs: Compile the shaders with debug information. Use the full (i.e., not stripped) shader binaries when running the application and make them accessible to Nsight Graphics when inspecting GPU crash dumps by adding the disk location where the compilation results are stored to the Shader Binaries search paths.
An example command line may look like this:
dxc -Zi [..] -Fo shader.bin shader.hlsl
Compile and strip: Compile the shaders with debug information, then strip off the debug information. Use the stripped shader binaries when running the application and make both stripped and not stripped files accessible to Nsight Graphics when inspecting GPU crash dumps. Add the disk location of the stripped files to the Shader Binaries search path and add the disk location of the not stripped files to the Separate Shader Debug Information search paths.
An example command line may look like this:
dxc -Zi [..] -Fo full_shader.bin shader.hlsl
dxc -dumpbin -Qstrip_debug -Fo shader.bin full_shader.bin
Compile with separate debug information: Compile the shaders with debug information and instruct the compiler to store the debug meta data in separate shader debug information files (shader PDB files). Make both the shader binaries and the shader debug information files accessible to Nsight Graphics when inspecting GPU crash dumps. Add the disk location of the shader binaries to the Shader Binaries search path and add the disk location of the shader debug information files to the Separate Shader Debug Information search paths.
An example command line may look like this:
dxc -Zi [..] -Fo shader.bin -Fd debugInfo\ shader.hlsl
If the application compiles shaders on-the-fly, it needs to store the shader binary blobs to disk in a similar fashion so that they are accessible to Nsight Graphics when inspecting GPU crash dumps.
Note
No IL-level or source-level shader mapping is supported for DX bytecode shaders generated by the legacy Microsoft DirectX fxc.exe shader compiler.
For Vulkan, the following variants of generating SPIR-V shader code with debug information are supported by Aftermath:
Compilation using the glslangValidator tool of the Vulkan SDK’s shader compilation toolchain. An example command line may look like this:
glslangValidator -V -g -o shader.spv shader.vert
Compilation using the Microsoft DirectX Shader Compiler. An example command line may look like this:
dxc -spirv -Zi [..] -Fo shader.spv shader.hlsl
Use the full (i.e., not stripped) SPIR-V shader binaries when running the application and make them accessible to Nsight Graphics when inspecting GPU crash dumps by adding the disk location where they are stored to the Shader Binaries search paths.
Note
No source-level shader mapping is supported for pairs of stripped and not stripped SPIR-V files. Users interested in shader source mapping for applications shipping with stripped SPIR-V shaders may use the GPU crash dump decoding functionality provided by the Nsight Aftermath SDK and implement their own crash dump decoding tool.
GPU Crash Dumps
GPU Crash Dump Monitor
GPU Crash Dump Monitor Settings
To configure the NVIDIA Nsight Aftermath Monitor settings, left-click the NVIDIA Nsight Aftermath Monitor icon in the Microsoft Windows system notification area (system tray) or right-click the icon and select the Settings option from the pop-up menu.
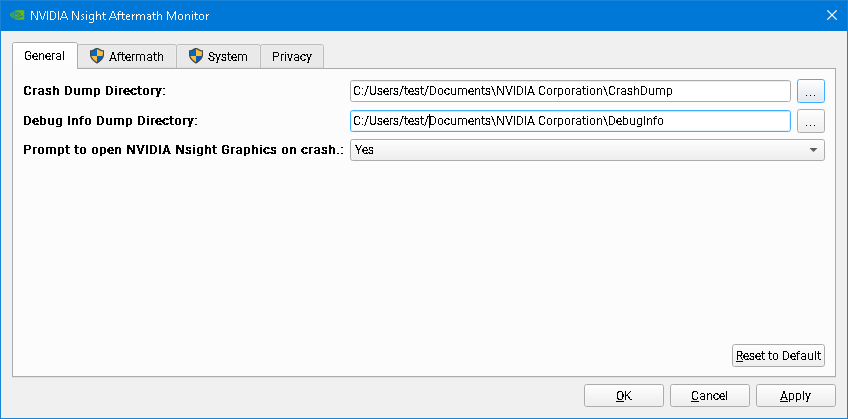
General Settings
The General Settings page allows to configure the directory where GPU crash dumps will be stored, the directory where NVIDIA shader debug information files are stored, and whether the NVIDIA Nsight Aftermath Monitor should prompt to open newly crash dumps in Nsight Graphics.
Aftermath Settings
The Aftermath Settings page allows you to configure various options that control Nsight Aftermath graphics driver features and allows you to select for which applications GPU crash dumps will be captured.
Note
On Windows, modifying Aftermath graphics driver settings requires Windows Administrator privileges. Therefore, when any of these settings are modified and applied, a User Account Control confirmation window may pop-up asking for permission to modify system settings.
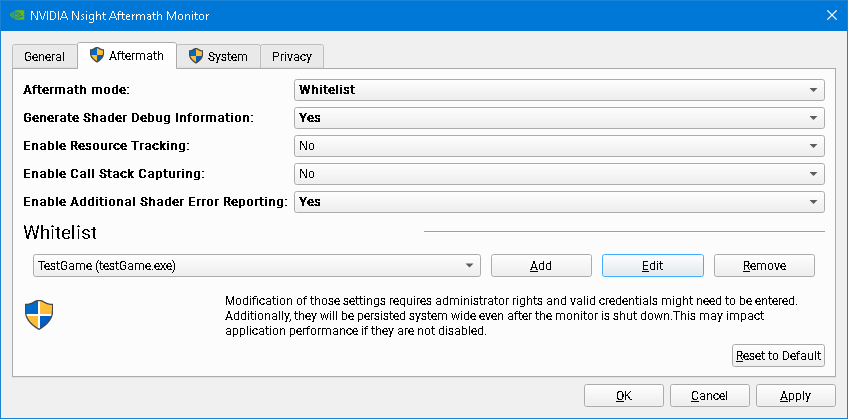
Supported Aftermath Modes are the following:
Disabled disables all GPU crash dump creation.
Global enables crash dump creation for all applications using the D3D11/D3D12 or Vulkan APIs.
Whitelist allows you to limit the GPU crash dump creation to a specific set of applications on the whitelist.
Generate Shader Debug Information enables the generation of shader debug information (line tables for mapping from the shader IL passed to the NVIDIA graphics driver to the shader microcode executed by the GPU) for all shaders loaded by the applications for which Aftermath crash dump creation is enabled.
The GPU Crash Dump Monitor will store the debug information into files with the .nvdbg extension in the Debug Info Dump Directory configured in the General Settings Tab.
The shader debug information is required for mapping shader microcode instructions of active or faulted shader warps to shader IL or shader source lines.
See also the section about Source Shader Debug Information for details on how to compile shader source with source-level debug information.
Note
Enabling this setting will cause additional compilation overhead for generating the debug information and general driver overhead for handling the debug information during shader compilation.
Enable Resource Tracking enables driver side tracking of live and recently destroyed resources (textures, buffers, etc.) that is used to augment the GPU fault information in crash dumps.
This allows Aftermath to identify resources related to GPU virtual addresses seen in the case of a crash due to a GPU page fault. The resource information being tracked includes details about the size of the resource, its format, and the current deletion status of the resource object. D3D12 developers may also consider instrumenting their application using the GFSDK_Aftermath_DX12_RegisterResource function to register the D3D12 resources the application creates. That will allow Aftermath to track additional information, such as the resources’ debug names set by the application. For Vulkan applications, the resources’ debug names set via vkSetDebugUtilsObjectNameEXT will also be captured.
Note
Enabling this feature will cause additional driver overhead for tracking resource information.
Enable Call Stack Capturing enables the automatic generation of Aftermath event markers for tracking the origin of all draw calls, compute and ray tracing dispatches, ray tracing acceleration structure build operations, or resource copies initiated by the application. This data can augment the data collected via Aftermath user markers.
The automatic event markers are added into the command stream right after the corresponding commands with the CPU call stacks of the functions recording the commands as the marker data payloads.
Note
Enabling this feature will cause considerable driver overhead for gathering the necessary information.
Note
When this feature is enabled the GPU crash dump file may contain the file path for the crashing application’s executable as well as the file paths for all DLLs or DSOs it has loaded.
Enable Additional Shader Error Reporting puts the GPU in a special mode that allows the GPU to report additional runtime shader errors. This may provide additional information when debugging GPU hangs, GPU crashes, or unexpected behavior related to shader execution.
Enabling this feature may result in additional crash dumps reporting issues in shaders that exhibit undefined behavior or have hidden bugs, which so far went unnoticed because by default the HW silently ignores them. The additional error checks that are enabled when using this option will cause GPU exceptions for the following situations:
Accessing memory using misaligned addresses, such as reading or writing a byte address that is not a multiple of the access size.
Accessing memory out-of-bounds, such as reading or writing beyond the declared bounds of (group) shared or thread local memory or reading from an out-of-bounds constant buffer address.
Accessing a texture with incompatible format or memory layout.
Hitting call stack limits.
Note
This feature is only supported with NVIDIA graphics driver R515 or later.
System Settings
The System Settings page contains the systemwide Enable SM Register Data Collection setting. On Linux, the collection of SM registers is always enabled so the System Settings page won’t be present in the monitor.
Note
On Windows, modifying Aftermath system settings requires Windows Administrator privileges. Therefore, when any of these settings are modified and applied, a User Account Control confirmation window may pop up asking for permission to modify system settings.
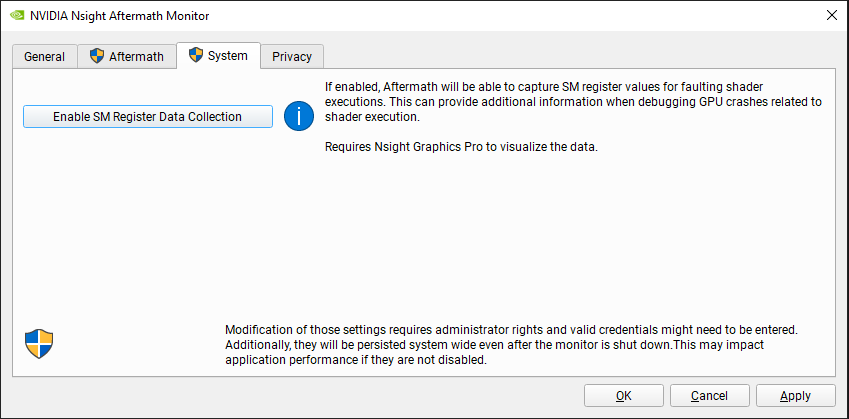
Enable SM Register Data Collection to collect SM register values when faults happen inside SMs. This can provide additional information when debugging GPU crashes related to shader execution.
Since this is a system setting, modifying it might also affect other tools such as Nsight VSE CUDA debugger and may result in unexpected behavior! On Linux, this feature is always enabled without incompability with other tools.
Note
This feature is only supported for the D3D12 and Vulkan APIs with NVIDIA graphics driver R535 or later and requires Nsight Graphics Pro to visualize the data.
Command Line Settings
All Aftermath GPU crash dump monitor settings can also be configured through command line parameters.
The available command line flags are:
–help Print a help message with a list of the available options.
–version Print the release version of the executable.
–crashdump-dir arg Set the crash dump directory.
–debuginfo-dir arg Set the debug information dump directory.
–prompt-on-crash Prompt to open Nsight Graphics after a crash is generated.
–hostname arg The host name of the machine on which to look for already running Nsight Graphics instances.
All Aftermath settings and System settings can also be configured through a separate command line tool installed next to the crash dump monitor executable. On Windows, that command line tool is nv-aftermath-control.exe. On Linux, the tool is called nv-aftermath-control.bin.
The command line flags supported by the configuration tool are:
–mode arg Set Nsight Aftermath mode. Supported options for arg are: Disabled, Whitelist, or Global.
–whitelist arg Add application to the Nsight Aftermath whitelist. arg must be of the following form:
ApplicationName MyApp ExecutableName myApp.exe
This option can be repeated to add multiple applications to the whitelist. This option also clears a previously set up whitelist.
–debuginfo Generate NVIDIA shader debug information.
–resource-tracking Enable resource tracking.
–callstacks Enable automatic marker generation with call stack capturing.
–shader-error-reporting Enable additional shader error reporting.
–register-data-collection Enable SM register data collection. Windows only.
Note
On Windows, modifying Aftermath graphics driver settings requires Windows Administrator privileges. Therefore, when nv-aftermath-control.exe is executed, a User Account Control confirmation window may pop-up asking for permission to modify system settings.
New Crash Dump Notification Dialog
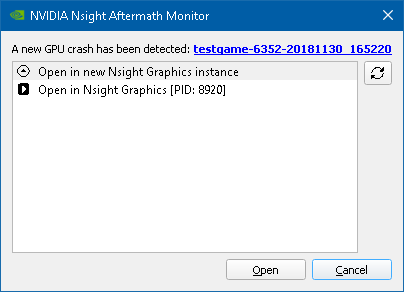
If the NVIDIA Nsight Aftermath Monitor is configured to prompt on new crash dumps, every time a new GPU crash dump file is stored to the crash dump directory, a notification dialog will pop up indicating that a new GPU crash dump is available. This dialog shows the name generated for the new crash dump and also allows you to directly open it in a newly launched instance of Nsight Graphics or in an already running instance of Nsight Graphics.
New Crash Dump Notification Dialog
If the NVIDIA Nsight Aftermath Monitor is configured to prompt on new crash dumps, every time a new GPU crash dump file is stored to the crash dump directory, a notification dialog will pop up indicating that a new GPU crash dump is available. This dialog shows the name generated for the new crash dump and also allows you to directly open it in a newly launched instance of Nsight Graphics or in an already running instance of Nsight Graphics.
GPU Crash Dump Inspector
The GPU Crash Dump Inspector window is comprised of two major views:
In the left part of the window, there is a set of tabs that provide summary information for the open GPU crash dump file, as well as information about the captured crash.
In the right part of the window, there is a multi-purpose area that shows detailed information based on selections made in some of the sections of the left-side tabs.
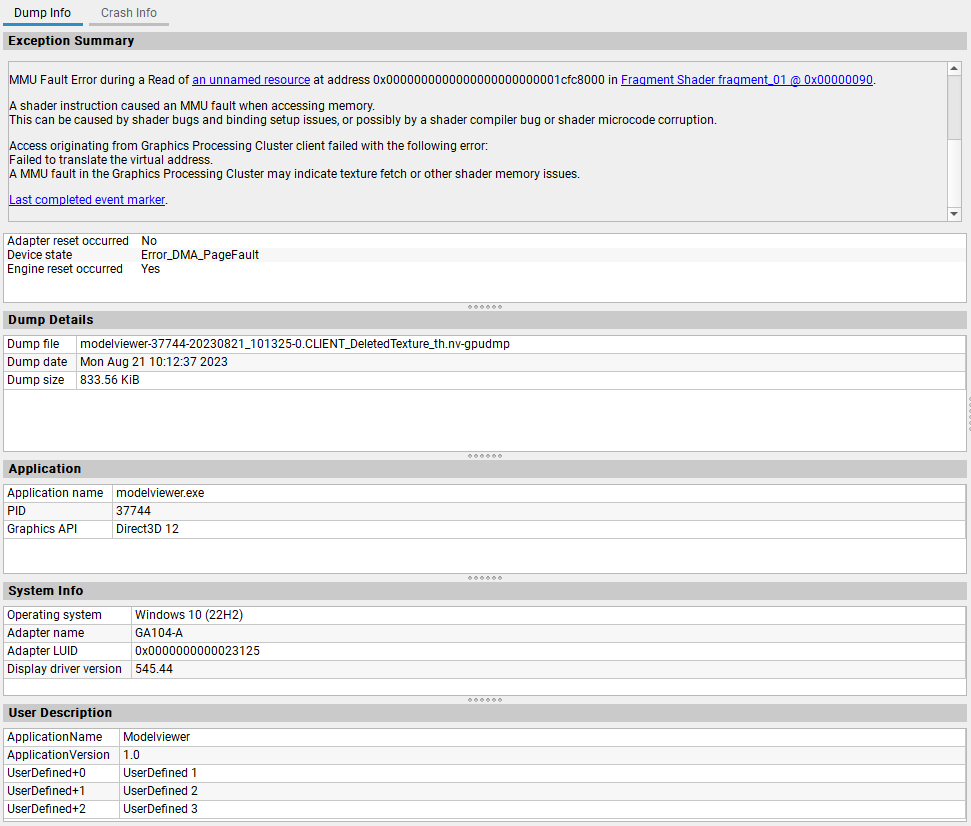
Dump Info
The Dump Info tab provides summary information for the open GPU crash dump file and the data contained in the dump. It is comprised of the following sections:
The Dump Details section summarizes information about the GPU crash dump file, such as the file name, the date and time the dump was created, and the size of the file.
The Application section summarizes information about the application for which the GPU crash dump file was captured, like the name of the executable, the process identifier of the corresponding process, and which graphics API was used.
The Exception Summary section summarizes information about the reason for the GPU crash or GPU hang captured in the GPU crash dump file. The first section contains an analysis of any page faults or shader faults detected in the dump. This provides potential causes for these issues and includes links to any available resource information, shader locations, and relevant markers. Analysis for other crash reasons will be added in future updates. The second section shows what state the graphics adapter and D3D or Vulkan device were in when the device recovery was triggered (TDR).
The System Info section summarizes the information about the system on which the GPU crash dump file was captured. This include information about the operating system, the graphics driver, and the GPU on which the has crash happened.
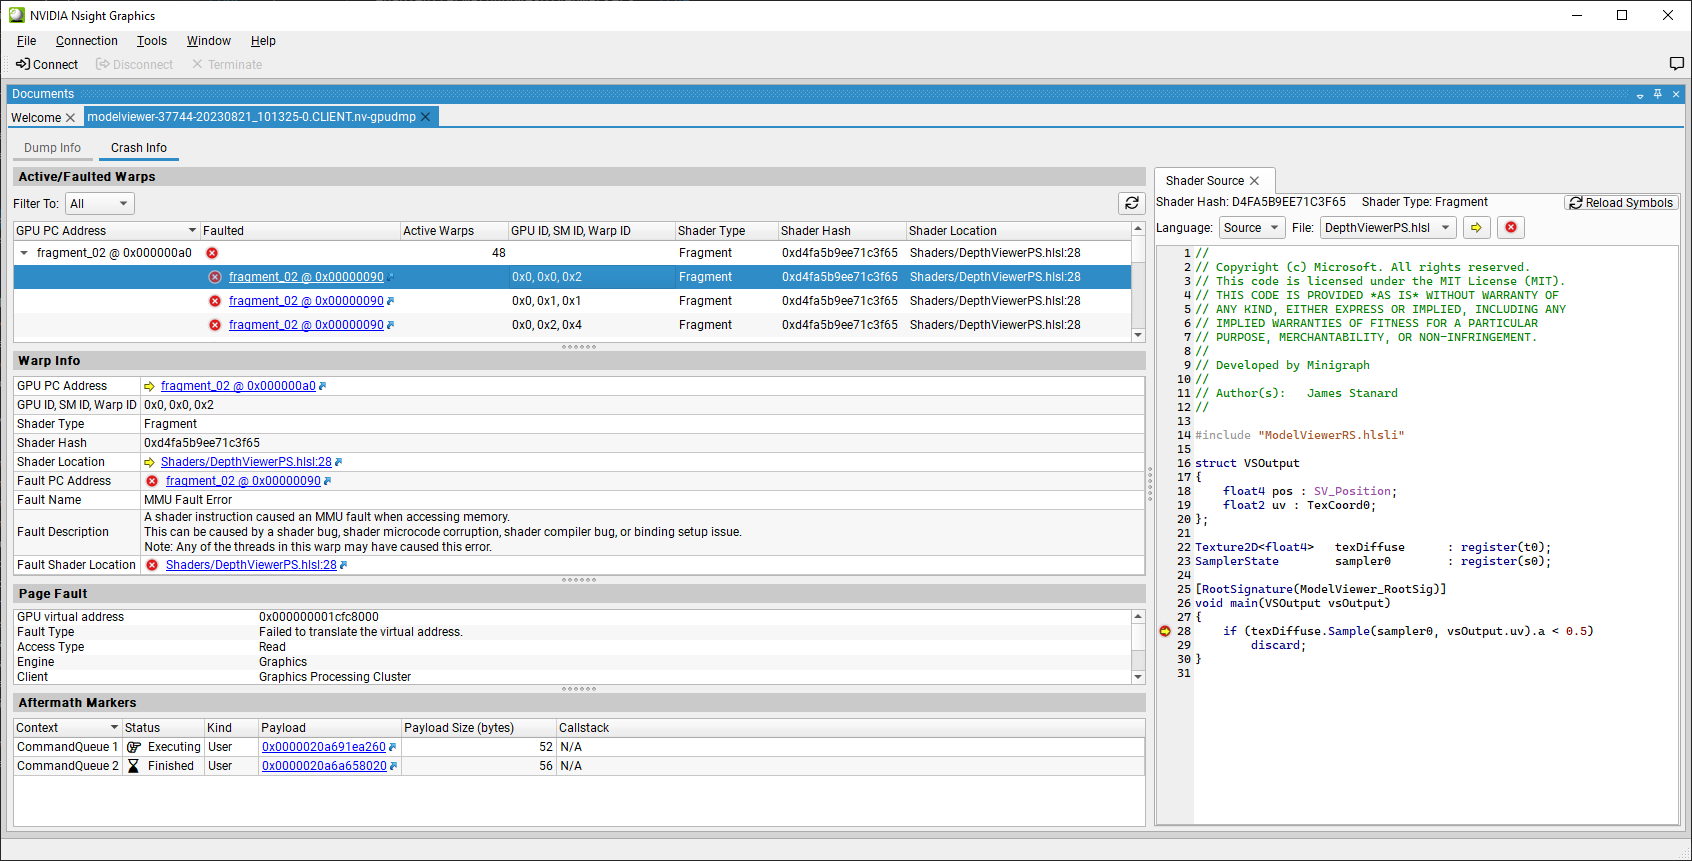
Crash Info
The Crash Info tab provides detailed information for data captured in the open GPU crash dump file. The available sections will vary based on the type of the crash and what information was captured into the crash dump.
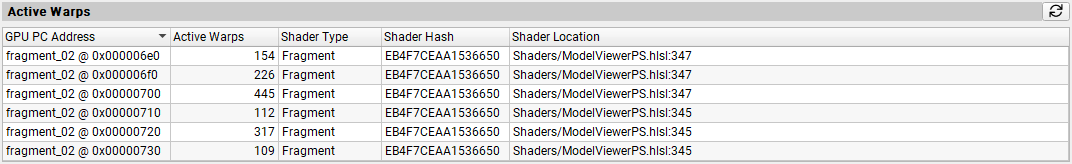
The Active Warps section, if available, shows all active shader executions at the time of the crash or hang. Each row shows the summary for all the warps executing at a specific shader address, including the number of warps, the type of the shader, the shader hash, and the corresponding location within the shader (if shader debug information is available). Clicking a row in the table will open the corresponding Shader View.
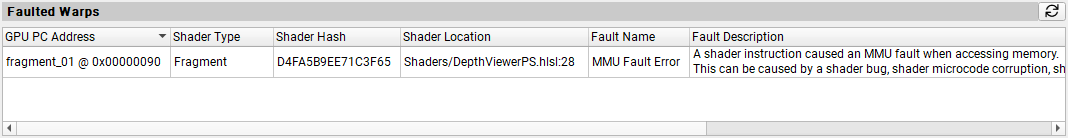
The Faulted Warps section, if available, shows all shader executions that have hit errors. Each row shows a summary of the fault hit on a specific shader address, including the error type, the type of the shader, the shader hash, and the corresponding location within the source shader (if shader debug information is available). Clicking a row in the table will open the corresponding Shader View.
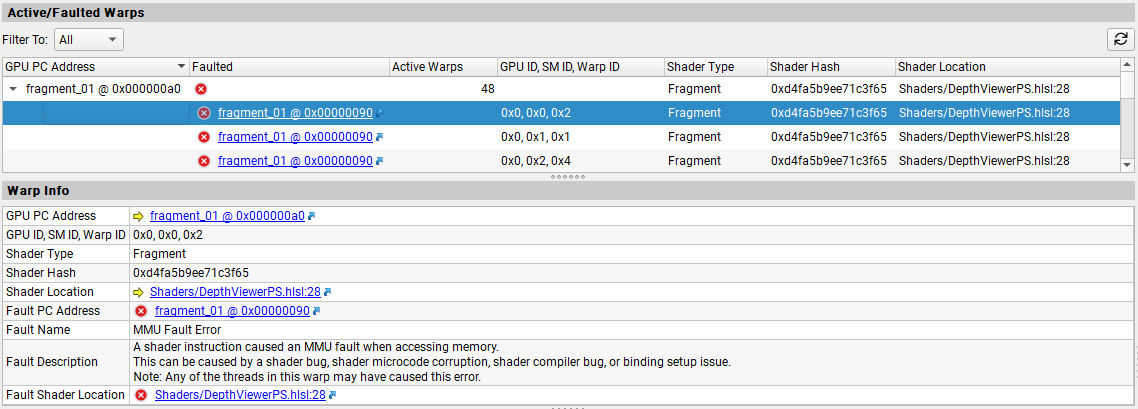
The Active/Faulted Warps section, if available, shows expandable rows each representing the group of all the warps that were executing at a specific shader address. Rows are marked as faulted if any of the warps hit a fault. The Active Warps column shows the number of warps executing at the shader address in the GPU PC Address column. The rows can be expanded to show details about the individual warps. Each entry shows the fault status of the warp, a unique identifier for the warp, the type of the shader, the shader hash, and the source or IL location within the shader (if shader debug information is available). Clicking a row in the table or the address link in the Faulted column will open the corresponding Shader View. The warp information is populated according to the selection and if the warp faulted, additional information such as the name of the fault, its description and the shader address at which the warp hit that fault is also shown. Clicking on a GPU PC Address or Shader Location link will open the Shader View.
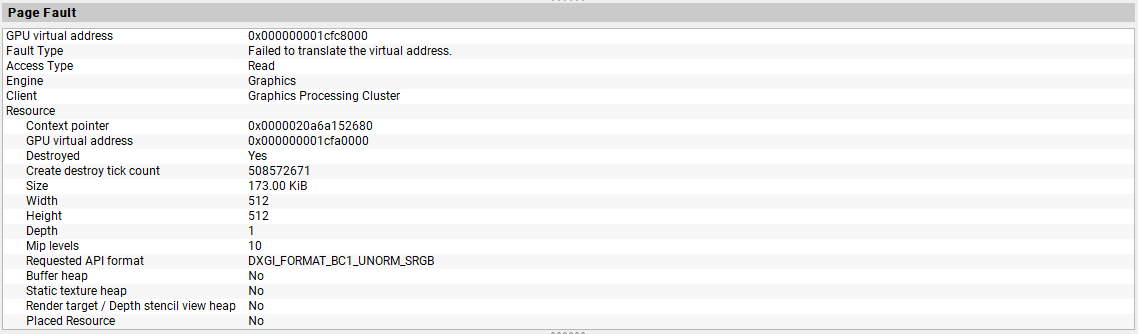
The Page Fault section, if available, shows information about the GPU page fault that caused the crash. Besides the address of the page that could not be accessed, the type of the fault, the type of the access and the GPU unit from which the page was accessed, it may also show information about the resource that is mapped or was mapped at that address if the Aftermath resource tracking feature was enabled.
The Fault Info section, if available, shows extra information about the error that caused the crash. This section is shown instead of the Page Fault section for certain other error types.

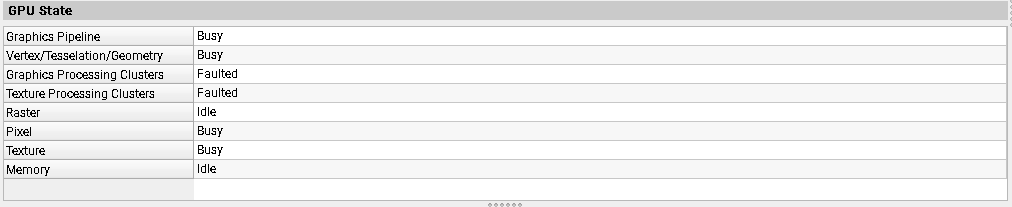
The GPU State section shows a high-level summary of the state of various parts of the GPU. This can be helpful to track down which parts of the graphics pipeline were active or have faulted in the case of a crash.
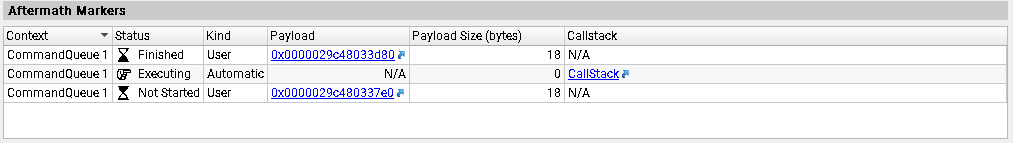
The Aftermath Markers section, if available, shows a summary of the Aftermath event markers last processed by the GPU for each of the registered Aftermath contexts. For user event markers, clicking the Payload link in the table will open the corresponding Aftermath Markers View that allows to inspect the user provided marker payload. For automatic event markers, clicking the CallStack link will open a Aftermath Call Stack View showing the call stack of the function that recorded the corresponding graphics command into the D3Dcommand list or Vulkan command buffer. See also the event marker documentation in GFSDK_Aftermath.h for more detail.
Shader View
The Shader Source view shows the shader code related to the selection made in the Active Warps, Faulted Warps or the Active/Faulted Warps view. This requires that the appropriate information is made available by Configuring the GPU Crash Dump Inspector.
Depending on what information is available for the shader the Language selection box provides the following options:
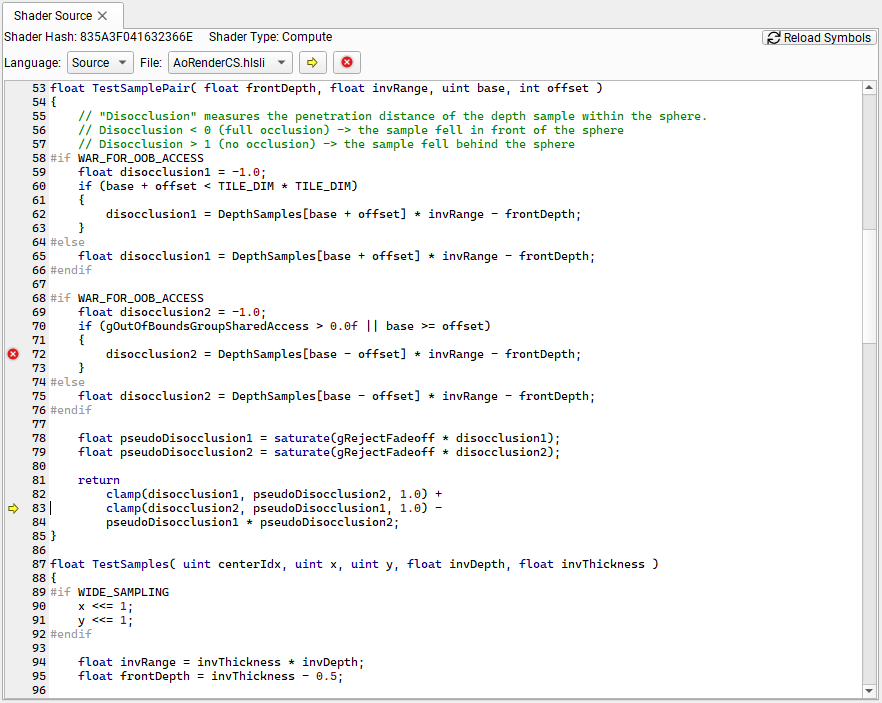
If Source is selected, the view shows the high-level shader source of the shader corresponding to the row selected in the Active Warps, Faulted Warps or the Active/Faulted Warps view. If the shader was compiled from several source files the File selection box allows to switch between the source files. If a row in the Active Warps or the Active/Faulted Warps view is selected, the shader source line that was executing by the selected warp when the crash dump data was captured is marked with a yellow arrow. If that warp has faulted, a red circle will mark the location of the fault. If a row in the Faulted Warps view is selected, the shader source line that corresponds to the faulted instruction is marked with the red circle. The yellow arrow and red circle buttons will jump directly to the corresponding marked instructions.
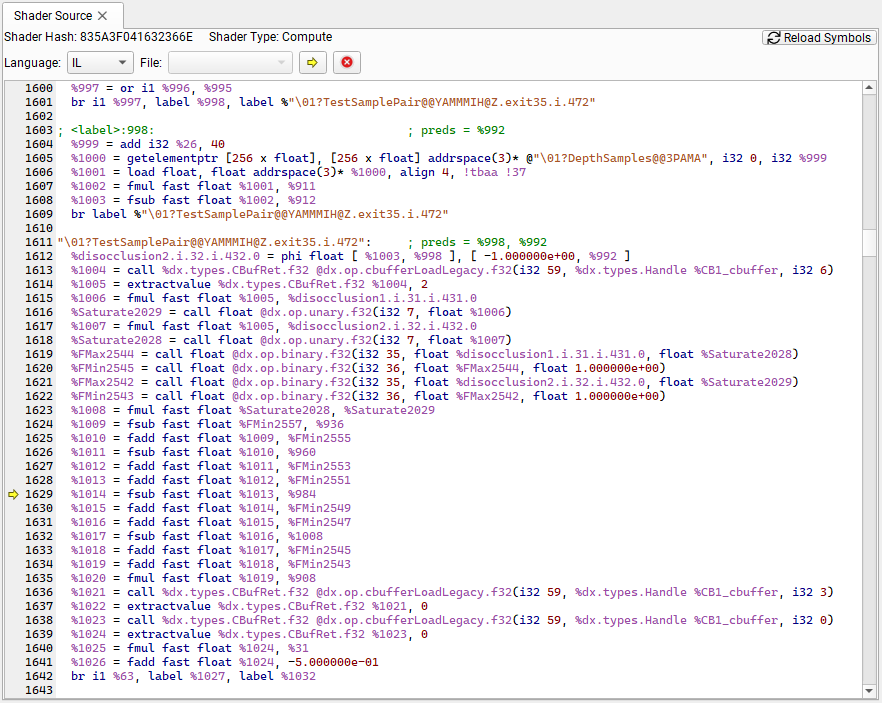
If IL is selected, the view shows the intermediate assembly of the shader (DXIL or SPIR-V) corresponding to the row selected in the Active Warps, Faulted Warps or Active/Faulted Warps view. If a row in the Active Warps or the Active/Faulted Warps view is selected, the intermediate language statement that was executing by the selected warp when the crash dump data was captured is marked with a yellow arrow. If that warp has faulted, a red circle will mark the location of the fault. If a row in the Faulted Warps view is selected, the intermediate language statement that corresponds to the faulted instruction is marked with the red circle. The yellow arrow and red circle buttons will jump directly to the corresponding marked instructions.
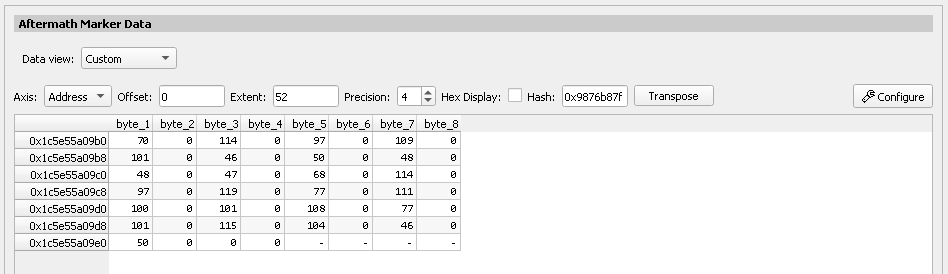
Aftermath Marker Data View
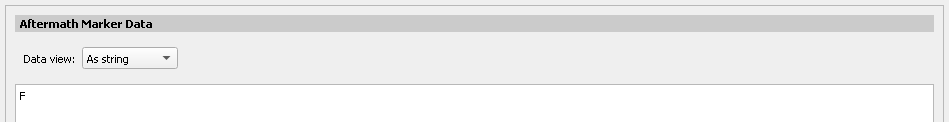
The Aftermath Marker Data view allows inspection of the Aftermath event marker data provided by the application. Since Aftermath event marker data is typeless the marker data view supports different Data view modes for interpretation of the raw data:
As string interprets the event marker data as zero-terminated UTF-8 character string.
As wide string interprets the event marker data as zero-terminated wide character string.
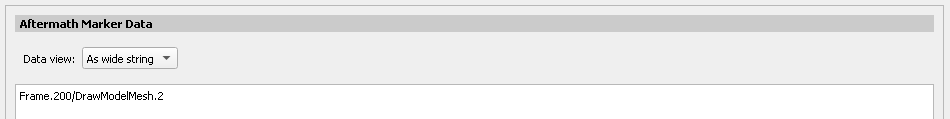
Custom allows to inspect the raw event marker byte data or to provide a custom interpretation of the data using a Structured Memory Configuration.
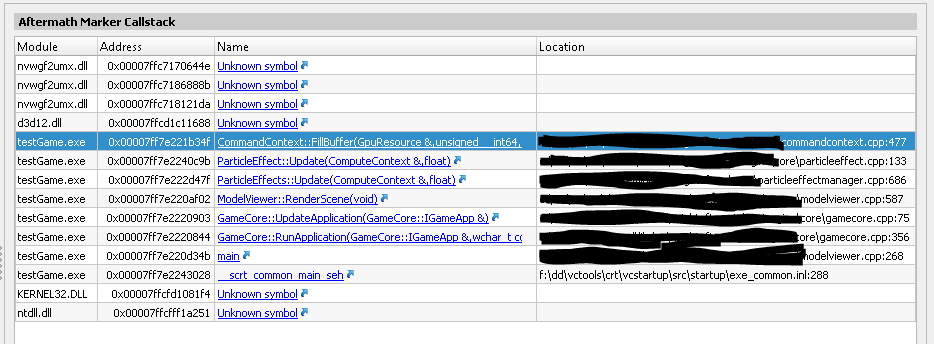
Aftermath Marker Call Stack View
The Aftermath Marker Call Stack view shows the call stack for the last draw, dispatch, or copy call processed by the GPU. Resolving the call stack to source location requires a properly set up symbol search path in the Search Paths Settings. Alternatively, clicking the Unknown Symbol link allows to provide a symbol file for a specific call stack element.