Kernel Profiling Guide
Nsight Compute profiling guide.
NVIDIA Nsight Compute Kernel Profiling Guide.
1. Introduction
This guide describes various profiling topics related to NVIDIA Nsight Compute and NVIDIA Nsight Compute CLI. Most of these apply to both the UI and the CLI version of the tool.
1.1. Profiling Applications
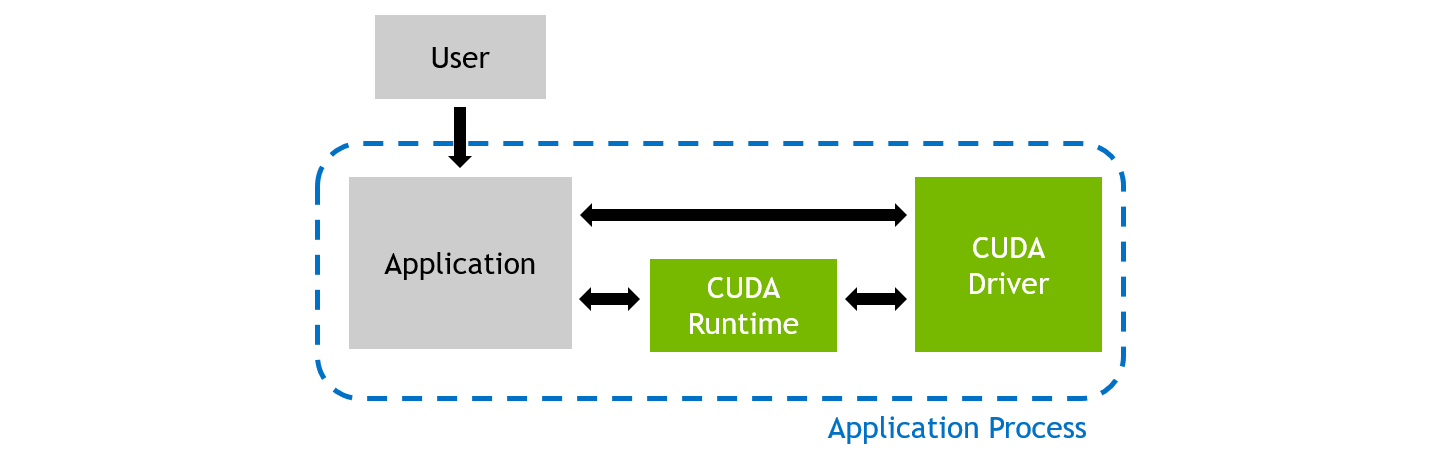
During regular execution, a CUDA application process will be launched by the user. It communicates directly with the CUDA user-mode driver, and potentially with the CUDA runtime library.
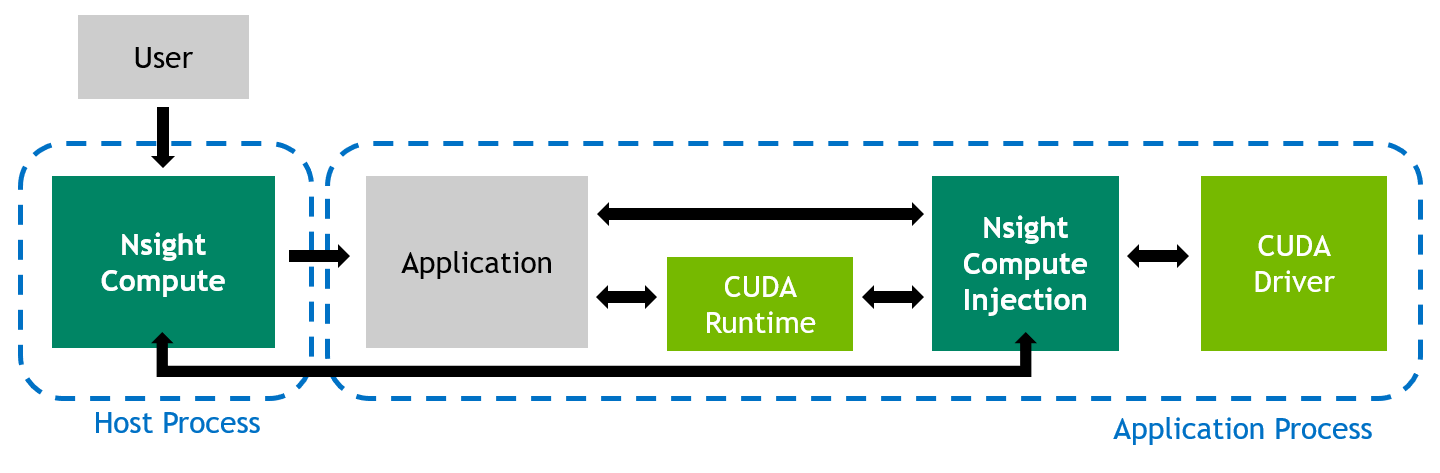
When profiling an application with NVIDIA Nsight Compute, the behavior is different. The user launches the NVIDIA Nsight Compute frontend (either the UI or the CLI) on the host system, which in turn starts the actual application as a new process on the target system. While host and target are often the same machine, the target can also be a remote system with a potentially different operating system.
The tool inserts its measurement libraries into the application process, which allow the profiler to intercept communication with the CUDA user-mode driver. In addition, when a kernel launch is detected, the libraries can collect the requested performance metrics from the GPU. The results are then transferred back to the frontend.
2. Metric Collection
Collection of performance metrics is the key feature of NVIDIA Nsight Compute. Since there is a huge list of metrics available, it is often easier to use some of the tool's pre-defined sets or sections to collect a commonly used subset. Users are free to adjust which metrics are collected for which kernels as needed, but it is important to keep in mind the Overhead associated with data collection.
2.1. Sets and Sections
NVIDIA Nsight Compute uses Section Sets (short sets) to decide, on a very high level, the amount of metrics to be collected. Each set includes one or more Sections, with each section specifying several logically associated metrics. For example, one section might include only high-level SM and memory utilization metrics, while another could include metrics associated with the memory units, or the HW scheduler.
The number and type of metrics specified by a section has significant impact on the overhead during profiling. To allow you to quickly choose between a fast, less detailed profile and a slower, more comprehensive analysis, you can select the respective section set. See Overhead for more information on profiling overhead.
By default, a relatively small number of metrics is collected. Those mostly include high-level utilization information as well as static launch and occupancy data. The latter two are regularly available without replaying the kernel launch. The default set is collected when no --set, --section and no --metrics options are passed on the command line. The full set of sections can be collected with --set full.
Use --list-sets to see the list of currently available sets. Use --list-sections to see the list of currently available sections. The default search directory and the location of pre-defined section files are also called sections/. All related command line options can be found in the NVIDIA Nsight Compute CLI documentation.
2.2. Sections and Rules
| Identifier and Filename | Description |
|---|---|
| ComputeWorkloadAnalysis (ComputeWorkloadAnalysis) | Detailed analysis of the compute resources of the streaming multiprocessors (SM), including the achieved instructions per clock (IPC) and the utilization of each available pipeline. Pipelines with very high utilization might limit the overall performance. |
| InstructionStats (InstructionStatistics) | Statistics of the executed low-level assembly instructions (SASS). The instruction mix provides insight into the types and frequency of the executed instructions. A narrow mix of instruction types implies a dependency on few instruction pipelines, while others remain unused. Using multiple pipelines allows hiding latencies and enables parallel execution. |
| LaunchStats (LaunchStatistics) | Summary of the configuration used to launch the kernel. The launch configuration defines the size of the kernel grid, the division of the grid into blocks, and the GPU resources needed to execute the kernel. Choosing an efficient launch configuration maximizes device utilization. |
| MemoryWorkloadAnalysis (MemoryWorkloadAnalysis) | Detailed analysis of the memory resources of the GPU. Memory can become a limiting factor for the overall kernel performance when fully utilizing the involved hardware units (Mem Busy), exhausting the available communication bandwidth between those units (Max Bandwidth), or by reaching the maximum throughput of issuing memory instructions (Mem Pipes Busy). Depending on the limiting factor, the memory chart and tables allow to identify the exact bottleneck in the memory system. |
| Occupancy (Occupancy) | Occupancy is the ratio of the number of active warps per multiprocessor to the maximum number of possible active warps. Another way to view occupancy is the percentage of the hardware's ability to process warps that is actively in use. Higher occupancy does not always result in higher performance, however, low occupancy always reduces the ability to hide latencies, resulting in overall performance degradation. Large discrepancies between the theoretical and the achieved occupancy during execution typically indicates highly imbalanced workloads. |
| SchedulerStats (SchedulerStatistics) | Summary of the activity of the schedulers issuing instructions. Each scheduler maintains a pool of warps that it can issue instructions for. The upper bound of warps in the pool (Theoretical Warps) is limited by the launch configuration. On every cycle each scheduler checks the state of the allocated warps in the pool (Active Warps). Active warps that are not stalled (Eligible Warps) are ready to issue their next instruction. From the set of eligible warps, the scheduler selects a single warp from which to issue one or more instructions (Issued Warp). On cycles with no eligible warps, the issue slot is skipped and no instruction is issued. Having many skipped issue slots indicates poor latency hiding. |
| SourceCounters (SourceCounters) | Source metrics, including warp stall reasons. Sampling Data metrics are periodically sampled over the kernel runtime. They indicate when warps were stalled and couldn't be scheduled. See the documentation for a description of all stall reasons. Only focus on stalls if the schedulers fail to issue every cycle. |
| SpeedOfLight (SpeedOfLight) | High-level overview of the utilization for compute and memory resources of the GPU. For each unit, the Speed Of Light (SOL) reports the achieved percentage of utilization with respect to the theoretical maximum. On Volta+ GPUs, it reports the breakdown of SOL SM and SOL Memory to each individual sub-metric to clearly identify the highest contributor. |
| WarpStateStats (WarpStateStatistics) | Analysis of the states in which all warps spent cycles during the kernel execution. The warp states describe a warp's readiness or inability to issue its next instruction. The warp cycles per instruction define the latency between two consecutive instructions. The higher the value, the more warp parallelism is required to hide this latency. For each warp state, the chart shows the average number of cycles spent in that state per issued instruction. Stalls are not always impacting the overall performance nor are they completely avoidable. Only focus on stall reasons if the schedulers fail to issue every cycle. |
2.3. Kernel Replay
Depending on which metrics are to be collected for a kernel launch, the kernel might need to be replayed one or more times, since not all metrics can be collected in a single pass. For example, the number of metrics originating from hardware (HW) performance counters that the GPU can collect at the same time is restricted. In addition, several patch-based software (SW) performance counters can have a high impact on kernel runtime and would skew results for HW counters.
To solve this issue, all metrics requested for a specific kernel instance in NVIDIA Nsight Compute are grouped into one or more passes. For the first pass, all GPU memory that can be accessed by the kernel is saved. After the first pass, the subset of memory that is written by the kernel is determined. Before each pass (except the first one), this subset is restored in its original location to have the kernel access the same memory contents in each replay pass.
NVIDIA Nsight Compute attempts to use the fastest available storage location for this save-and-restore strategy. For example, if data is allocated in device memory, and there is still enough device memory available, it is stored there directly. If it runs out of device memory, the data is transferred to the CPU host memory. Likewise, if an allocation originates from CPU host memory, the tool first attempts to save it into the same memory location, if possible.
As explained in Overhead, the time needed for this increases the more memory is accessed, especially written, by a kernel. If NVIDIA Nsight Compute determines that only a single replay pass is necessary to collect the requested metrics, no save-and-restore is performed at all to reduce overhead.
2.4. Overhead
As with most measurements, collecting performance data using NVIDIA Nsight Compute CLI incurs some runtime overhead on the application. The overhead does depend on a number of different factors:
- Number and type of collected metrics
Depending on the selected metric, data is collected either through a hardware performance monitor on the GPU, through software patching of the kernel instructions or via a launch or device attribute. The overhead between these mechanisms varies greatly, with launch and device attributes being "statically" available and requiring no kernel runtime overhead.
Furthermore, only a limited number of metrics can be collected in a single pass of the kernel execution. If more metrics are requested, the kernel launch is replayed multiple times, with its accessible memory being saved and restored between subsequent passes to guarantee deterministic execution. Therefore, collecting more metrics can significantly increase overhead by requiring more replay passes and increasing the total amount of memory that needs to be restored during replay.
- The collected section set
Since each set specifies a group of section to be collected, choosing a less comprehensive set can reduce profiling overhead. See the --set command in the NVIDIA Nsight Compute CLI options documentation.
- Number of collected sections
Since each section specifies a set metrics to be collected, selecting fewer sections can reduce profiling overhead. See the --section command in the NVIDIA Nsight Compute CLI options documentation.
- Number of profiled kernels
By default, all selected metrics are collected for all launched kernels. To reduce the impact on the application, you can try to limit performance data collection to as few kernel functions and instances as makes sense for your analysis. See the filtering commands in the NVIDIA Nsight Compute CLI options documentation.
- GPU Architecture
NVIDIA Nsight Compute uses different data collection libraries for GPUs of compute capability 7.2 and higher and for those of compute capability 7.0 and below. For 7.2+, there is a relatively high one-time overhead for the first profiled kernel to generate the metric configuration. This overhead does not occur for subsequent kernels in the same context, if the list of collected metrics remains unchanged.
3. Metrics Guide
3.1. Hardware Model
Compute Model
All NVIDIA GPUs are designed to support a general purpose heterogeneous parallel programming model, commonly known as Compute. This model decouples the GPU from the traditional graphics pipeline and exposes it as a general purpose parallel multi-processor. A heterogeneous computing model implies the existence of a host and a device, which in this case are the CPU and GPU, respectively. At a high level view, the host (CPU) manages resources between itself and the device and will send work off to the device to be executed in parallel.
- A Grid is a 1D, 2D or 3D array of thread blocks.
- A Block is a 1D, 2D or 3D array of threads, also known as a Cooperative Thread Array (CTA).
- A Thread is a single thread which runs on one of the GPU's SM units.
The purpose of the Grid, Block, Thread hierarchy is to expose a notion of locality amongst a group of threads, i.e. a Cooperative Thread Array (CTA). In CUDA, CTAs are referred to as Thread Blocks. The architecture can exploit this locality by providing fast shared memory and barriers between the threads within a single CTA. When a Grid is launched, the architecture guarantees that all threads within a CTA will run concurrently on the same SM. Information on the grids and blocks can be found in the Launch Statistics section.
The number of CTAs that fit on each SM depends on the physical resources required by the CTA. These resource limiters include the number of threads and registers, shared memory utilization, and hardware barriers. The number CTAs per SM is referred to as the CTA occupancy, and these physical resources limit this occupancy. Details on the kernel's occupancy are collected by the Occupancy section.
Each CTA can be scheduled on any of the available SMs, where there is no guarantee in the order of execution. As such, CTAs must be entirely independent, which means it is not possible for one CTA to wait on the result of another CTA. As CTAs are independent, the host (CPU) can launch a large Grid that will not fit on the hardware all at once, however any GPU will still be able to run it and produce the correct results.
CTAs are further divided into groups of 32 threads called Warps. If the number of threads in a CTA is not dividable by 32, the last warp will contain the remaining number of threads.
The total number of CTAs that can run concurrently on a given GPU is referred to as Wave. Consequently, the size of a Wave scales with the number of available SMs of a GPU, but also with the occupancy of the kernel.
Streaming Multiprocessor
The Streaming Multiprocessor (SM) is the core processing unit in the GPU. The SM is optimized for a wide diversity of workloads, including general-purpose computations, deep learning, ray tracing, as well as lighting and shading. The SM is designed to simultaneously execute multiple CTAs. CTAs can be from different grid launches.
The SM implements an execution model called Single Instruction Multiple Threads (SIMT), which allows individual threads to have unique control flow while still executing as part of a warp. The Turing SM inherits the Volta SM's independent thread scheduling model. The SM maintains execution state per thread, including a program counter (PC) and call stack. The independent thread scheduling allows the GPU to yield execution of any thread, either to make better use of execution resources or to allow a thread to wait for data produced by another thread possibly in the same warp. Collecting the Source Counters section allows you to inspect instruction execution and predication details on the Source Page, along with Sampling information.
- Warp Scheduler
- Register File
-
Execution Units/Pipelines/Cores
- Integer Execution units
- Floating Point Execution units
- Memory Load/Store units
- Special Function unit
- Tensor Cores
- Unified L1 Data Cache / Shared Memory
- Texture units
- RT Cores, if available
A warp is allocated to a sub partition and resides on the sub partition from launch to completion. A warp is referred to as active or resident when it is mapped to a sub partition. A sub partition manages a fixed size pool of warps. On Volta architectures, the size of the pool is 16 warps. On Turing architectures the size of the pool is 8 warps. Active warps can be in eligible state if the warp is ready to issue an instruction. This requires the warp to have a decoded instruction, all input dependencies resolved, and for the function unit to be available. Statistics on active, eligible and issuing warps can be collected with the Scheduler Statistics section.
- an instruction fetch,
- a memory dependency (result of memory instruction),
- an execution dependency (result of previous instruction), or
- a synchronization barrier.
The most important resource under the compiler's control is the number of registers used by a kernel. Each sub partition has a set of 32-bit registers, which are allocated by the HW in fixed-size chunks. The Launch Statistics section shows the kernel's register usage.
Memory
Global memory is a 49-bit virtual address space that is mapped to physical memory on the device, pinned system memory, or peer memory. Global memory is visible to all threads in the GPU. Global memory is accessed through the SM L1 and GPU L2.
Local memory is private storage for an executing thread and is not visible outside of that thread. It is intended for thread-local data like thread stacks and register spills. Local memory addresses are translated to global virtual addresses by the the AGU unit. Local memory has the same latency as global memory. One difference between global and local memory is that local memory is arranged such that consecutive 32-bit words are accessed by consecutive thread IDs. Accesses are therefore fully coalesced as long as all threads in a warp access the same relative address (e.g., same index in an array variable, same member in a structure variable, etc.).
Shared memory is located on chip, so it has much higher bandwidth and much lower latency than either local or global memory. Shared memory can be shared across a compute CTA. Compute CTAs attempting to share data across threads via shared memory must use synchronization operations (such as __syncthreads()) between stores and loads to ensure data written by any one thread is visible to other threads in the CTA. Similarly, threads that need to share data via global memory must use a more heavyweight global memory barrier.
Shared memory has 32 banks that are organized such that successive 32-bit words map to successive banks that can be accessed simultaneously. Any 32-bit memory read or write request made of 32 addresses that fall in 32 distinct memory banks can therefore be serviced simultaneously, yielding an overall bandwidth that is 32 times as high as the bandwidth of a single request. However, if two addresses of a memory request fall in the same memory bank, there is a bank conflict and the access has to be serialized.
A shared memory request for a warp does not generate a bank conflict between two threads that access any address within the same 32-bit word (even though the two addresses fall in the same bank). When multiple threads make the same read access, one thread receives the data and then broadcasts it to the other threads. When multiple threads write to the same location, only one thread succeeds in the write; which thread that succeeds is undefined.
Detailed memory metrics are collected by the Memory Workload Analysis section.
Caches
All GPU units communicate to main memory through the Level 2 cache, also known as the L2. The L2 cache sits between on-chip memory clients and the framebuffer. L2 works in physical-address space. In addition to providing caching functionality, L2 also includes hardware to perform compression and global atomics.
The Level 1 Data Cache, or L1, plays a key role in handling global, local, shared, texture, and surface memory reads and writes, as well as reduction and atomic operations. On Volta and Turing architectures there are , there are two L1 caches per TPC, one for each SM. For more information on how L1 fits into the texturing pipeline, see the TEX unit description. Also note that while this section often uses the name "L1", it should be understood that the L1 data cache, shared data, and the Texture data cache are one and the same.
L1 receives requests from two units: the SM and TEX. L1 receives global and local memory requests from the SM and receives texture and surface requests from TEX. These operations access memory in the global memory space, which L1 sends through a secondary cache, the L2.
Cache hit and miss rates as well as data transfers are reported in the Memory Workload Analysis section.
Texture/Surface
The TEX unit performs texture fetching and filtering. Beyond plain texture memory access, TEX is responsible for the addressing, LOD, wrap, filter, and format conversion operations necessary to convert a texture read request into a result.
TEX receives two general categories of requests from the SM via its input interface: texture requests and surface load/store operations. Texture and surface memory space resides in device memory and are cached in L1. Texture and surface memory are allocated as block-linear surfaces (e.g. 2D, 2D Array, 3D). Such surfaces provide a cache-friendly layout of data such that neighboring points on a 2D surface are also located close to each other in memory, which improves access locality. Surface accesses are bounds-checked by the TEX unit prior to accessing memory, which can be used for implementing different texture wrapping modes.
The L1 cache is optimized for 2D spatial locality, so threads of the same warp that read texture or surface addresses that are close together in 2D space will achieve optimal performance. The L1 cache is also designed for streaming fetches with constant latency; a cache hit reduces DRAM bandwidth demand but not fetch latency. Reading device memory through texture or surface memory presents some benefits that can make it an advantageous alternative to reading memory from global or constant memory.
Information on texture and surface memory can be found in the Memory Workload Analysis section.
3.2. Metrics Structure
Metrics Overview
For metrics collected for GPUs with SM 7.0 and above, NVIDIA Nsight Compute uses an advanced metrics calculation system, designed to help you determine what happened (counters and metrics), and how close the program reached to peak GPU performance (throughputs as a percentage). Every counter has associated peak rates in the database, to allow computing its throughput as a percentage.
Throughput metrics return the maximum percentage value of their constituent counters. These constituents have been carefully selected to represent the sections of the GPU pipeline that govern peak performance. While all counters can be converted to a %-of-peak, not all counters are suitable for peak-performance analysis; examples of unsuitable counters include qualified subsets of activity, and workload residency counters. Using throughput metrics ensures meaningful and actionable analysis.
Two types of peak rates are available for every counter: burst and sustained. Burst rate is the maximum rate reportable in a single clock cycle. Sustained rate is the maximum rate achievable over an infinitely long measurement period, for "typical" operations. For many counters, burst equals sustained. Since the burst rate cannot be exceeded, percentages of burst rate will always be less than 100%. Percentages of sustained rate can occasionally exceed 100% in edge cases.
Metrics Entities
While in NVIDIA Nsight Compute, all performance counters are named metrics, they can be split further into groups with specific properties. For metrics collected via the PerfWorks measurement library, four types of metric entities exist:
| .peak_burst | the peak burst rate |
| .peak_sustained | the peak sustained rate |
| .per_cycle_active | the number of operations per unit active cycle |
| .per_cycle_elapsed | the number of operations per unit elapsed cycle |
| .per_cycle_in_region | the number of operations per user-specified range cycle |
| .per_cycle_in_frame | the number of operations per user-specified frame cycle |
| .per_second | the number of operations per user-specified frame cycle |
| .pct_of_peak_burst_active | % of peak burst rate achieved during unit active cycles |
| .pct_of_peak_burst_elapsed | % of peak burst rate achieved during unit elapsed cycles |
| .pct_of_peak_burst_region | % of peak burst rate achieved over a user-specified range time |
| .pct_of_peak_burst_frame | % of peak burst rate achieved over a user-specified frame time |
| .pct_of_peak_sustained_active | % of peak sustained rate achieved during unit active cycles |
| .pct_of_peak_sustained_elapsed | % of peak sustained rate achieved during unit elapsed cycles |
| .pct_of_peak_sustained_region | % of peak sustained rate achieved over a user-specified range time |
| .pct_of_peak_sustained_frame | % of peak sustained rate achieved over a user-specified frame time |
| .sum | The sum of counter values across all unit instances. |
| .avg | The average counter value across all unit instances. |
| .min | The minimum counter value across all unit instances. |
| .max | The maximum counter value across all unit instances. |
| .pct | The value expressed as a percentage. |
| .ratio | The value expressed as a ratio. |
| .pct_of_peak_burst_active | % of peak burst rate achieved during unit active cycles |
| .pct_of_peak_burst_elapsed | % of peak burst rate achieved during unit elapsed cycles |
| .pct_of_peak_burst_region | % of peak burst rate achieved over a user-specified "range" time |
| .pct_of_peak_burst_frame | % of peak burst rate achieved over a user-specified "frame" time |
| .pct_of_peak_sustained_active | % of peak sustained rate achieved during unit active cycles |
| .pct_of_peak_sustained_elapsed | % of peak sustained rate achieved during unit elapsed cycles |
| .pct_of_peak_sustained_region | % of peak sustained rate achieved over a user-specified "range" time |
| .pct_of_peak_sustained_frame | % of peak sustained rate achieved over a user-specified "frame" time |
- Device Attributes: device__attribute_* metrics represent CUDA device attributes. Collecting them does not require an addition kernel replay pass, as their value is available from the CUDA driver for each CUDA device.
- Launch Metrics: launch__* metrics are collected per kernel launch, and do not require an additional replay pass. They are available as part of the kernel launch parameters (such as grid size, block size, ...) or are computed using the CUDA Occupancy Calculator.
Metrics Examples
## non-metric names -- *not* directly evaluable
sm__inst_executed                   # counter
smsp__average_warp_latency          # ratio
sm__throughput                      # throughput

## a counter's four sub-metrics -- all evaluable
sm__inst_executed.sum               # metric
sm__inst_executed.avg               # metric
sm__inst_executed.min               # metric
sm__inst_executed.max               # metric

## all names below are metrics -- all evaluable
l1tex__data_bank_conflicts_pipe_lsu.sum
l1tex__data_bank_conflicts_pipe_lsu.sum.peak_burst
l1tex__data_bank_conflicts_pipe_lsu.sum.peak_sustained
l1tex__data_bank_conflicts_pipe_lsu.sum.per_cycle_active
l1tex__data_bank_conflicts_pipe_lsu.sum.per_cycle_elapsed
l1tex__data_bank_conflicts_pipe_lsu.sum.per_cycle_region
l1tex__data_bank_conflicts_pipe_lsu.sum.per_cycle_frame
l1tex__data_bank_conflicts_pipe_lsu.sum.per_second
l1tex__data_bank_conflicts_pipe_lsu.sum.pct_of_peak_burst_active
l1tex__data_bank_conflicts_pipe_lsu.sum.pct_of_peak_burst_elapsed
l1tex__data_bank_conflicts_pipe_lsu.sum.pct_of_peak_burst_region
l1tex__data_bank_conflicts_pipe_lsu.sum.pct_of_peak_burst_frame
l1tex__data_bank_conflicts_pipe_lsu.sum.pct_of_peak_sustained_active
l1tex__data_bank_conflicts_pipe_lsu.sum.pct_of_peak_sustained_elapsed
l1tex__data_bank_conflicts_pipe_lsu.sum.pct_of_peak_sustained_region
l1tex__data_bank_conflicts_pipe_lsu.sum.pct_of_peak_sustained_frame
Metrics Naming Conventions
- Unit-Level Counter : unit__(subunit?)_(pipestage?)_quantity_(qualifiers?)
- Interface Counter : unit__(subunit?)_(pipestage?)_(interface)_quantity_(qualifiers?)
- Unit Metric : (counter_name).(rollup_metric)
- Sub-Metric : (counter_name).(rollup_metric).(submetric)
- unit: A logical or physical unit of the GPU
- subunit: The subunit within the unit where the counter was measured. Sometimes this is a pipeline mode instead.
- pipestage: The pipeline stage within the subunit where the counter was measured.
- quantity: What is being measured. Generally matches the dimensional units.
- qualifiers: Any additional predicates or filters applied to the counter. Often, an unqualified counter can be broken down into several qualified sub-components.
- interface: Of the form sender2receiver, where sender is the source-unit and receiver is the destination-unit.
- rollup_metric: One of sum, avg, min, max.
- submetric: refer to section Metrics Entities
Cycle Metrics
- unit__cycles_elapsed : The number of cycles within a range. The cycles' DimUnits are specific to the unit's clock domain.
- unit__cycles_active : The number of cycles where the unit was processing data.
- unit__cycles_stalled : The number of cycles where the unit was unable to process new data because its output interface was blocked.
- unit__cycles_idle : The number of cycles where the unit was idle.
- unit__(interface)_active : Cycles where data was transferred from source-unit to destination-unit.
- unit__(interface)_stalled : Cycles where the source-unit had data, but the destination-unit was unable to accept data.
3.3. Metrics Decoder
The following explains terms found in NVIDIA Nsight Compute SM 7.0 and above metric names, as introduced in Metrics Structure.
Units
| dram | Device (main) memory, where the GPUs global and local memory resides. |
| fbpa | The FrameBuffer Partition is a memory controller which sits between the level 2 cache (LTC) and the DRAM. The number of FBPAs varies across GPUs. |
| fe | The Frontend unit is responsible for the overall flow of workloads sent by the driver. FE also facilitates a number of synchronization operations. |
| gpc | The General Processing Cluster contains SM, Texture and L1 in the form of TPC(s). It is replicated several times across a chip. |
| gpu | The entire Graphics Processing Unit. |
| gr | Graphics Engine is responsible for all 2D and 3D graphics, compute work, and synchronous graphics copying work. |
| idc | The InDexed Constant Cache is a subunit of the SM responsible for caching constants that are indexed with a register. |
| l1tex | The Level 1 (L1)/Texture Cache is located within the GPC. It can be used as directed-mapped shared memory and/or store global, local and texture data in its cache portion. |
| lts | A Level 2 (L2) Cache Slice is a sub-partition of the Level 2 cache. |
| sm | The Streaming Multiprocessor handles execution of a kernel as groups of 32 threads, called warps. Warps are further grouped into cooperative thread arrays (CTA), called blocks in CUDA. All warps of a CTA execute on the same SM. CTAs share various resources across their threads, e.g. the shared memory. |
| smsp | SMSP is a sub-partition of the SM. |
| sys | Logical grouping of several units |
| tpc | The Thread Processing Cluster is a unit in the GPC. It contains one or more SM, Texture and L1 units as well as the Instruction Cache and the Indexed Constant Cache. |
Subunits
| aperture_device | Memory interface to local device memory (dram) |
| aperture_peer | Memory interface to remote device memory |
| aperture_sysmem | Memory interface to system memory |
| l1 | Level 1 cache |
| lsu | Load/Store unit |
| mem_global | Global memory |
| mem_lg | Local/Global memory |
| mem_local | Local memory |
| mem_shared | Shared memory |
| mem_surface | Surface memory |
| mem_texture | Texture memory |
| mio | Memory input/output |
| mioc | Memory input/output control |
| rf | Register file |
| texin | TEXIN |
| xbar | The Crossbar (XBAR) is responsible for carrying packets from a given source unit to a specific destination unit. |
3.4. Range and Precision
Overview
In general, measurement values that lie outside the expected logical range of a metric can be attributed to one or more of the below root-causes. If values are exceeding such range, they are not clamped by the tool to their expected value on purpose to ensure that the rest of the profiler report remains self-consistent.
Asynchronous GPU activity
GPU engines other than the one measured by a metric (display, copy engine, video encoder, video decoder, etc.) potentially access shared resources during profiling. Such chip-global shared resources include L2, DRAM, PCIe, and NVLINK. If the kernel launch is small, the other engine(s) can cause significant confusion in e.g. the DRAM results, since it is not possible to isolate the DRAM traffic of the SM. To reduce the impact of such asynchronous units, consider profiling on a GPU without active display and without other processes that can access the GPU at the time.
Multi-pass data collection
Out of range metrics often occur when the profiler replays the kernel launch to collect metrics, and work distribution is significantly different across replay passes. A metric such as hit rate (hits / queries) can have significant error if hits and queries are collected on different passes and the kernel does not saturate the GPU to reach a steady state (generally > 20 µs). Similarly, it can show unexpected values when the workload is inherently variable, as e.g. in the case of spin loops.
To mitigate the issue, when applicable try to increase the measured workload to allow the GPU to reach a steady state for each launch. Reducing the number of metrics collected at the same time can also improve precision by increasing the likelyhood that counters contributing to one metric are collected in a single pass.
Tool issue
If you still observe metric issues after following the guidelines above, please reach out to us and describe your issue.
4. Sampling
NVIDIA Nsight Compute supports periodic sampling of the warp program counter and warp scheduler state on desktop devices of compute capability 6.1 and above.
At a fixed interval of cycles, the sampler in each streaming multiprocessor selects an active warp and outputs the program counter and the warp scheduler state. The tool selects the minimum interval for the device. On small devices, this can be every 32 cycles. On larger chips with more multiprocessors, this may be 2048 cycles. The sampler selects a random active warp. On the same cycle the scheduler may select a different warp to issue.
4.1. Warp Scheduler States
| State | Hardware Support | Description |
|---|---|---|
| Allocation | 5.2-6.1 | Warp was stalled waiting for a branch to resolve, waiting for all memory operations to retire, or waiting to be allocated to the micro-scheduler. |
| Barrier | 5.2+ | Warp was stalled waiting for sibling warps at a CTA barrier. A high number of warps waiting at a barrier is commonly caused by diverging code paths before a barrier. This causes some warps to wait a long time until other warps reach the synchronization point. Whenever possible, try to divide up the work into blocks of uniform workloads. Also, try to identify which barrier instruction causes the most stalls, and optimize the code executed before that synchronization point first. |
| Dispatch | 5.2+ | Warp was stalled waiting on a dispatch stall. A warp stalled during dispatch has an instruction ready to issue, but the dispatcher holds back issuing the warp due to other conflicts or events. |
| Drain | 5.2+ | Warp was stalled after EXIT waiting for all memory instructions to complete so that warp resources can be freed. A high number of stalls due to draining warps typically occurs when a lot of data is written to memory towards the end of a kernel. Make sure the memory access patterns of these store operations are optimal for the target architecture and consider parallelized data reduction, if applicable. |
| IMC Miss | 5.2+ | Warp was stalled waiting for an immediate constant cache (IMC) miss. A read from constant memory costs one memory read from device memory only on a cache miss; otherwise, it just costs one read from the constant cache. Accesses to different addresses by threads within a warp are serialized, thus the cost scales linearly with the number of unique addresses read by all threads within a warp. As such, the constant cache is best when threads in the same warp access only a few distinct locations. If all threads of a warp access the same location, then constant memory can be as fast as a register access. |
| LG Throttle | 7.0+ | Warp was stalled waiting for the L1 instruction queue for local and global (LG) memory operations to be not full. Typically, this stall occurs only when executing local or global memory instructions extremely frequently. If applicable, consider combining multiple lower-width memory operations into fewer wider memory operations and try interleaving memory operations and math instructions. |
| Long Scoreboard | 5.2+ | Warp was stalled waiting for a scoreboard dependency on a L1TEX (local, global, surface, tex) operation. To reduce the number of cycles waiting on L1TEX data accesses verify the memory access patterns are optimal for the target architecture, attempt to increase cache hit rates by increasing data locality, or by changing the cache configuration, and consider moving frequently used data to shared memory. |
| Math Pipe Throttle | 5.2+ | Warp was stalled waiting for the execution pipe to be available. This stall occurs when all active warps execute their next instruction on a specific, oversubscribed math pipeline. Try to increase the number of active warps to hide the existent latency or try changing the instruction mix to utilize all available pipelines in a more balanced way. |
| Membar | 5.2+ | Warp was stalled waiting on a memory barrier. Avoid executing any unnecessary memory barriers and assure that any outstanding memory operations are fully optimized for the target architecture. |
| MIO Throttle | 5.2+ | Warp was stalled waiting for the MIO (memory input/output) instruction queue to be not full. This stall reason is high in cases of extreme utilization of the MIO pipelines, which include special math instructions, dynamic branches, as well as shared memory instructions. |
| Misc | 5.2+ | Warp was stalled for a miscellaneous hardware reason. |
| No Instructions | 5.2+ | Warp was stalled waiting to be selected to fetch an instruction or waiting on an instruction cache miss. A high number of warps not having an instruction fetched is typical for very short kernels with less than one full wave of work in the grid. Excessively jumping across large blocks of assembly code can also lead to more warps stalled for this reason. |
| Not Selected | 5.2+ | Warp was stalled waiting for the micro scheduler to select the warp to issue. Not selected warps are eligible warps that were not picked by the scheduler to issue that cycle as another warp was selected. A high number of not selected warps typically means you have sufficient warps to cover warp latencies and you may consider reducing the number of active warps to possibly increase cache coherence and data locality. |
| Selected | 5.2+ | Warp was selected by the micro scheduler and issued an instruction. |
| Short Scoreboard | 5.2+ | Warp was stalled waiting for a scoreboard dependency on a MIO (memory input/output) operation (not to L1TEX). The primary reason for a high number of stalls due to short scoreboards is typically memory operations to shared memory. Other reasons include frequent execution of special math instructions (e.g. MUFU) or dynamic branching (e.g. BRX, JMX). Verify if there are shared memory operations and reduce bank conflicts, if applicable. |
| Sleeping | 7.0+ | Warp was stalled due to all threads in the warp being in the blocked, yielded, or sleep state. Reduce the number of executed NANOSLEEP instructions, lower the specified time delay, and attempt to group threads in a way that multiple threads in a warp sleep at the same time. |
| Tex Throttle | 5.2+ | Warp was stalled waiting for the L1 instruction queue for texture operations to be not full. This stall reason is high in cases of extreme utilization of the L1TEX pipeline. If applicable, consider combining multiple lower-width memory operations into fewer wider memory operations and try interleaving memory operations and math instructions. |
| Wait | 5.2+ | Warp was stalled waiting on a fixed latency execution dependency. Typically, this stall reason should be very low and only shows up as a top contributor in already highly optimized kernels. If possible, try to further increase the number of active warps to hide the corresponding instruction latencies. |
5. Reproducibility
In order to provide actionable and deterministic results across application runs, NVIDIA Nsight Compute applies various methods to adjust how metrics are collected. This includes serializing kernel launches, purging GPU caches before each kernel replay or adjusting GPU clocks.
5.1. Serialization
NVIDIA Nsight Compute serializes kernel launches within the profiled application, potentially across multiple processes profiled by one or more instances of the tool at the same time.
Serialization across processes is necessary since for the collection of HW performance metrics, some GPU and driver objects can only be acquired by a single process at a time. To achieve this, the lock file TMPDIR/nsight-compute-lock is used. On Windows, TMPDIR is the path returned by the Windows GetTempPath API function. On other platforms, it is the path supplied by the first environment variable in the list TMPDIR, TMP, TEMP, TEMPDIR. If none of these is found, it's /tmp.
Serialization within the process is required for most metrics to be mapped to the proper kernel. In addition, without serialization, performance metric values might vary widely if kernel execute concurrently on the same device.
It is currently not possible to disable this tool behavior.
5.2. Clock Control
For many metrics, their value is directly influenced by the current GPU SM and memory clock frequencies. For example, if a kernel instance is profiled that has prior kernel executions in the application, the GPU might already be in a higher clocked state and the measured kernel duration, along with other metrics, will be affected. Likewise, if a kernel instance is the first kernel to be launched in the application, GPU clocks will regularly be lower. In addition, due to kernel replay, the metric value might depend on which replay pass it is collected in, as later passes would result in higher clock states.
To mitigate this non-determinism, NVIDIA Nsight Compute attempts to limit GPU clock frequencies to their base value. As a result, metric values are less impacted by the location of the kernel in the application, or by the number of the specific replay pass.
However, this behavior might be undesirable for analysis of the kernel, e.g. in cases where an external tool is used to fix clock frequencies, or where the behavior of the kernel within the application is analyzed. To solve this, users can adjust the --clock-control option to specify if any clock frequencies should be fixed by the tool.
Note that thermal throttling directed by the driver cannot be controlled by the tool and always overrides any selected options.
5.3. Cache Control
As explained in Kernel Replay, the kernel might need to be replayed multiple times to collect all requested metrics. While NVIDIA Nsight Compute can save and restore the contents of GPU device memory accessed by the kernel for each pass, it cannot do the same for the contents of HW caches, such as e.g. the L1 and L2 cache.
This can have the effect that later replay passes might have better or worse performance than e.g. the first pass, as the caches could already be primed with the data last accessed by the kernel. Similarly, the values of HW performance counters collected by the first pass might depend on which kernels, if any, were executed prior to the measured kernel launch.
In order to make HW performance counter value more deterministic, NVIDIA Nsight Compute by default flushes all GPU caches before each replay pass. As a result, in each pass, the kernel will access a clean cache and the behavior will be as if the kernel was executed in complete isolation.
This behavior might be undesirable for performance analysis, especially if the measurement focuses on a kernel within a larger application execution, and if the collected data targets cache-centric metrics. In this case, you can use --cache-control none to disable flushing of any HW cache by the tool.
6. Special Configurations
6.1. Multi Instance GPU
Multi-Instance GPU (MIG) is a feature that allows a GPU to be partitioned into multiple CUDA devices. The partitioning is carried out on two levels: First, a GPU can be split into one or multiple GPU Instances. Each GPU Instance claims ownership of one or more streaming multiprocessors (SM), a subset of the overall GPU memory, and possibly other GPU resources, such as the video encoders/decoders. Second, each GPU Instance can be further partitioned into one or more Compute Instances. Each Compute Instance has exclusive ownership of its assigned SMs of the GPU Instance. However, all Compute Instances within a GPU Instance share the GPU Instance's memory and memory bandwidth. Every Compute Instance acts and operates as a CUDA device with a unique device ID. See the driver release notes as well as the documentation for the nvidia-smi CLI tool for more information on how to configure MIG instances.
For profiling, a Compute Instance can be of one of two types: isolated or shared.
An isolatedCompute Instance owns all of its assigned resources and does not share any GPU unit with another Compute Instance. In other words, the Compute Instance is the same size as its parent GPU Instance and consequently does not have any other sibling Compute Instances. Profiling works as usual for isolated Compute Instances.
A sharedCompute Instance uses GPU resources that can potentially also be accessed by other Compute Instances in the same GPU Instance. Due to this resource sharing, collecting profiling data from those shared units is not permitted. Attempts to collect metrics from a shared unit fail with an error message of ==ERROR== Failed to access the following metrics. When profiling on a MIG instance, it is not possible to collect metrics from GPU units that are shared with other MIG instances followed by the list of failing metrics. Collecting only metrics from GPU units that are exclusively owned by a shared Compute Instance is still possible.
All Compute Instances on a GPU share the same clock frequencies. As a result, NVIDIA Nsight Compute is not able to set the clock frequency on any Compute Instance for profiling. You can continue analyzing kernels without fixed clock frequencies (using --clock-control none; see here for more details). If you have sufficient permissions, nvidia-smi can be used to configure a fixed frequency for the whole GPU by calling nvidia-smi --lock-gpu-clocks=tdp,tdp. This sets the GPU clocks to the base TDP frequency until you reset the clocks by calling nvidia-smi --reset-gpu-clocks.
7. Roofline Charts
Roofline charts provide a very helpful way to visualize achieved performance on complex processing units, like GPUs. This section introduces the Roofline charts that are presented within a profile report.
7.1. Overview
Kernel performance is not only dependent on the operational speed of the GPU. Since a kernel requires data to work on, performance is also dependent on the rate at which the GPU can feed data to the kernel. A typical roofline chart combines the peak performance and memory bandwidth of the GPU, with a metric called Arithmetic Intensity (a ratio between Work and Memory Traffic), into a single chart, to more realistically represent the achieved performance of the profiled kernel. A simple roofline chart might look like the following:
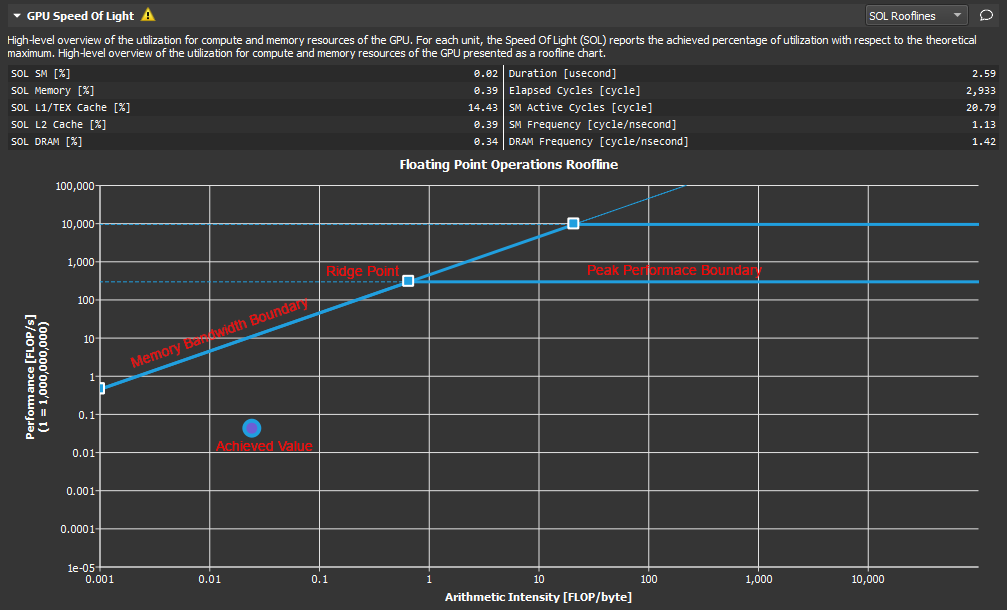
- Vertical Axis - The vertical axis represents Floating Point Operations per Second (FLOPS). For GPUs this number can get quite large and so the numbers on this axis can be scaled for easier reading (as shown here). In order to better accommodate the range, this axis is rendered using a logarithmic scale.
- Horizontal Axis - The horizontal axis represents Arithmetic Intensity, which is the ratio between Work (expressed in floating point operations per second), and Memory Traffic (expressed in bytes per second). The resulting unit is in floating point operations per byte. This axis is also shown using a logarithmic scale.
- Memory Bandwidth Boundary - The memory bandwidth boundary is the sloped part of the roofline. By default, this slope is determined entirely by the memory transfer rate of the GPU but can be customized inside the SpeedOfLight_RooflineChart.section file if desired.
- Peak Performance Boundary - The peak performance boundary is the flat part of the roofline By default, this value is determined entirely by the peak performance of the GPU but can be customized inside the SpeedOfLight_RooflineChart.section file if desired.
- Ridge Point - The ridge point is the point at which the memory bandwidth boundary meets the peak performance boundary. This point is a useful reference when analyzing kernel performance.
- Achieved Value - The achieved value represents the performance of the profiled kernel. If baselines are being used, the roofline chart will also contain an achieved value for each baseline. The outline color of the plotted achieved value point can be used to determine from which baseline the point came.
7.2. Analysis
The roofline chart can be very helpful in guiding performance optimization efforts for a particular kernel.
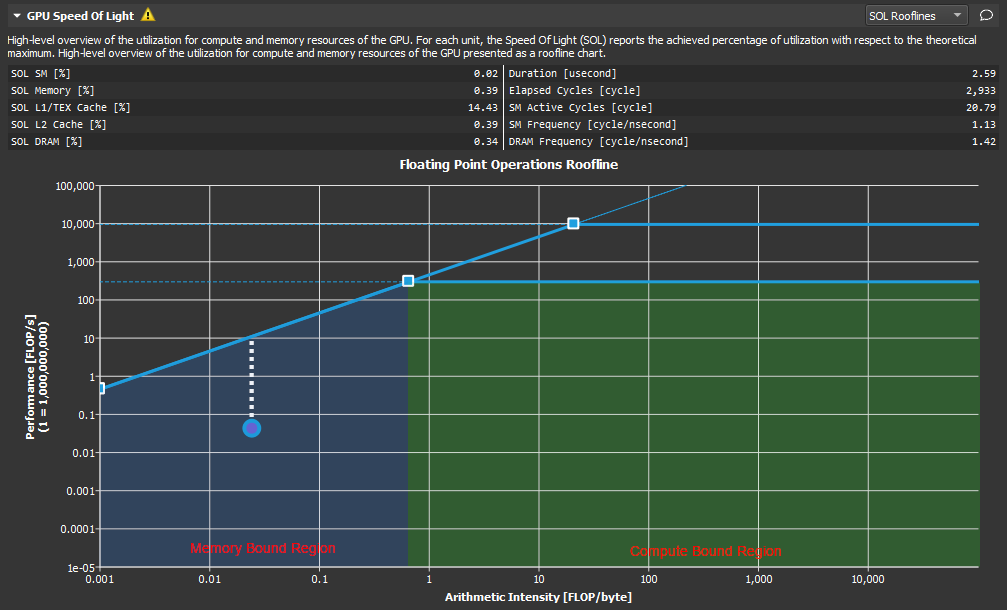
As shown here, the ridge point partitions the roofline chart into two regions. The area shaded in blue under the sloped Memory Bandwidth Boundary is the Memory Bound region, while the area shaded in green under the Peak Performance Boundary is the Compute Bound region. The region in which the achieved value falls, determines the current limiting factor of kernel performance.
The distance from the achieved value to the respective roofline boundary (shown in this figure as a dotted white line), represents the opportunity for performance improvement. The closer the achieved value is to the roofline boundary, the more optimal is its performance. An achieved value that lies on the Memory Bandwidth Boundary but is not yet at the height of the ridge point would indicate that any further improvements in overall FLOP/s are only possible if the Arithmetic Intensity is increased at the same time.
Using the baseline feature in combination with roofline charts, is a good way to track optimization progress over a number of kernel executions.
8. Memory Chart
The Memory Chart shows a graphical, logical representation of performance data for memory subunits on and off the GPU. Performance data includes transfer sizes, hit rates, number of instructions or requests, etc.
8.1. Overview
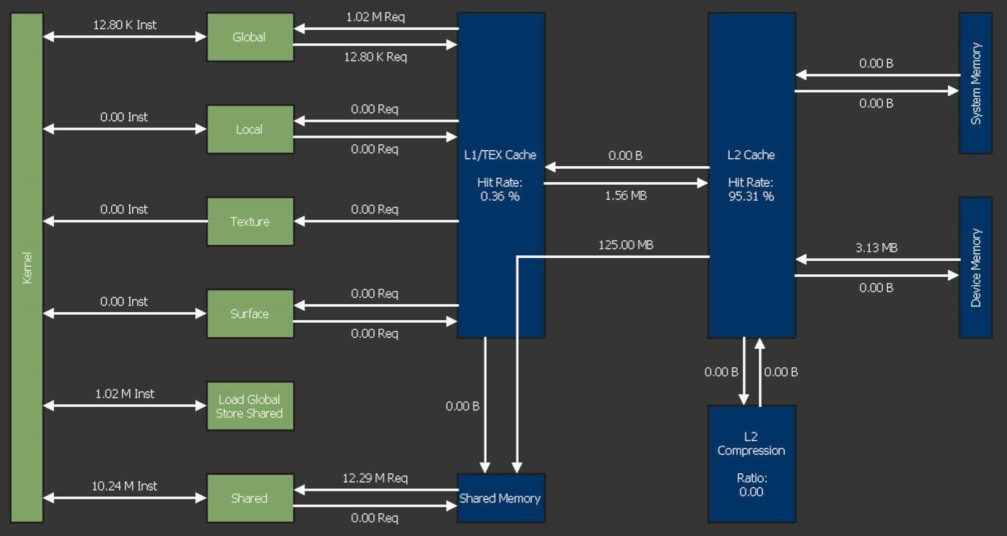
Logical Units (green)
Logical units are shown in green color.- Kernel: The CUDA kernel executing on the GPU's Streaming Multiprocessors
- Global: CUDA global memory
- Local: CUDA local memory
- Texture: CUDA texture memory
- Surface: CUDA surface memory
- Shared: CUDA shared memory
- Load Global Store Shared: Instructions loading directly from global into shared memory without intermediate register file access
Physical Units (blue)
Physical units are shown in blue color.- L1/TEX Cache: The L1/Texture cache. The underlying physical memory is split between this cache and the user-managed Shared Memory.
- Shared Memory: CUDA's user-managed shared memory. The underlying physical memory is split between this and the L1/TEX Cache.
- L2 Cache: The L2 cache
- L2 Compression: The memory compression unit of the L2 Cache
- System Memory: Off-chip system (CPU) memory
- Device Memory: On-chip device (GPU) memory
Depending on the exact GPU architecture, the exact set of shown units can vary, as not all GPUs have all units.
Links
Links between Kernel and other logical units represent the number of executed instructions (Inst) targeting the respective unit. For example, the link between Kernel and Global represents the instructions loading from or storing to the global memory space. Instructions using the NVIDIA A100's Load Global Store Shared paradigm are shown separately, as their register or cache access behavior can be different from regular global loads or shared stores.
Links between logical units and blue, physical units represent the number of requests (Req) issued as a result of their respective instructions. For example, the link going from L1/TEX Cache to Global shows the number of requests generated due to global load instructions.
9. FAQ
- n/a metric values
n/a means that the metric value is "not available". The most common reason is that the requested metric does not exist. This can either be the result of a typo, or a missing suffix. Verify the metric name against the output of of the --query-metricsNVIDIA Nsight Compute CLI option.
If the metric name was copied (e.g. from an old version of this documentation), make sure that it does not contain zero-width unicode characters.
Finally, the metric might simply not exist for the targeted GPU architecture. For example, the IMMA pipeline metric sm__inst_executed_pipe_tensor_op_imma.avg.pct_of_peak_sustained_active is not available on GV100 chips.
- Metric values outside the expected logical range
This includes e.g percentages exceeding 100% or metrics reporting negative values. For further details, see Range and Precision.
- ERR_NVGPUCTRPERM - The user does not have permission to access NVIDIA GPU Performance Counters on the target device.
By default, NVIDIA drivers require elevated permissions to access GPU performance counters. You can either start profiling as root/using sudo, or by enabling non-admin profiling. For further details, see https://developer.nvidia.com/ERR_NVGPUCTRPERM.
- Unsupported GPU
This indicates that the GPU, on which the current kernel is launched, is not supported. See the Release Notes for a list of devices supported by your version of NVIDIA Nsight Compute. It can also indicate that the current GPU configuration is not supported. For example, NVIDIA Nsight Compute might not be able to profile GPUs in SLI configuration.
- Connection error detected communicating with target application.
The inter-process connection to the profiled application unexpectedly dropped. This happens if the application is killed or signals an exception (e.g. segmentation fault).
- Failed to connect. The target process may have exited.This occurs if
- the application does not call any CUDA API calls before it exits.
- the application terminates early because it was started from the wrong working directory, or with the wrong arguments. In this case, check the details in the Connection Dialog.
- the application crashes before calling any CUDA API calls.
- the application launches child processes which use the CUDA. In this case, launch with the --target-processes all option.
- The profiler returned an error code: (number)
For the non-interactive Profile activity, the NVIDIA Nsight Compute CLI is started to generate the report. If either the application exited with a non-zero return code, or the NVIDIA Nsight Compute CLI encountered an error itself, the resulting return code will be shown in this message.
For example, if the application hit an segmentation fault (SIGSEGV) on Linux, it will likely return error code 11. All non-zero return codes are considered errors, so the message is also shown if the application exits with return code 1 during regular execution.
To debug this issue, it can help to run the data collection directly from the command line using ncu in order to observe the application's and the profiler's command line output, e.g. ==ERROR== The application returned an error code (11)
- Failed to open/create lock file (path). Please check that this process has write permissions on this file.
NVIDIA Nsight Compute failed to create or open the file (path) with write permissions. This file is used for inter-process serialization. NVIDIA Nsight Compute does not remove this file after profiling by design. The error occurs if the file was created by a profiling process with permissions that prevent the current process from writing to this file.
Notices
Notice
ALL NVIDIA DESIGN SPECIFICATIONS, REFERENCE BOARDS, FILES, DRAWINGS, DIAGNOSTICS, LISTS, AND OTHER DOCUMENTS (TOGETHER AND SEPARATELY, "MATERIALS") ARE BEING PROVIDED "AS IS." NVIDIA MAKES NO WARRANTIES, EXPRESSED, IMPLIED, STATUTORY, OR OTHERWISE WITH RESPECT TO THE MATERIALS, AND EXPRESSLY DISCLAIMS ALL IMPLIED WARRANTIES OF NONINFRINGEMENT, MERCHANTABILITY, AND FITNESS FOR A PARTICULAR PURPOSE.
Information furnished is believed to be accurate and reliable. However, NVIDIA Corporation assumes no responsibility for the consequences of use of such information or for any infringement of patents or other rights of third parties that may result from its use. No license is granted by implication of otherwise under any patent rights of NVIDIA Corporation. Specifications mentioned in this publication are subject to change without notice. This publication supersedes and replaces all other information previously supplied. NVIDIA Corporation products are not authorized as critical components in life support devices or systems without express written approval of NVIDIA Corporation.