Kernel Profiling Guide
Nsight Compute profiling guide.
Kernel Profiling Guide with metric types and meaning, data collection modes and FAQ for common problems.
1. Introduction
This guide describes various profiling topics related to NVIDIA Nsight Compute and NVIDIA Nsight Compute CLI. Most of these apply to both the UI and the CLI version of the tool.
1.1. Profiling Applications
During regular execution, a CUDA application process will be launched by the user. It communicates directly with the CUDA user-mode driver, and potentially with the CUDA runtime library.
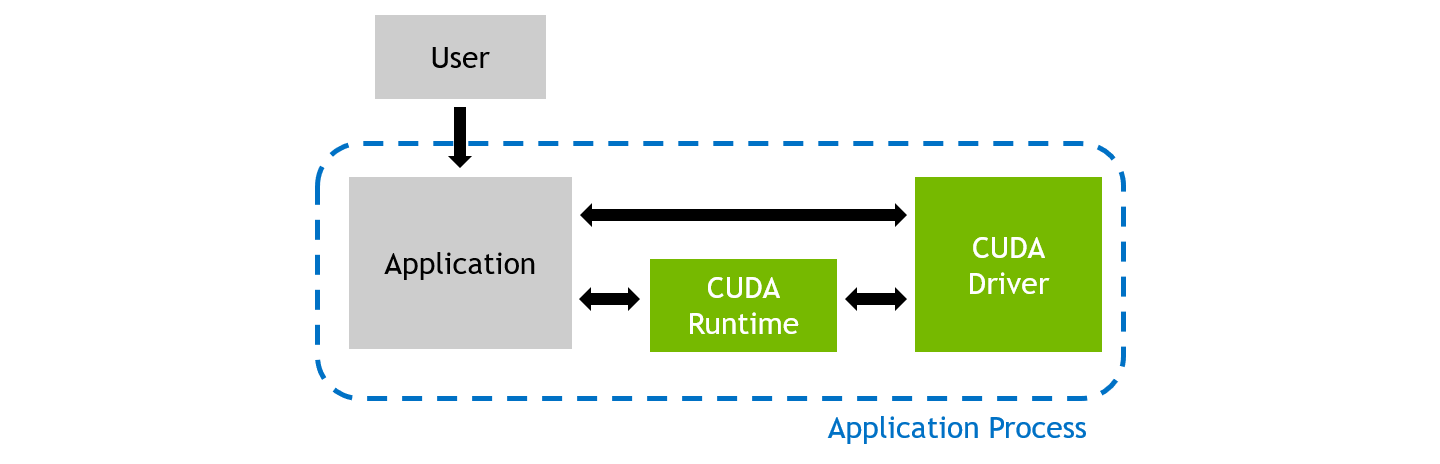
When profiling an application with NVIDIA Nsight Compute, the behavior is different. The user launches the NVIDIA Nsight Compute frontend (either the UI or the CLI) on the host system, which in turn starts the actual application as a new process on the target system. While host and target are often the same machine, the target can also be a remote system with a potentially different operating system.
The tool inserts its measurement libraries into the application process, which allow the profiler to intercept communication with the CUDA user-mode driver. In addition, when a kernel launch is detected, the libraries can collect the requested performance metrics from the GPU. The results are then transferred back to the frontend.

2. Metric Collection
Collection of performance metrics is the key feature of NVIDIA Nsight Compute. Since there is a huge list of metrics available, it is often easier to use some of the tool's pre-defined sets or sections to collect a commonly used subset. Users are free to adjust which metrics are collected for which kernels as needed, but it is important to keep in mind the Overhead associated with data collection.
2.1. Sets and Sections
NVIDIA Nsight Compute uses Section Sets (short sets) to decide, on a very high level, the amount of metrics to be collected. Each set includes one or more Sections, with each section specifying several logically associated metrics. For example, one section might include only high-level SM and memory utilization metrics, while another could include metrics associated with the memory units, or the HW scheduler.
The number and type of metrics specified by a section has significant impact on the overhead during profiling. To allow you to quickly choose between a fast, less detailed profile and a slower, more comprehensive analysis, you can select the respective section set. See Overhead for more information on profiling overhead.
By default, a relatively small number of metrics is collected. Those mostly include high-level utilization information as well as static launch and occupancy data. The latter two are regularly available without replaying the kernel launch. The default set is collected when no --set, --section and no --metrics options are passed on the command line. The full set of sections can be collected with --set full.
Use --list-sets to see the list of currently available sets. Use --list-sections to see the list of currently available sections. The default search directory and the location of pre-defined section files are also called sections/. All related command line options can be found in the NVIDIA Nsight Compute CLI documentation.
2.2. Sections and Rules
| Identifier and Filename | Description |
|---|---|
| ComputeWorkloadAnalysis (Compute Workload Analysis) | Detailed analysis of the compute resources of the streaming multiprocessors (SM), including the achieved instructions per clock (IPC) and the utilization of each available pipeline. Pipelines with very high utilization might limit the overall performance. |
| InstructionStats (Instruction Statistics) | Statistics of the executed low-level assembly instructions (SASS). The instruction mix provides insight into the types and frequency of the executed instructions. A narrow mix of instruction types implies a dependency on few instruction pipelines, while others remain unused. Using multiple pipelines allows hiding latencies and enables parallel execution. |
| LaunchStats (Launch Statistics) | Summary of the configuration used to launch the kernel. The launch configuration defines the size of the kernel grid, the division of the grid into blocks, and the GPU resources needed to execute the kernel. Choosing an efficient launch configuration maximizes device utilization. |
| MemoryWorkloadAnalysis (Memory Workload Analysis) | Detailed analysis of the memory resources of the GPU. Memory can become a limiting factor for the overall kernel performance when fully utilizing the involved hardware units (Mem Busy), exhausting the available communication bandwidth between those units (Max Bandwidth), or by reaching the maximum throughput of issuing memory instructions (Mem Pipes Busy). Depending on the limiting factor, the memory chart and tables allow to identify the exact bottleneck in the memory system. |
| Nvlink (Nvlink) | High-level summary of NVLink utilization. It shows the total received and transmitted (sent) memory, as well as the overall link peak utilization. |
| Nvlink_Tables (Nvlink_Tables) | Detailed tables with properties for each NVLink. |
| Nvlink_Topology (Nvlink_Topology) | NVLink Topology diagram shows logical NVLink connections with transmit/receive throughput. |
| Occupancy (Occupancy) | Occupancy is the ratio of the number of active warps per multiprocessor to the maximum number of possible active warps. Another way to view occupancy is the percentage of the hardware's ability to process warps that is actively in use. Higher occupancy does not always result in higher performance, however, low occupancy always reduces the ability to hide latencies, resulting in overall performance degradation. Large discrepancies between the theoretical and the achieved occupancy during execution typically indicates highly imbalanced workloads. |
| SchedulerStats (Scheduler Statistics) | Summary of the activity of the schedulers issuing instructions. Each scheduler maintains a pool of warps that it can issue instructions for. The upper bound of warps in the pool (Theoretical Warps) is limited by the launch configuration. On every cycle each scheduler checks the state of the allocated warps in the pool (Active Warps). Active warps that are not stalled (Eligible Warps) are ready to issue their next instruction. From the set of eligible warps, the scheduler selects a single warp from which to issue one or more instructions (Issued Warp). On cycles with no eligible warps, the issue slot is skipped and no instruction is issued. Having many skipped issue slots indicates poor latency hiding. |
| SourceCounters (Source Counters) | Source metrics, including branch efficiency and sampled warp stall reasons. Warp Stall Sampling metrics are periodically sampled over the kernel runtime. They indicate when warps were stalled and couldn't be scheduled. See the documentation for a description of all stall reasons. Only focus on stalls if the schedulers fail to issue every cycle. |
| SpeedOfLight (GPU Speed Of Light Throughput) | High-level overview of the throughput for compute and memory resources of the GPU. For each unit, the throughput reports the achieved percentage of utilization with respect to the theoretical maximum. Breakdowns show the throughput for each individual sub-metric of Compute and Memory to clearly identify the highest contributor. |
| WarpStateStats (Warp State Statistics) | Analysis of the states in which all warps spent cycles during the kernel execution. The warp states describe a warp's readiness or inability to issue its next instruction. The warp cycles per instruction define the latency between two consecutive instructions. The higher the value, the more warp parallelism is required to hide this latency. For each warp state, the chart shows the average number of cycles spent in that state per issued instruction. Stalls are not always impacting the overall performance nor are they completely avoidable. Only focus on stall reasons if the schedulers fail to issue every cycle. |
2.3. Replay
Depending on which metrics are to be collected, kernels might need to be replayed one or more times, since not all metrics can be collected in a single pass. For example, the number of metrics originating from hardware (HW) performance counters that the GPU can collect at the same time is limited. In addition, patch-based software (SW) performance counters can have a high impact on kernel runtime and would skew results for HW counters.
2.3.1. Kernel Replay
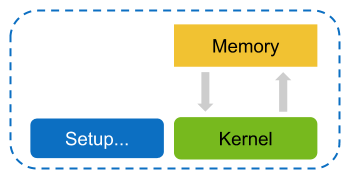
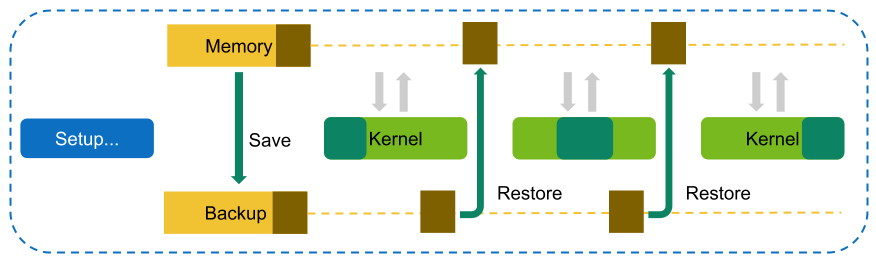
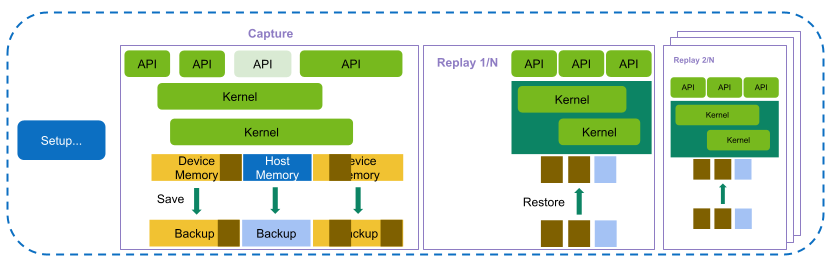
In Kernel Replay, all metrics requested for a specific kernel instance in NVIDIA Nsight Compute are grouped into one or more passes. For the first pass, all GPU memory that can be accessed by the kernel is saved. After the first pass, the subset of memory that is written by the kernel is determined. Before each pass (except the first one), this subset is restored in its original location to have the kernel access the same memory contents in each replay pass.
NVIDIA Nsight Compute attempts to use the fastest available storage location for this save-and-restore strategy. For example, if data is allocated in device memory, and there is still enough device memory available, it is stored there directly. If it runs out of device memory, the data is transferred to the CPU host memory. Likewise, if an allocation originates from CPU host memory, the tool first attempts to save it into the same memory location, if possible.
As explained in Overhead, the time needed for this increases the more memory is accessed, especially written, by a kernel. If NVIDIA Nsight Compute determines that only a single replay pass is necessary to collect the requested metrics, no save-and-restore is performed at all to reduce overhead.
2.3.2. Application Replay
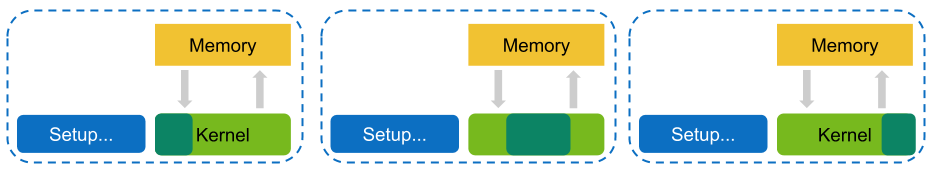
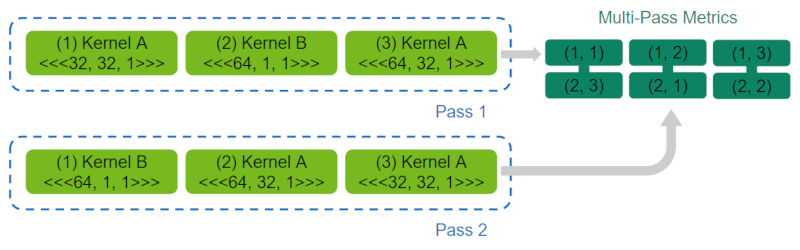
In Application Replay, all metrics requested for a specific kernel launch in NVIDIA Nsight Compute are grouped into one or more passes. In contrast to Kernel Replay, the complete application is run multiple times, so that in each run one of those passes can be collected per kernel.
For correctly identifying and combining performance counters collected from multiple application replay passes of a single kernel launch into one result, the application needs to be deterministic with respect to its kernel activities and their assignment to GPUs, contexts, streams, and potentially NVTX ranges. Normally, this also implies that the application needs to be deterministic with respect to its overall execution.
Application replay has the benefit that memory accessed by the kernel does not need to be saved and restored via the tool, as each kernel launch executes only once during the lifetime of the application process. Besides avoiding memory save-and-restore overhead, application replay also allows to disable Cache Control. This is especially useful if other GPU activities preceding a specific kernel launch are used by the application to set caches to some expected state.
In addition, application replay can support profiling kernels that have interdependencies to the host during execution. With kernel replay, this class of kernels typically hangs when being profiled, because the necessary responses from the host are missing in all but the first pass. In contrast, application replay ensures the correct behavior of the program execution in each pass.
In contrast to kernel replay, multiple passes collected via application replay imply that all host-side activities of the application are duplicated, too. If the application requires significant time for e.g. setup or file-system access, the overhead will increase accordingly.
Across application replay passes, NVIDIA Nsight Compute matches metric data for the individual, selected kernel launches. The matching strategy can be selected using the --app-replay-match option. For matching, only kernels within the same process and running on the same device are considered. By default, the grid strategy is used, which matches launches according to their kernel name and grid size. When multiple launches have the same attributes (e.g. name and grid size), they are matched in execution order.
2.3.3. Range Replay
In Range Replay, all requested metrics in NVIDIA Nsight Compute are grouped into one or more passes. In contrast to Kernel Replay and Application Replay, Range Replay captures and replays complete ranges of CUDA API calls and kernel launches within the profiled application. Metrics are then not associated with individual kernels but with the entire range. This allows the tool to execute kernels without serialization and thereby supports profiling kernels that should be run concurrently for correctness or performance reasons.
2.3.3.1. Defining Ranges
Range replay requires you to specify the range for profiling in the application. A range is defined by a start and an end marker and includes all CUDA API calls and kernels launched between these markers from any CPU thread. The application is responsible for inserting appropriate synchronization between threads to ensure that the anticipated set of API calls is captured. Range markers can be set using one of the following options:
- Profiler Start/Stop API
Set the start marker using cu(da)ProfilerStart and the end marker using cu(da)ProfilerStop. Note: The CUDA driver API variants of this API require to include cudaProfiler.h. The CUDA runtime variants require to include cuda_profiler_api.h.
This is the default for NVIDIA Nsight Compute.
- NVTX Ranges
Define the range using an NVTX Include expression. The range capture starts with the first CUDA API call and ends at the last API call for which the expression is matched, respectively. If multiple expressions are specified, a range is defined as soon as any of them matches. Hence, multiple expressions can be used to conveniently capture and profile multiple ranges for the same application execution.
The application must have been instrumented with the NVTX API for any expressions to match.
This mode is enabled by passing --nvtx --nvtx-include <expression> [--nvtx-include <expression>] to the NVIDIA Nsight Compute CLI.
- It must be possible to synchronize all active CUDA contexts at the start of the range.
- Ranges must not include unsupported CUDA API calls. See Supported APIs for the list of currently supported APIs.
- Set ranges as narrow as possible for capturing a specific set of CUDA kernel lanuches. The more API calls are included, the higher the potentially created overhead from capturing and replaying these API calls.
- Avoid freeing host allocations written by device memory during the range. This includes both heap as well as stack allocations. NVIDIA Nsight Compute does not intercept creation or destruction of generic host (CPU)-based allocations. However, to guarantee correct program execution after any replay of the range, the tool attempts to restore host allocations that were written from device memory during the capture. If these host addresses are invalid or re-assigned, the program behavior is undefined and potentially unstable. In cases where avoiding freeing such allocations is not possible, you should limit profiling to one range using --launch-count 1, set the disable-host-restore range replay option and optionally use --kill yes to terminate the process after this range.
- When defining the range markers using cu(da)ProfilerStart/Stop, prefer the CUDA driver API calls cuProfilerStart/Stop. Internally, NVIDIA Nsight Compute only intercepts the CUDA driver API variants and the CUDA runtime API may not trigger these if no CUDA context is active on the calling thread.
2.3.3.2. Supported APIs
Range replay supports a subset of the CUDA API for capture and replay. This page lists the supported functions as well as any further, API-specific limitations that may apply. If an unsupported API call is detected in the captured range, an error is reported and the range cannot be profiled. The groups listed below match the ones found in the CUDA Driver API documentation.
Generally, range replay only captures and replay CUDA Driver API calls. CUDA Runtime APIs calls can be captured when they generate only supported CUDA Driver API calls internally. Deprecated APIs are not supported.
Module Management
- cuModuleGetFunction
- cuModuleGetGlobal
- cuModuleGetSurfRef
- cuModuleGetTexRef
- cuModuleLoad
- cuModuleLoadData
- cuModuleLoadDataEx
- cuModuleLoadFatBinary
- cuModuleUnload
Memory Management
- cuArray*
- cuDeviceGetByPCIBusId
- cuDeviceGetPCIBusId
- cuMemAlloc
- cuMemAllocHost
- cuMemAllocPitch
- cuMemcpy*
- cuMemFree
- cuMemFreeHost
- cuMemGetAddressRange
- cuMemGetInfo
- cuMemHostAlloc
- cuMemHostGetDevicePointer
- cuMemHostGetFlags
- cuMemHostRegister
- cuMemHostUnregister
- cuMemset*
- cuMipmapped*
Stream Management
- cuStreamCreate*
- cuStreamDestroy
- cuStreamGet*
- cuStreamQuery
- cuStreamSetAttribute
- cuStreamSynchronize
- cuStreamWaitEvent
2.3.4. Graph Profiling
In multiple replay modes, NVIDIA Nsight Compute can profile CUDA graphs as single workload entities, rather than profile individual kernel nodes. The behavior can be toggled in the respective command line or UI options.
- Profile graphs that include mandatory concurrent kernel nodes.
- Profile graphs that include device-sided graph launches.
- Profile graph behavior more accurately across multiple kernel node launches, as caches are not purged in between nodes.
Note that when graph profiling is enabled, certain metrics such as instruction-level source metrics are not available. This then also applies to kernels profiled outside of graphs.
2.4. Compatibility
The set of available replay modes and metrics depends on the type of GPU workload to profile.
| Workload Type | Replay Mode | Metric Groups | |||||
|---|---|---|---|---|---|---|---|
| Kernel | Application | Range | Hardware Counters / SMSP | Unit-Level Source | Instruction-Level Source | Launch | |
| Kernel | Yes | Yes | Yes | Yes | Yes | Yes | Yes |
| Range | No | No | Yes | Yes | Yes | No | Some |
| Graph 1 | Yes | No | No | Yes | Yes | No | Some |
2.5. Profile Series
The performance of a kernel is highly dependent on the used launch parameters. Small changes to the launch parameters can have a significant effect on the runtime behavior of the kernel. However, identifying the best parameter set for a kernel by manually testing a lot of combinations can be a tedious process.
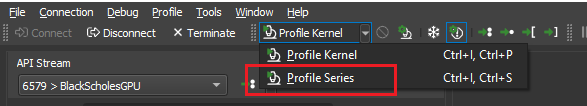
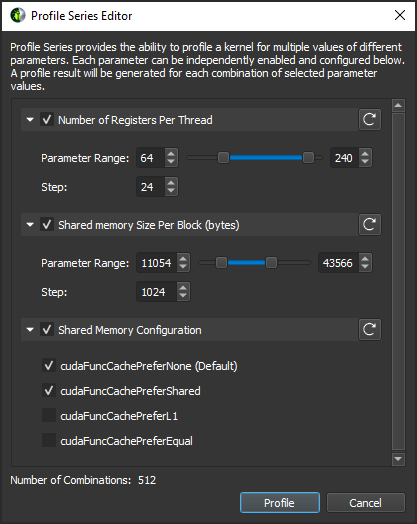
To make this workflow faster and more convenient, Profile Series provide the ability to automatically profile a single kernel multiple times with changing parameters. The parameters to be modified and values to be tested can be independently enabled and configured. For each combination of selected parameter values a unique profile result is collected. And the modified parameter values are tracked in the description of the results of a series. By comparing the results of a profile series, the kernel’s behavior on the changing parameters can be seen and the most optimal parameter set can be identified quickly.
2.6. Overhead
As with most measurements, collecting performance data using NVIDIA Nsight Compute CLI incurs some runtime overhead on the application. The overhead does depend on a number of different factors:
- Number and type of collected metrics
Depending on the selected metric, data is collected either through a hardware performance monitor on the GPU, through software patching of the kernel instructions or via a launch or device attribute. The overhead between these mechanisms varies greatly, with launch and device attributes being "statically" available and requiring no kernel runtime overhead.
Furthermore, only a limited number of metrics can be collected in a single pass of the kernel execution. If more metrics are requested, the kernel launch is replayed multiple times, with its accessible memory being saved and restored between subsequent passes to guarantee deterministic execution. Therefore, collecting more metrics can significantly increase overhead by requiring more replay passes and increasing the total amount of memory that needs to be restored during replay.
- The collected section set
Since each set specifies a group of section to be collected, choosing a less comprehensive set can reduce profiling overhead. See the --set command in the NVIDIA Nsight Compute CLI documentation.
- Number of collected sections
Since each section specifies a set metrics to be collected, selecting fewer sections can reduce profiling overhead. See the --section command in the NVIDIA Nsight Compute CLI documentation.
- Number of profiled kernels
By default, all selected metrics are collected for all launched kernels. To reduce the impact on the application, you can try to limit performance data collection to as few kernel functions and instances as makes sense for your analysis. See the filtering commands in the NVIDIA Nsight Compute CLI documentation.
There is a relatively high one-time overhead for the first profiled kernel in each context to generate the metric configuration. This overhead does not occur for subsequent kernels in the same context, if the list of collected metrics remains unchanged.
- GPU Architecture
For some metrics, the overhead can vary depending on the exact chip they are collected on, e.g. due to varying number of units on the chip. Similarly, the overhead for resetting the L2 cache in-between kernel replay passes depends on the size of that cache.
3. Metrics Guide
3.1. Hardware Model
Compute Model
All NVIDIA GPUs are designed to support a general purpose heterogeneous parallel programming model, commonly known as Compute. This model decouples the GPU from the traditional graphics pipeline and exposes it as a general purpose parallel multi-processor. A heterogeneous computing model implies the existence of a host and a device, which in this case are the CPU and GPU, respectively. At a high level view, the host (CPU) manages resources between itself and the device and will send work off to the device to be executed in parallel.
- A Grid is a 1D, 2D or 3D array of thread blocks.
- A Block is a 1D, 2D or 3D array of threads, also known as a Cooperative Thread Array (CTA).
- A Thread is a single thread which runs on one of the GPU's SM units.
The purpose of the Grid, Block, Thread hierarchy is to expose a notion of locality amongst a group of threads, i.e. a Cooperative Thread Array (CTA). In CUDA, CTAs are referred to as Thread Blocks. The architecture can exploit this locality by providing fast shared memory and barriers between the threads within a single CTA. When a Grid is launched, the architecture guarantees that all threads within a CTA will run concurrently on the same SM. Information on the grids and blocks can be found in the Launch Statistics section.
The number of CTAs that fit on each SM depends on the physical resources required by the CTA. These resource limiters include the number of threads and registers, shared memory utilization, and hardware barriers. The number CTAs per SM is referred to as the CTA occupancy, and these physical resources limit this occupancy. Details on the kernel's occupancy are collected by the Occupancy section.
Each CTA can be scheduled on any of the available SMs, where there is no guarantee in the order of execution. As such, CTAs must be entirely independent, which means it is not possible for one CTA to wait on the result of another CTA. As CTAs are independent, the host (CPU) can launch a large Grid that will not fit on the hardware all at once, however any GPU will still be able to run it and produce the correct results.
CTAs are further divided into groups of 32 threads called Warps. If the number of threads in a CTA is not dividable by 32, the last warp will contain the remaining number of threads.
The total number of CTAs that can run concurrently on a given GPU is referred to as Wave. Consequently, the size of a Wave scales with the number of available SMs of a GPU, but also with the occupancy of the kernel.
Streaming Multiprocessor
The Streaming Multiprocessor (SM) is the core processing unit in the GPU. The SM is optimized for a wide diversity of workloads, including general-purpose computations, deep learning, ray tracing, as well as lighting and shading. The SM is designed to simultaneously execute multiple CTAs. CTAs can be from different grid launches.
The SM implements an execution model called Single Instruction Multiple Threads (SIMT), which allows individual threads to have unique control flow while still executing as part of a warp. The Turing SM inherits the Volta SM's independent thread scheduling model. The SM maintains execution state per thread, including a program counter (PC) and call stack. The independent thread scheduling allows the GPU to yield execution of any thread, either to make better use of execution resources or to allow a thread to wait for data produced by another thread possibly in the same warp. Collecting the Source Counters section allows you to inspect instruction execution and predication details on the Source Page, along with Sampling information.
- Warp Scheduler
- Register File
-
Execution Units/Pipelines/Cores
- Integer Execution units
- Floating Point Execution units
- Memory Load/Store units
- Special Function unit
- Tensor Cores
- Unified L1 Data Cache / Shared Memory
- Texture units
- RT Cores, if available
A warp is allocated to a sub partition and resides on the sub partition from launch to completion. A warp is referred to as active or resident when it is mapped to a sub partition. A sub partition manages a fixed size pool of warps. On Volta architectures, the size of the pool is 16 warps. On Turing architectures the size of the pool is 8 warps. Active warps can be in eligible state if the warp is ready to issue an instruction. This requires the warp to have a decoded instruction, all input dependencies resolved, and for the function unit to be available. Statistics on active, eligible and issuing warps can be collected with the Scheduler Statistics section.
- an instruction fetch,
- a memory dependency (result of memory instruction),
- an execution dependency (result of previous instruction), or
- a synchronization barrier.
The most important resource under the compiler's control is the number of registers used by a kernel. Each sub partition has a set of 32-bit registers, which are allocated by the HW in fixed-size chunks. The Launch Statistics section shows the kernel's register usage.
Memory
Global memory is a 49-bit virtual address space that is mapped to physical memory on the device, pinned system memory, or peer memory. Global memory is visible to all threads in the GPU. Global memory is accessed through the SM L1 and GPU L2.
Local memory is private storage for an executing thread and is not visible outside of that thread. It is intended for thread-local data like thread stacks and register spills. Local memory addresses are translated to global virtual addresses by the the AGU unit. Local memory has the same latency as global memory. One difference between global and local memory is that local memory is arranged such that consecutive 32-bit words are accessed by consecutive thread IDs. Accesses are therefore fully coalesced as long as all threads in a warp access the same relative address (e.g., same index in an array variable, same member in a structure variable, etc.).
Shared memory is located on chip, so it has much higher bandwidth and much lower latency than either local or global memory. Shared memory can be shared across a compute CTA. Compute CTAs attempting to share data across threads via shared memory must use synchronization operations (such as __syncthreads()) between stores and loads to ensure data written by any one thread is visible to other threads in the CTA. Similarly, threads that need to share data via global memory must use a more heavyweight global memory barrier.
Shared memory has 32 banks that are organized such that successive 32-bit words map to successive banks that can be accessed simultaneously. Any 32-bit memory read or write request made of 32 addresses that fall in 32 distinct memory banks can therefore be serviced simultaneously, yielding an overall bandwidth that is 32 times as high as the bandwidth of a single request. However, if two addresses of a memory request fall in the same memory bank, there is a bank conflict and the access has to be serialized.
A shared memory request for a warp does not generate a bank conflict between two threads that access any address within the same 32-bit word (even though the two addresses fall in the same bank). When multiple threads make the same read access, one thread receives the data and then broadcasts it to the other threads. When multiple threads write to the same location, only one thread succeeds in the write; which thread that succeeds is undefined.
Detailed memory metrics are collected by the Memory Workload Analysis section.
Caches
All GPU units communicate to main memory through the Level 2 cache, also known as the L2. The L2 cache sits between on-chip memory clients and the framebuffer. L2 works in physical-address space. In addition to providing caching functionality, L2 also includes hardware to perform compression and global atomics.
The Level 1 Data Cache, or L1, plays a key role in handling global, local, shared, texture, and surface memory reads and writes, as well as reduction and atomic operations. On Volta and Turing architectures there are , there are two L1 caches per TPC, one for each SM. For more information on how L1 fits into the texturing pipeline, see the TEX unit description. Also note that while this section often uses the name "L1", it should be understood that the L1 data cache, shared data, and the Texture data cache are one and the same.
L1 receives requests from two units: the SM and TEX. L1 receives global and local memory requests from the SM and receives texture and surface requests from TEX. These operations access memory in the global memory space, which L1 sends through a secondary cache, the L2.
Cache hit and miss rates as well as data transfers are reported in the Memory Workload Analysis section.
Texture/Surface
The TEX unit performs texture fetching and filtering. Beyond plain texture memory access, TEX is responsible for the addressing, LOD, wrap, filter, and format conversion operations necessary to convert a texture read request into a result.
TEX receives two general categories of requests from the SM via its input interface: texture requests and surface load/store operations. Texture and surface memory space resides in device memory and are cached in L1. Texture and surface memory are allocated as block-linear surfaces (e.g. 2D, 2D Array, 3D). Such surfaces provide a cache-friendly layout of data such that neighboring points on a 2D surface are also located close to each other in memory, which improves access locality. Surface accesses are bounds-checked by the TEX unit prior to accessing memory, which can be used for implementing different texture wrapping modes.
The L1 cache is optimized for 2D spatial locality, so threads of the same warp that read texture or surface addresses that are close together in 2D space will achieve optimal performance. The L1 cache is also designed for streaming fetches with constant latency; a cache hit reduces DRAM bandwidth demand but not fetch latency. Reading device memory through texture or surface memory presents some benefits that can make it an advantageous alternative to reading memory from global or constant memory.
Information on texture and surface memory can be found in the Memory Workload Analysis section.
3.2. Metrics Structure
Metrics Overview
NVIDIA Nsight Compute uses an advanced metrics calculation system, designed to help you determine what happened (counters and metrics), and how close the program reached to peak GPU performance (throughputs as a percentage). Every counter has associated peak rates in the database, to allow computing its throughput as a percentage.
Throughput metrics return the maximum percentage value of their constituent counters. These constituents have been carefully selected to represent the sections of the GPU pipeline that govern peak performance. While all counters can be converted to a %-of-peak, not all counters are suitable for peak-performance analysis; examples of unsuitable counters include qualified subsets of activity, and workload residency counters. Using throughput metrics ensures meaningful and actionable analysis.
Two types of peak rates are available for every counter: burst and sustained. Burst rate is the maximum rate reportable in a single clock cycle. Sustained rate is the maximum rate achievable over an infinitely long measurement period, for "typical" operations. For many counters, burst equals sustained. Since the burst rate cannot be exceeded, percentages of burst rate will always be less than 100%. Percentages of sustained rate can occasionally exceed 100% in edge cases.
Metrics Entities
While in NVIDIA Nsight Compute, all performance counters are named metrics, they can be split further into groups with specific properties. For metrics collected via the PerfWorks measurement library, the following entities exist:
| .sum | The sum of counter values across all unit instances. |
| .avg | The average counter value across all unit instances. |
| .min | The minimum counter value across all unit instances. |
| .max | The maximum counter value across all unit instances. |
| .peak_sustained | the peak sustained rate |
| .peak_sustained_active | the peak sustained rate during unit active cycles |
| .peak_sustained_active.per_second | the peak sustained rate during unit active cycles, per second * |
| .peak_sustained_elapsed | the peak sustained rate during unit elapsed cycles |
| .peak_sustained_elapsed.per_second | the peak sustained rate during unit elapsed cycles, per second * |
| .peak_sustained_region | the peak sustained rate over a user-specified "range" |
| .peak_sustained_region.per_second | the peak sustained rate over a user-specified "range", per second * |
| .peak_sustained_frame | the peak sustained rate over a user-specified "frame" |
| .peak_sustained_frame.per_second | the peak sustained rate over a user-specified "frame", per second * |
| .per_second | the number of operations per second |
| .per_cycle_active | the number of operations per unit active cycle |
| .per_cycle_elapsed | the number of operations per unit elapsed cycle |
| .per_cycle_in_region | the number of operations per user-specified "range" cycle |
| .per_cycle_in_frame | the number of operations per user-specified "frame" cycle |
| .pct_of_peak_sustained_active | % of peak sustained rate achieved during unit active cycles |
| .pct_of_peak_sustained_elapsed | % of peak sustained rate achieved during unit elapsed cycles |
| .pct_of_peak_sustained_region | % of peak sustained rate achieved over a user-specified "range" |
| .pct_of_peak_sustained_frame | % of peak sustained rate achieved over a user-specified "frame" |
Example: ncu --query-metrics-mode suffix --metrics sm__inst_executed --chip ga100
| .pct | The value expressed as a percentage. |
| .ratio | The value expressed as a ratio. |
| .max_rate | The ratio's maximum value. |
Example: ncu --query-metrics-mode suffix --metrics smsp__average_warp_latency --chip ga100
| .pct_of_peak_sustained_active | % of peak sustained rate achieved during unit active cycles |
| .pct_of_peak_sustained_elapsed | % of peak sustained rate achieved during unit elapsed cycles |
| .pct_of_peak_sustained_region | % of peak sustained rate achieved over a user-specified "range" time |
| .pct_of_peak_sustained_frame | % of peak sustained rate achieved over a user-specified "frame" time |
Example: ncu --query-metrics-mode suffix --metrics sm__throughput --chip ga100
Throughputs have a breakdown of underlying metrics from which the throughput value is computed. You can collect breakdown:<throughput-metric> to collect a throughput's breakdown metrics.
| .peak_burst | the peak burst rate |
| .pct_of_peak_burst_active | % of peak burst rate achieved during unit active cycles |
| .pct_of_peak_burst_elapsed | % of peak burst rate achieved during unit elapsed cycles |
| .pct_of_peak_burst_region | % of peak burst rate achieved over a user-specified "range" |
| .pct_of_peak_burst_frame | % of peak burst rate achieved over a user-specified "frame" |
| .pct_of_peak_burst_active | % of peak burst rate achieved during unit active cycles |
| .pct_of_peak_burst_elapsed | % of peak burst rate achieved during unit elapsed cycles |
| .pct_of_peak_burst_region | % of peak burst rate achieved over a user-specified "range" time |
| .pct_of_peak_burst_frame | % of peak burst rate achieved over a user-specified "frame" time |
In addition to PerfWorks metrics, NVIDIA Nsight Compute uses several other measurement providers that each generate their own metrics. These are explained in the Metrics Reference.
Metrics Examples
## non-metric names -- *not* directly evaluable
sm__inst_executed                   # counter
smsp__average_warp_latency          # ratio
sm__throughput                      # throughput

## a counter's four first-level sub-metrics -- all evaluable
sm__inst_executed.sum
sm__inst_executed.avg
sm__inst_executed.min
sm__inst_executed.max

## all names below are metrics -- all evaluable
l1tex__data_bank_conflicts_pipe_lsu.sum
l1tex__data_bank_conflicts_pipe_lsu.sum.peak_sustained
l1tex__data_bank_conflicts_pipe_lsu.sum.peak_sustained_active
l1tex__data_bank_conflicts_pipe_lsu.sum.peak_sustained_active.per_second
l1tex__data_bank_conflicts_pipe_lsu.sum.peak_sustained_elapsed
l1tex__data_bank_conflicts_pipe_lsu.sum.peak_sustained_elapsed.per_second
l1tex__data_bank_conflicts_pipe_lsu.sum.peak_sustained_frame
l1tex__data_bank_conflicts_pipe_lsu.sum.peak_sustained_frame.per_second
l1tex__data_bank_conflicts_pipe_lsu.sum.peak_sustained_region
l1tex__data_bank_conflicts_pipe_lsu.sum.peak_sustained_region.per_second
l1tex__data_bank_conflicts_pipe_lsu.sum.per_cycle_active
l1tex__data_bank_conflicts_pipe_lsu.sum.per_cycle_elapsed
l1tex__data_bank_conflicts_pipe_lsu.sum.per_cycle_in_frame
l1tex__data_bank_conflicts_pipe_lsu.sum.per_cycle_in_region
l1tex__data_bank_conflicts_pipe_lsu.sum.per_second
l1tex__data_bank_conflicts_pipe_lsu.sum.pct_of_peak_sustained_active
l1tex__data_bank_conflicts_pipe_lsu.sum.pct_of_peak_sustained_elapsed
l1tex__data_bank_conflicts_pipe_lsu.sum.pct_of_peak_sustained_frame
l1tex__data_bank_conflicts_pipe_lsu.sum.pct_of_peak_sustained_region
...
Metrics Naming Conventions
- Unit-Level Counter : unit__(subunit?)_(pipestage?)_quantity_(qualifiers?)
- Interface Counter : unit__(subunit?)_(pipestage?)_(interface)_quantity_(qualifiers?)
- Unit Metric : (counter_name).(rollup_metric)
- Sub-Metric : (counter_name).(rollup_metric).(submetric)
- unit: A logical or physical unit of the GPU
- subunit: The subunit within the unit where the counter was measured. Sometimes this is a pipeline mode instead.
- pipestage: The pipeline stage within the subunit where the counter was measured.
- quantity: What is being measured. Generally matches the dimensional units.
- qualifiers: Any additional predicates or filters applied to the counter. Often, an unqualified counter can be broken down into several qualified sub-components.
- interface: Of the form sender2receiver, where sender is the source-unit and receiver is the destination-unit.
- rollup_metric: One of sum, avg, min, max.
- submetric: refer to section Metrics Entities
Cycle Metrics
- unit__cycles_elapsed : The number of cycles within a range. The cycles' DimUnits are specific to the unit's clock domain.
- unit__cycles_active : The number of cycles where the unit was processing data.
- unit__cycles_stalled : The number of cycles where the unit was unable to process new data because its output interface was blocked.
- unit__cycles_idle : The number of cycles where the unit was idle.
- unit__(interface)_active : Cycles where data was transferred from source-unit to destination-unit.
- unit__(interface)_stalled : Cycles where the source-unit had data, but the destination-unit was unable to accept data.
3.3. Metrics Decoder
The following explains terms found in NVIDIA Nsight Compute metric names, as introduced in Metrics Structure.
Units
| dram | Device (main) memory, where the GPUs global and local memory resides. |
| fbpa | The FrameBuffer Partition is a memory controller which sits between the level 2 cache (LTC) and the DRAM. The number of FBPAs varies across GPUs. |
| fe | The Frontend unit is responsible for the overall flow of workloads sent by the driver. FE also facilitates a number of synchronization operations. |
| gpc | The General Processing Cluster contains SM, Texture and L1 in the form of TPC(s). It is replicated several times across a chip. |
| gpu | The entire Graphics Processing Unit. |
| gr | Graphics Engine is responsible for all 2D and 3D graphics, compute work, and synchronous graphics copying work. |
| idc | The InDexed Constant Cache is a subunit of the SM responsible for caching constants that are indexed with a register. |
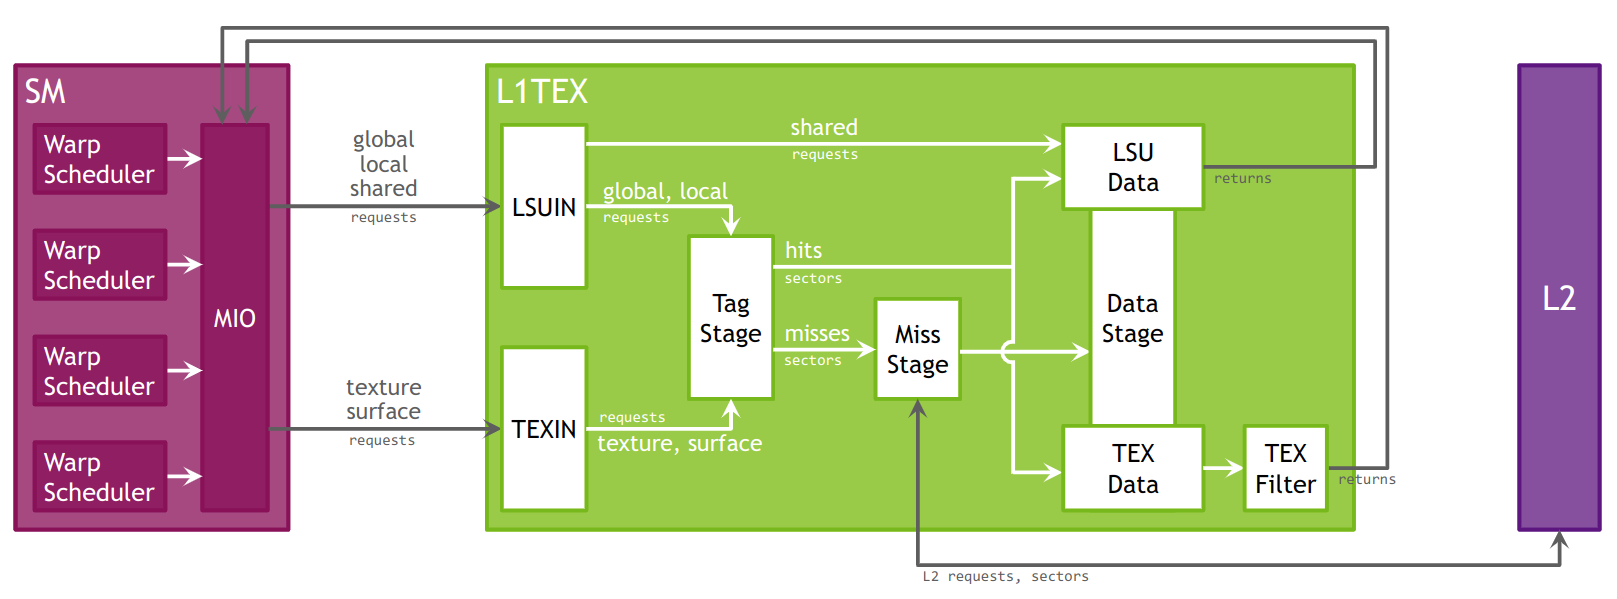
| l1tex | The Level 1 (L1)/Texture Cache is located within the GPC. It can be used as directed-mapped shared memory and/or store global, local and texture data in its cache portion. l1tex__t refers to its Tag stage. l1tex__m refers to its Miss stage. l1tex__d refers to its Data stage. |
| ltc | The Level 2 cache. |
| ltcfabric | The LTC fabric is the communication fabric for the L2 cache partitions. |
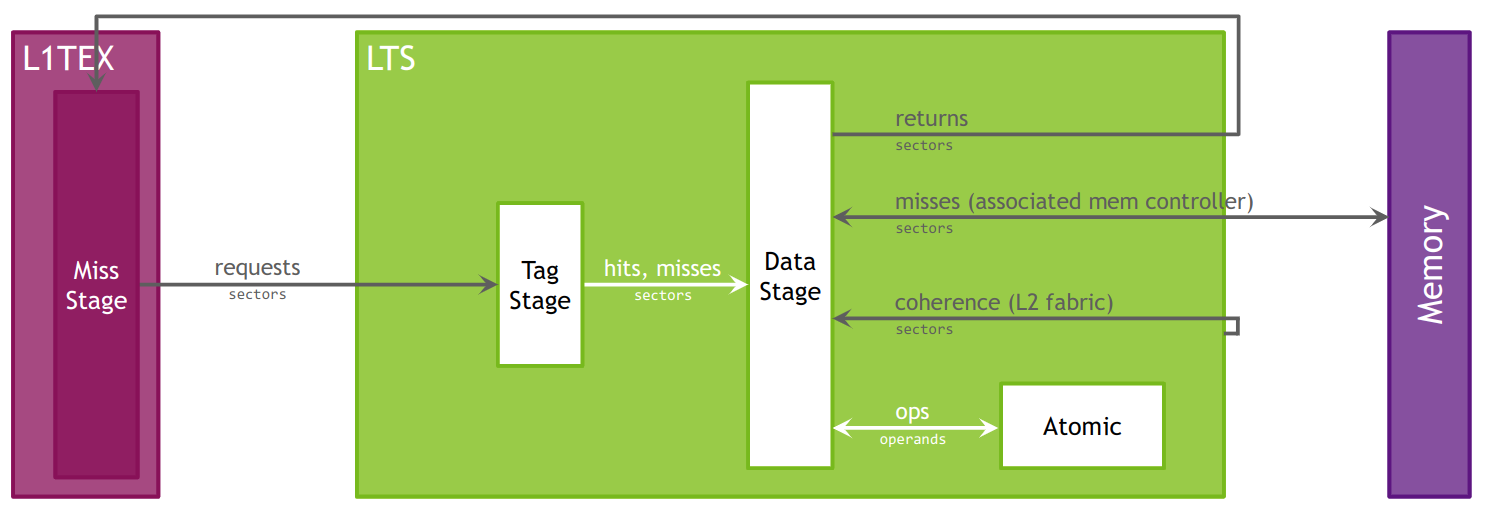
| lts | A Level 2 (L2) Cache Slice is a sub-partition of the Level 2 cache. lts__t refers to its Tag stage. lts__m refers to its Miss stage. lts__d refers to its Data stage. |
| sm | The Streaming Multiprocessor handles execution of a kernel as groups of 32 threads, called warps. Warps are further grouped into cooperative thread arrays (CTA), called blocks in CUDA. All warps of a CTA execute on the same SM. CTAs share various resources across their threads, e.g. the shared memory. |
| smsp | Each SM is partitioned into four processing blocks, called SM sub partitions. The SM sub partitions are the primary processing elements on the SM. A sub partition manages a fixed size pool of warps. |
| sys | Logical grouping of several units. |
| tpc | Thread Processing Clusters are units in the GPC. They contain one or more SM, Texture and L1 units, the Instruction Cache (ICC) and the Indexed Constant Cache (IDC). |
Subunits
| aperture_device | Memory interface to local device memory (dram) |
| aperture_peer | Memory interface to remote device memory |
| aperture_sysmem | Memory interface to system memory |
| global | Global memory is a 49-bit virtual address space that is mapped to physical memory on the device, pinned system memory, or peer memory. Global memory is visible to all threads in the GPU. Global memory is accessed through the SM L1 and GPU L2. |
| lg | Local/Global memory |
| local | Local memory is private storage for an executing thread and is not visible outside of that thread. It is intended for thread-local data like thread stacks and register spills. Local memory has the same latency as global memory. |
| lsu | Load/Store unit |
| lsuin | Load/Store input |
| mio | Memory input/output |
| mioc | Memory input/output control |
| shared | Shared memory is located on chip, so it has much higher bandwidth and much lower latency than either local or global memory. Shared memory can be shared across a compute CTA. |
| surface | Surface memory |
| texin | TEXIN |
| texture | Texture memory |
| xbar | The Crossbar (XBAR) is responsible for carrying packets from a given source unit to a specific destination unit. |
Pipelines
| adu | Address Divergence Unit. The ADU is responsible for address divergence handling for branches/jumps. It also provides support for constant loads and block-level barrier instructions. |
| alu | Arithmetic Logic Unit. The ALU is responsible for execution of most bit manipulation and logic instructions. It also executes integer instructions, excluding IMAD and IMUL. On NVIDIA Ampere architecture chips, the ALU pipeline performs fast FP32-to-FP16 conversion. |
| cbu | Convergence Barrier Unit. The CBU is responsible for warp-level convergence, barrier, and branch instructions. |
| fma | Fused Multiply Add/Accumulate. The FMA pipeline processes most FP32 arithmetic (FADD, FMUL, FMAD). It also performs integer multiplication operations (IMUL, IMAD), as well as integer dot products. On GA10x, FMA is a logical pipeline that indicates peak FP32 and FP16x2 performance. It is composed of the FMAHeavy and FMALite physical pipelines. |
| fmaheavy | Fused Multiply Add/Accumulate Heavy. FMAHeavy performs FP32 arithmetic (FADD, FMUL, FMAD), FP16 arithmetic (HADD2, HMUL2, HFMA2), and integer dot products. |
| fmalite | Fused Multiply Add/Accumulate Lite. FMALite performs FP32 arithmetic (FADD, FMUL, FMA) and FP16 arithmetic (HADD2, HMUL2, HFMA2). |
| fp16 | Half-precision floating-point. On Volta, Turing and NVIDIA GA100, the FP16 pipeline performs paired FP16 instructions (FP16x2). It also contains a fast FP32-to-FP16 and FP16-to-FP32 converter. Starting with GA10x chips, this functionality is part of the FMA pipeline. |
| fp64 | Double-precision floating-point. The implementation of FP64 varies greatly per chip. |
| lsu | Load Store Unit. The LSU pipeline issues load, store, atomic, and reduction instructions to the L1TEX unit for global, local, and shared memory. It also issues special register reads (S2R), shuffles, and CTA-level arrive/wait barrier instructions to the L1TEX unit. |
| tex | Texture Unit. The SM texture pipeline forwards texture and surface instructions to the L1TEX unit's TEXIN stage. On GPUs where FP64 or Tensor pipelines are decoupled, the texture pipeline forwards those types of instructions, too. |
| tma | Tensor Memory Access Unit. Provides efficient data transfer mechanisms between global and shared memories with the ability to understand and traverse multidimensional data layouts. |
| uniform | Uniform Data Path. This scalar unit executes instructions where all threads use the same input and generate the same output. |
| xu | Transcendental and Data Type Conversion Unit. The XU pipeline is responsible for special functions such as sin, cos, and reciprocal square root. It is also responsible for int-to-float, and float-to-int type conversions. |
Quantities
| instruction | An assembly (SASS) instruction. Each executed instruction may generate zero or more requests. |
| request | A command into a HW unit to perform some action, e.g. load data from some memory location. Each request accesses one or more sectors. |
| sector | Aligned 32 byte-chunk of memory in a cache line or device memory. An L1 or L2 cache line is four sectors, i.e. 128 bytes. Sector accesses are classified as hits if the tag is present and the sector-data is present within the cache line. Tag-misses and tag-hit-data-misses are all classified as misses. |
| tag | Unique key to a cache line. A request may look up multiple tags, if the thread addresses do not all fall within a single cache line-aligned region. The L1 and L2 both have 128 byte cache lines. Tag accesses may be classified as hits or misses. |
| wavefront | Unique "work package" generated at the end of the processing stage for requests. All work items of a wavefront are processed in parallel, while work items of different wavefronts are serialized and processed on different cycles. At least one wavefront is generated for each request. |
A simplified model for the processing in L1TEX for Volta and newer architectures can be described as follows: When an SM executes a global or local memory instruction for a warp, a single request is sent to L1TEX. This request communicates the information for all participating threads of this warp (up to 32). For local and global memory, based on the access pattern and the participating threads, the request requires to access a number of cache lines, and sectors within these cache lines. The L1TEX unit has internally multiple processing stages operating in a pipeline.
A wavefront is the maximum unit that can pass through that pipeline stage per cycle. If not all cache lines or sectors can be accessed in a single wavefront, multiple wavefronts are created and sent for processing one by one, i.e. in a serialized manner. Limitations of the work within a wavefront may include the need for a consistent memory space, a maximum number of cache lines that can be accessed, as well as various other reasons. Each wavefront then flows through the L1TEX pipeline and fetches the sectors handled in that wavefront. The given relationships of the three key values in this model are requests:sectors is 1:N, wavefronts:sectors 1:N, and requests:wavefronts is 1:N.
A wavefront is described as a (work) package that can be processed at once, i.e. there is a notion of processing one wavefront per cycle in L1TEX. Wavefronts therefore represent the number of cycles required to process the requests, while the number of sectors per request is a property of the access pattern of the memory instruction for all participating threads. For example, it is possible to have a memory instruction that requires 4 sectors per request in 1 wavefront. However, you can also have a memory instruction having 4 sectors per request, but requiring 2 or more wavefronts.
3.4. Range and Precision
Overview
In general, measurement values that lie outside the expected logical range of a metric can be attributed to one or more of the below root-causes. If values are exceeding such range, they are not clamped by the tool to their expected value on purpose to ensure that the rest of the profiler report remains self-consistent.
Asynchronous GPU activity
GPU engines other than the one measured by a metric (display, copy engine, video encoder, video decoder, etc.) potentially access shared resources during profiling. Such chip-global shared resources include L2, DRAM, PCIe, and NVLINK. If the kernel launch is small, the other engine(s) can cause significant confusion in e.g. the DRAM results, since it is not possible to isolate the DRAM traffic of the SM. To reduce the impact of such asynchronous units, consider profiling on a GPU without active display and without other processes that can access the GPU at the time.
Multi-pass data collection
Out-of-range metrics often occur when the profiler replays the kernel launch to collect metrics, and work distribution is significantly different across replay passes. A metric such as hit rate (hits / queries) can have significant error if hits and queries are collected on different passes and the kernel does not saturate the GPU to reach a steady state (generally > 20 µs). Similarly, it can show unexpected values when the workload is inherently variable, as e.g. in the case of spin loops.
To mitigate the issue, when applicable try to increase the measured workload to allow the GPU to reach a steady state for each launch. Reducing the number of metrics collected at the same time can also improve precision by increasing the likelihood that counters contributing to one metric are collected in a single pass.
Tool issue
If you still observe metric issues after following the guidelines above, please reach out to us and describe your issue.
4. Metrics Reference
Overview
Most metrics in NVIDIA Nsight Compute can be queried using the ncu command line interface's --query-metrics option.
The following metrics can be collected explicitly, but are not listed by --query-metrics, and do not follow the naming scheme explained in Metrics Structure. They should be used as-is instead.
launch__* metrics are collected per kernel launch, and do not require an additional replay pass. They are available as part of the kernel launch parameters (such as grid size, block size, ...) or are computed using the CUDA Occupancy Calculator.
Launch Metrics
| launch__block_dim_x | Number of threads for the kernel launch in X dimension. |
| launch__block_dim_y | Number of threads for the kernel launch in Y dimension. |
| launch__block_dim_z | Number of threads for the kernel launch in Z dimension. |
| launch__block_size | Total number of threads per block for the kernel launch. |
| launch__cluster_dim_x | Number of clusters for the kernel launch in X dimension. |
| launch__cluster_dim_y | Number of clusters for the kernel launch in Y dimension. |
| launch__cluster_dim_z | Number of clusters for the kernel launch in Z dimension. |
| launch__cluster_max_active | Maximum number of clusters that can co-exist on the target device. The runtime environment may affect how the hardware schedules the clusters, so the calculated occupancy is not guaranteed to be achievable. |
| launch__cluster_max_potential_size | Largest valid cluster size for the kernel function and launch configuration. |
| launch__cluster_scheduling_policy | Cluster scheduling policy. |
| launch__context_id | CUDA context id for the kernel launch. |
| launch__device_id | CUDA device id for the kernel launch. |
| launch__func_cache_config | On devices where the L1 cache and shared memory use the same hardware resources, this is the preferred cache configuration for the CUDA function. The runtime will use the requested configuration if possible, but it is free to choose a different configuration if required. |
| launch__function_pcs | Kernel function entry PCs. |
| launch__graph_contains_device_launch | Set to 1 if any node in the profiled graph can launch a CUDA device graph. |
| launch__graph_is_device_launchable | Set to 1 if the profiled graph was device-launchable. |
| launch__grid_dim_x | Number of blocks for the kernel launch in X dimension. |
| launch__grid_dim_y | Number of blocks for the kernel launch in Y dimension. |
| launch__grid_dim_z | Number of blocks for the kernel launch in Z dimension. |
| launch__grid_size | Total number of blocks for the kernel launch. |
| launch__occupancy_cluster_gpu_pct | Overall GPU occupancy due to clusters. |
| launch__occupancy_cluster_pct | The ratio of active blocks to the max possible active blocks due to clusters. |
| launch__occupancy_per_cluster_size | Number of active clusters for given cluster size. |
| launch__registers_per_thread | Number of registers allocated per thread. |
| launch__shared_mem_config_size | Shared memory size configured for the kernel launch. The size depends on the static, dynamic, and driver shared memory requirements as well as the specified or platform-determined configuration size. |
| launch__shared_mem_per_block_driver | Shared memory size per block, allocated for the CUDA driver. |
| launch__shared_mem_per_block_dynamic | Dynamic shared memory size per block, allocated for the kernel. |
| launch__shared_mem_per_block_static | Static shared memory size per block, allocated for the kernel. |
| launch__stream_id | CUDA stream id for the kernel launch. |
| launch__thread_count | Total number of threads across all blocks for the kernel launch. |
| launch__uses_cdp | Set to 1 if any function object in the launched workload can use CUDA dynamic parallelism. |
| launch__waves_per_multiprocessor | Number of waves per SM. Partial waves can lead to tail effects where some SMs become idle while others still have pending work to complete. |
NVLink Topology Metrics
| nvlink__bandwidth | Link bandwidth in bytes/s. |
| nvlink__count_logical | Total number of logical NVLinks. |
| nvlink__count_physical | Total number of physical links. |
| nvlink__destination_ports | Destination port numbers (as strings). |
| nvlink__dev0Id | ID of the first connected device. |
| nvlink__dev0type | Type of the first connected device. |
| nvlink__dev1Id | ID of the second connected device. |
| nvlink__dev1type | Type of the second connected device. |
| nvlink__dev_display_name_all | Device display name. |
| nvlink__enabled_mask | NVLink enablement mask, per device. |
| nvlink__is_direct_link | Indicates, per NVLink, if the link is direct. |
| nvlink__is_nvswitch_connected | Indicates if NVSwitch is connected. |
| nvlink__max_count | Maximum number of NVLinks. |
| nvlink__peer_access | Indicates if peer access is supported. |
| nvlink__peer_atomic | Indicates if peer atomics are supported. |
| nvlink__source_ports | Source port numbers (as strings). |
| nvlink__system_access | Indicates if system access is supported. |
| nvlink__system_atomic | Indicates if system atomics are supported. |
Device Attributes
device__attribute_* metrics represent CUDA device attributes. Collecting them does not require an addition kernel replay pass, as their value is available from the CUDA driver for each CUDA device.
Warp Stall Reasons
| smsp__pcsamp_warps_issue_stalled_barrier | Warp was stalled waiting for sibling warps at a CTA barrier. A high number of warps waiting at a barrier is commonly caused by diverging code paths before a barrier. This causes some warps to wait a long time until other warps reach the synchronization point. Whenever possible, try to divide up the work into blocks of uniform workloads. Also, try to identify which barrier instruction causes the most stalls, and optimize the code executed before that synchronization point first. |
| smsp__pcsamp_warps_issue_stalled_branch_resolving | Warp was stalled waiting for a branch target to be computed, and the warp program counter to be updated. Excessively jumping (branching) can lead to more warps stalled for this reason. See also the related No Instructions state. |
| smsp__pcsamp_warps_issue_stalled_dispatch_stall | Warp was stalled waiting on a dispatch stall. A warp stalled during dispatch has an instruction ready to issue, but the dispatcher holds back issuing the warp due to other conflicts or events. |
| smsp__pcsamp_warps_issue_stalled_drain | Warp was stalled after EXIT waiting for all memory instructions to complete so that warp resources can be freed. A high number of stalls due to draining warps typically occurs when a lot of data is written to memory towards the end of a kernel. Make sure the memory access patterns of these store operations are optimal for the target architecture and consider parallelized data reduction, if applicable. |
| smsp__pcsamp_warps_issue_stalled_imc_miss | Warp was stalled waiting for an immediate constant cache (IMC) miss. A read from constant memory costs one memory read from device memory only on a cache miss; otherwise, it just costs one read from the constant cache. Accesses to different addresses by threads within a warp are serialized, thus the cost scales linearly with the number of unique addresses read by all threads within a warp. As such, the constant cache is best when threads in the same warp access only a few distinct locations. If all threads of a warp access the same location, then constant memory can be as fast as a register access. |
| smsp__pcsamp_warps_issue_stalled_lg_throttle | Warp was stalled waiting for the L1 instruction queue for local and global (LG) memory operations to be not full. Typically, this stall occurs only when executing local or global memory instructions extremely frequently. If applicable, consider combining multiple lower-width memory operations into fewer wider memory operations and try interleaving memory operations and math instructions. |
| smsp__pcsamp_warps_issue_stalled_long_scoreboard | Warp was stalled waiting for a scoreboard dependency on a L1TEX (local, global, surface, tex) operation. To reduce the number of cycles waiting on L1TEX data accesses verify the memory access patterns are optimal for the target architecture, attempt to increase cache hit rates by increasing data locality, or by changing the cache configuration, and consider moving frequently used data to shared memory. |
| smsp__pcsamp_warps_issue_stalled_math_pipe_throttle | Warp was stalled waiting for the execution pipe to be available. This stall occurs when all active warps execute their next instruction on a specific, oversubscribed math pipeline. Try to increase the number of active warps to hide the existent latency or try changing the instruction mix to utilize all available pipelines in a more balanced way. |
| smsp__pcsamp_warps_issue_stalled_membar | Warp was stalled waiting on a memory barrier. Avoid executing any unnecessary memory barriers and assure that any outstanding memory operations are fully optimized for the target architecture. |
| smsp__pcsamp_warps_issue_stalled_mio_throttle | Warp was stalled waiting for the MIO (memory input/output) instruction queue to be not full. This stall reason is high in cases of extreme utilization of the MIO pipelines, which include special math instructions, dynamic branches, as well as shared memory instructions. |
| smsp__pcsamp_warps_issue_stalled_misc | Warp was stalled for a miscellaneous hardware reason. |
| smsp__pcsamp_warps_issue_stalled_no_instructions | Warp was stalled waiting to be selected to fetch an instruction or waiting on an instruction cache miss. A high number of warps not having an instruction fetched is typical for very short kernels with less than one full wave of work in the grid. Excessively jumping across large blocks of assembly code can also lead to more warps stalled for this reason, if this causes misses in the instruction cache. See also the related Branch Resolving state. |
| smsp__pcsamp_warps_issue_stalled_not_selected | Warp was stalled waiting for the micro scheduler to select the warp to issue. Not selected warps are eligible warps that were not picked by the scheduler to issue that cycle as another warp was selected. A high number of not selected warps typically means you have sufficient warps to cover warp latencies and you may consider reducing the number of active warps to possibly increase cache coherence and data locality. |
| smsp__pcsamp_warps_issue_stalled_selected | Warp was selected by the micro scheduler and issued an instruction. |
| smsp__pcsamp_warps_issue_stalled_short_scoreboard | Warp was stalled waiting for a scoreboard dependency on a MIO (memory input/output) operation (not to L1TEX). The primary reason for a high number of stalls due to short scoreboards is typically memory operations to shared memory. Other reasons include frequent execution of special math instructions (e.g. MUFU) or dynamic branching (e.g. BRX, JMX). Verify if there are shared memory operations and reduce bank conflicts, if applicable. |
| smsp__pcsamp_warps_issue_stalled_sleeping | Warp was stalled due to all threads in the warp being in the blocked, yielded, or sleep state. Reduce the number of executed NANOSLEEP instructions, lower the specified time delay, and attempt to group threads in a way that multiple threads in a warp sleep at the same time. |
| smsp__pcsamp_warps_issue_stalled_tex_throttle | Warp was stalled waiting for the L1 instruction queue for texture operations to be not full. This stall reason is high in cases of extreme utilization of the L1TEX pipeline. If applicable, consider combining multiple lower-width memory operations into fewer wider memory operations and try interleaving memory operations and math instructions. |
| smsp__pcsamp_warps_issue_stalled_wait | Warp was stalled waiting on a fixed latency execution dependency. Typically, this stall reason should be very low and only shows up as a top contributor in already highly optimized kernels. If possible, try to further increase the number of active warps to hide the corresponding instruction latencies. |
Warp Stall Reasons (Not Issued)
| smsp__pcsamp_warps_issue_stalled_barrier_not_issued | Warp was stalled waiting for sibling warps at a CTA barrier. A high number of warps waiting at a barrier is commonly caused by diverging code paths before a barrier. This causes some warps to wait a long time until other warps reach the synchronization point. Whenever possible, try to divide up the work into blocks of uniform workloads. Also, try to identify which barrier instruction causes the most stalls, and optimize the code executed before that synchronization point first. |
| smsp__pcsamp_warps_issue_stalled_branch_resolving_not_issued | Warp was stalled waiting for a branch target to be computed, and the warp program counter to be updated. Excessively jumping (branching) can lead to more warps stalled for this reason. See also the related No Instructions state. |
| smsp__pcsamp_warps_issue_stalled_dispatch_stall_not_issued | Warp was stalled waiting on a dispatch stall. A warp stalled during dispatch has an instruction ready to issue, but the dispatcher holds back issuing the warp due to other conflicts or events. |
| smsp__pcsamp_warps_issue_stalled_drain_not_issued | Warp was stalled after EXIT waiting for all memory instructions to complete so that warp resources can be freed. A high number of stalls due to draining warps typically occurs when a lot of data is written to memory towards the end of a kernel. Make sure the memory access patterns of these store operations are optimal for the target architecture and consider parallelized data reduction, if applicable. |
| smsp__pcsamp_warps_issue_stalled_imc_miss_not_issued | Warp was stalled waiting for an immediate constant cache (IMC) miss. A read from constant memory costs one memory read from device memory only on a cache miss; otherwise, it just costs one read from the constant cache. Accesses to different addresses by threads within a warp are serialized, thus the cost scales linearly with the number of unique addresses read by all threads within a warp. As such, the constant cache is best when threads in the same warp access only a few distinct locations. If all threads of a warp access the same location, then constant memory can be as fast as a register access. |
| smsp__pcsamp_warps_issue_stalled_lg_throttle_not_issued | Warp was stalled waiting for the L1 instruction queue for local and global (LG) memory operations to be not full. Typically, this stall occurs only when executing local or global memory instructions extremely frequently. If applicable, consider combining multiple lower-width memory operations into fewer wider memory operations and try interleaving memory operations and math instructions. |
| smsp__pcsamp_warps_issue_stalled_long_scoreboard_not_issued | Warp was stalled waiting for a scoreboard dependency on a L1TEX (local, global, surface, tex) operation. To reduce the number of cycles waiting on L1TEX data accesses verify the memory access patterns are optimal for the target architecture, attempt to increase cache hit rates by increasing data locality, or by changing the cache configuration, and consider moving frequently used data to shared memory. |
| smsp__pcsamp_warps_issue_stalled_math_pipe_throttle_not_issued | Warp was stalled waiting for the execution pipe to be available. This stall occurs when all active warps execute their next instruction on a specific, oversubscribed math pipeline. Try to increase the number of active warps to hide the existent latency or try changing the instruction mix to utilize all available pipelines in a more balanced way. |
| smsp__pcsamp_warps_issue_stalled_membar_not_issued | Warp was stalled waiting on a memory barrier. Avoid executing any unnecessary memory barriers and assure that any outstanding memory operations are fully optimized for the target architecture. |
| smsp__pcsamp_warps_issue_stalled_mio_throttle_not_issued | Warp was stalled waiting for the MIO (memory input/output) instruction queue to be not full. This stall reason is high in cases of extreme utilization of the MIO pipelines, which include special math instructions, dynamic branches, as well as shared memory instructions. |
| smsp__pcsamp_warps_issue_stalled_misc_not_issued | Warp was stalled for a miscellaneous hardware reason. |
| smsp__pcsamp_warps_issue_stalled_no_instructions_not_issued | Warp was stalled waiting to be selected to fetch an instruction or waiting on an instruction cache miss. A high number of warps not having an instruction fetched is typical for very short kernels with less than one full wave of work in the grid. Excessively jumping across large blocks of assembly code can also lead to more warps stalled for this reason, if this causes misses in the instruction cache. See also the related Branch Resolving state. |
| smsp__pcsamp_warps_issue_stalled_not_selected_not_issued | Warp was stalled waiting for the micro scheduler to select the warp to issue. Not selected warps are eligible warps that were not picked by the scheduler to issue that cycle as another warp was selected. A high number of not selected warps typically means you have sufficient warps to cover warp latencies and you may consider reducing the number of active warps to possibly increase cache coherence and data locality. |
| smsp__pcsamp_warps_issue_stalled_selected_not_issued | Warp was selected by the micro scheduler and issued an instruction. |
| smsp__pcsamp_warps_issue_stalled_short_scoreboard_not_issued | Warp was stalled waiting for a scoreboard dependency on a MIO (memory input/output) operation (not to L1TEX). The primary reason for a high number of stalls due to short scoreboards is typically memory operations to shared memory. Other reasons include frequent execution of special math instructions (e.g. MUFU) or dynamic branching (e.g. BRX, JMX). Verify if there are shared memory operations and reduce bank conflicts, if applicable. |
| smsp__pcsamp_warps_issue_stalled_sleeping_not_issued | Warp was stalled due to all threads in the warp being in the blocked, yielded, or sleep state. Reduce the number of executed NANOSLEEP instructions, lower the specified time delay, and attempt to group threads in a way that multiple threads in a warp sleep at the same time. |
| smsp__pcsamp_warps_issue_stalled_tex_throttle_not_issued | Warp was stalled waiting for the L1 instruction queue for texture operations to be not full. This stall reason is high in cases of extreme utilization of the L1TEX pipeline. If applicable, consider combining multiple lower-width memory operations into fewer wider memory operations and try interleaving memory operations and math instructions. |
| smsp__pcsamp_warps_issue_stalled_wait_not_issued | Warp was stalled waiting on a fixed latency execution dependency. Typically, this stall reason should be very low and only shows up as a top contributor in already highly optimized kernels. If possible, try to further increase the number of active warps to hide the corresponding instruction latencies. |
Source Metrics
| branch_inst_executed | Number of unique branch targets assigned to the instruction, including both divergent and uniform branches. |
| derived__avg_thread_executed | Average number of thread-level executed instructions per warp (regardless of their predicate). Computed as: thread_inst_executed / inst_executed |
| derived__avg_thread_executed_true | Average number of predicated-on thread-level executed instructions per warp. Computed as: thread_inst_executed_true / inst_executed |
| derived__memory_l1_wavefronts_shared_excessive | Excessive number of wavefronts in L1 from shared memory instructions, because not all not predicated-off threads performed the operation. |
| derived__memory_l2_theoretical_sectors_global_excessive | Excessive theoretical number of sectors requested in L2 from global memory instructions, because not all not predicated-off threads performed the operation. |
| inst_executed | Number of warp-level executed instructions, ignoring instruction predicates. Warp-level means the values increased by one per individual warp executing the instruction, independent of the number of participating threads within each warp. |
| memory_access_size_type | The size of the memory access, in bits. |
| memory_access_type | The type of memory access (e.g. load or store). |
| memory_l1_tag_requests_global | Number of L1 tag requests generated by global memory instructions. |
| memory_l1_wavefronts_shared | Number of wavefronts in L1 from shared memory instructions. |
| memory_l1_wavefronts_shared_ideal | Ideal number of wavefronts in L1 from shared memory instructions, assuming each not predicated-off thread performed the operation. |
| memory_l2_theoretical_sectors_global | Theoretical number of sectors requested in L2 from global memory instructions. |
| memory_l2_theoretical_sectors_global_ideal | Ideal number of sectors requested in L2 from global memory instructions, assuming each not predicated-off thread performed the operation. |
| memory_l2_theoretical_sectors_local | Theoretical number of sectors requested in L2 from local memory instructions. |
| memory_type | The accessed address space (global/local/shared). |
| smsp__branch_targets_threads_divergent | Number of divergent branch targets, including fallthrough. Incremented only when there are two or more active threads with divergent targets. |
| smsp__branch_targets_threads_uniform | Number of uniform branch execution, including fallthrough, where all active threads selected the same branch target. |
| smsp__pcsamp_sample_count | Number of collected samples per program counter from the periodic sampler. |
| thread_inst_executed | Number of thread-level executed instructions, regardless of predicate presence or evaluation. |
| thread_inst_executed_true | Number of thread-level executed instructions, where the instruction predicate evaluated to true, or no predicate was given. |
L2 Cache Eviction Metrics
| smsp__sass_inst_executed_memdesc_explicit_evict_type | L2 cache eviction policy types. |
| smsp__sass_inst_executed_memdesc_explicit_hitprop_evict_first | Number of warp-level executed instructions with L2 cache eviction hit property 'first'. |
| smsp__sass_inst_executed_memdesc_explicit_hitprop_evict_last | Number of warp-level executed instructions with L2 cache eviction hit property 'last'. |
| smsp__sass_inst_executed_memdesc_explicit_hitprop_evict_normal | Number of warp-level executed instructions with L2 cache eviction hit property 'normal'. |
| smsp__sass_inst_executed_memdesc_explicit_hitprop_evict_normal_demote | Number of warp-level executed instructions with L2 cache eviction hit property 'normal demote'. |
| smsp__sass_inst_executed_memdesc_explicit_missprop_evict_first | Number of warp-level executed instructions with L2 cache eviction miss property 'first'. |
| smsp__sass_inst_executed_memdesc_explicit_missprop_evict_normal | Number of warp-level executed instructions with L2 cache eviction miss property 'normal'. |
Instructions Per Opcode Metrics
| sass__inst_executed_per_opcode | Number of warp-level executed instructions, instanced by basic SASS opcode. |
| sass__inst_executed_per_opcode_with_modifier_all | Number of warp-level executed instructions, instanced by all SASS opcode modifiers. |
| sass__inst_executed_per_opcode_with_modifier_selective | Number of warp-level executed instructions, instanced by selective SASS opcode modifiers. |
| sass__thread_inst_executed_true_per_opcode | Number of thread-level executed instructions, instanced by basic SASS opcode. |
| sass__thread_inst_executed_true_per_opcode_with_modifier_all | Number of thread-level executed instructions, instanced by all SASS opcode modifiers. |
| sass__thread_inst_executed_true_per_opcode_with_modifier_selective | Number of thread-level executed instructions, instanced by selective SASS opcode modifiers. |
Metric Groups
| group:memory__chart | Group of metrics for the workload analysis chart. |
| group:memory__dram_table | Group of metrics for the device memory workload analysis table. |
| group:memory__first_level_cache_table | Group of metrics for the L1/TEX cache workload analysis table. |
| group:memory__l2_cache_evict_policy_table | Group of metrics for the L2 cache eviction policies table. |
| group:memory__l2_cache_table | Group of metrics for the L2 cache workload analysis table. |
| group:memory__shared_table | Group of metrics for the shared memory workload analysis table. |
| group:smsp__pcsamp_warp_stall_reasons | Group of metrics for the number of samples from the statistical sampler per program location. |
| group:smsp__pcsamp_warp_stall_reasons_not_issued | Group of metrics for the number of samples from the statistical sampler per program location on cycles the warp scheduler issued no instructions. |
5. Sampling
NVIDIA Nsight Compute supports periodic sampling of the warp program counter and warp scheduler state on desktop devices of compute capability 6.1 and above.
At a fixed interval of cycles, the sampler in each streaming multiprocessor selects an active warp and outputs the program counter and the warp scheduler state. The tool selects the minimum interval for the device. On small devices, this can be every 32 cycles. On larger chips with more multiprocessors, this may be 2048 cycles. The sampler selects a random active warp. On the same cycle the scheduler may select a different warp to issue.
5.1. Warp Scheduler States
See the Metrics Reference for a description of the individual warp scheduler states.
Metrics of the form smsp__pcsamp_warps_issue_stalled_(state) are incremented during sampling regardless if the scheduler issued an instruction in the same cycle or not. Metrics of the form smsp__pcsamp_warps_issue_stalled_(state)_not_issued are incremented during sampling only on cycles in which the warp scheduler issued no instruction.
6. Reproducibility
In order to provide actionable and deterministic results across application runs, NVIDIA Nsight Compute applies various methods to adjust how metrics are collected. This includes serializing kernel launches, purging GPU caches before each kernel replay or adjusting GPU clocks.
6.1. Serialization
NVIDIA Nsight Compute serializes kernel launches within the profiled application, potentially across multiple processes profiled by one or more instances of the tool at the same time.
Serialization across processes is necessary since for the collection of HW performance metrics, some GPU and driver objects can only be acquired by a single process at a time. To achieve this, the lock file TMPDIR/nsight-compute-lock is used. On Windows, TMPDIR is the path returned by the Windows GetTempPath API function. On other platforms, it is the path supplied by the first environment variable in the list TMPDIR, TMP, TEMP, TEMPDIR. If none of these is found, it's /var/nvidia on QNX and /tmp otherwise.
Serialization within the process is required for most metrics to be mapped to the proper kernel. In addition, without serialization, performance metric values might vary widely if kernel execute concurrently on the same device.
It is currently not possible to disable this tool behavior. Refer to the FAQ entry on possible workarounds.
6.2. Clock Control
For many metrics, their value is directly influenced by the current GPU SM and memory clock frequencies. For example, if a kernel instance is profiled that has prior kernel executions in the application, the GPU might already be in a higher clocked state and the measured kernel duration, along with other metrics, will be affected. Likewise, if a kernel instance is the first kernel to be launched in the application, GPU clocks will regularly be lower. In addition, due to kernel replay, the metric value might depend on which replay pass it is collected in, as later passes would result in higher clock states.
To mitigate this non-determinism, NVIDIA Nsight Compute attempts to limit GPU clock frequencies to their base value. As a result, metric values are less impacted by the location of the kernel in the application, or by the number of the specific replay pass.
However, this behavior might be undesirable for analysis of the kernel, e.g. in cases where an external tool is used to fix clock frequencies, or where the behavior of the kernel within the application is analyzed. To solve this, users can adjust the --clock-control option to specify if any clock frequencies should be fixed by the tool.
- Note that thermal throttling directed by the driver cannot be controlled by the tool and always overrides any selected options.
- On mobile targets, e.g. L4T or QNX, there may be variations in profiling results due the inability for the tool to lock clocks.
Using Nsight Compute’s --clock-control to set the GPU clocks will fail or will be silently ignored when profiling on a GPU partition.
- On L4T, you can use the jetson_clocks script to lock the clocks at their maximums during profiling.
- See the Special Configurations section for MIG and vGPU clock control.
6.3. Cache Control
As explained in Kernel Replay, the kernel might need to be replayed multiple times to collect all requested metrics. While NVIDIA Nsight Compute can save and restore the contents of GPU device memory accessed by the kernel for each pass, it cannot do the same for the contents of HW caches, such as e.g. the L1 and L2 cache.
This can have the effect that later replay passes might have better or worse performance than e.g. the first pass, as the caches could already be primed with the data last accessed by the kernel. Similarly, the values of HW performance counters collected by the first pass might depend on which kernels, if any, were executed prior to the measured kernel launch.
In order to make HW performance counter value more deterministic, NVIDIA Nsight Compute by default flushes all GPU caches before each replay pass. As a result, in each pass, the kernel will access a clean cache and the behavior will be as if the kernel was executed in complete isolation.
This behavior might be undesirable for performance analysis, especially if the measurement focuses on a kernel within a larger application execution, and if the collected data targets cache-centric metrics. In this case, you can use --cache-control none to disable flushing of any HW cache by the tool.
6.4. Persistence Mode
The NVIDIA kernel mode driver must be running and connected to a target GPU device before any user interactions with that device can take place. The driver behavior differs depending on the OS. Generally, on Linux, if the kernel mode driver is not already running or connected to a target GPU, the invocation of any program that attempts to interact with that GPU will transparently cause the driver to load and/or initialize the GPU. When all GPU clients terminate the driver will then deinitialize the GPU.
If persistence mode is not enabled (as part of the OS, or by the user), applications triggering GPU initialization may incur a short startup cost. In addition, on some configurations, there may also be a shutdown cost when the GPU is de-initialized at the end of the application.
It is recommended to enable persistence mode on applicable operating systems before profiling with NVIDIA Nsight Compute for more consistent application behavior.
7. Special Configurations
7.1. Multi Instance GPU
Multi-Instance GPU (MIG) is a feature that allows a GPU to be partitioned into multiple CUDA devices. The partitioning is carried out on two levels: First, a GPU can be split into one or multiple GPU Instances. Each GPU Instance claims ownership of one or more streaming multiprocessors (SM), a subset of the overall GPU memory, and possibly other GPU resources, such as the video encoders/decoders. Second, each GPU Instance can be further partitioned into one or more Compute Instances. Each Compute Instance has exclusive ownership of its assigned SMs of the GPU Instance. However, all Compute Instances within a GPU Instance share the GPU Instance's memory and memory bandwidth. Every Compute Instance acts and operates as a CUDA device with a unique device ID. See the driver release notes as well as the documentation for the nvidia-smi CLI tool for more information on how to configure MIG instances.
For profiling, a Compute Instance can be of one of two types: isolated or shared.
An isolated Compute Instance owns all of its assigned resources and does not share any GPU unit with another Compute Instance. In other words, the Compute Instance is the same size as its parent GPU Instance and consequently does not have any other sibling Compute Instances. Profiling works as usual for isolated Compute Instances.
A shared Compute Instance uses GPU resources that can potentially also be accessed by other Compute Instances in the same GPU Instance. Due to this resource sharing, collecting profiling data from those shared units is not permitted. Attempts to collect metrics from a shared unit fail with an error message of ==ERROR== Failed to access the following metrics. When profiling on a MIG instance, it is not possible to collect metrics from GPU units that are shared with other MIG instances followed by the list of failing metrics. Collecting only metrics from GPU units that are exclusively owned by a shared Compute Instance is still possible.
Locking Clocks
NVIDIA Nsight Compute is not able to set the clock frequency on any Compute Instance for profiling. You can continue analyzing kernels without fixed clock frequencies (using --clock-control none; see here for more details). If you have sufficient permissions, nvidia-smi can be used to configure a fixed frequency for the whole GPU by calling nvidia-smi --lock-gpu-clocks=tdp,tdp. This sets the GPU clocks to the base TDP frequency until you reset the clocks by calling nvidia-smi --reset-gpu-clocks.
MIG on NVIDIA vGPU
Enabling profiling for a VM gives the VM access to the GPU's global performance counters, which may include activity from other VMs executing on the same GPU. Enabling profiling for a VM also allows the VM to lock clocks on the GPU, which impacts all other VMs executing on the same GPU, including MIG Compute Instances.
8. Roofline Charts
Roofline charts provide a very helpful way to visualize achieved performance on complex processing units, like GPUs. This section introduces the Roofline charts that are presented within a profile report.
8.1. Overview
Kernel performance is not only dependent on the operational speed of the GPU. Since a kernel requires data to work on, performance is also dependent on the rate at which the GPU can feed data to the kernel. A typical roofline chart combines the peak performance and memory bandwidth of the GPU, with a metric called Arithmetic Intensity (a ratio between Work and Memory Traffic), into a single chart, to more realistically represent the achieved performance of the profiled kernel. A simple roofline chart might look like the following:
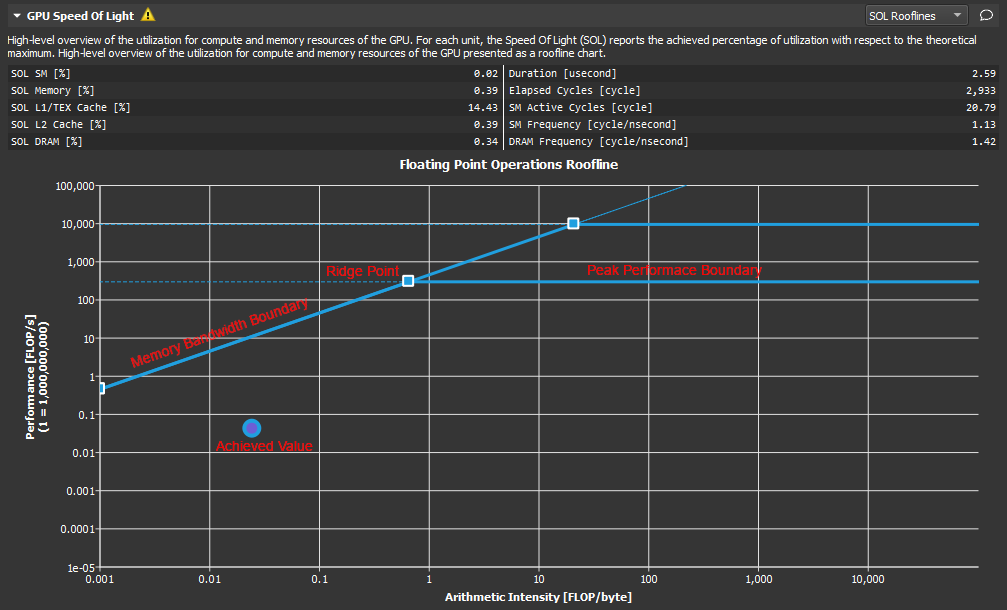
- Vertical Axis - The vertical axis represents Floating Point Operations per Second (FLOPS). For GPUs this number can get quite large and so the numbers on this axis can be scaled for easier reading (as shown here). In order to better accommodate the range, this axis is rendered using a logarithmic scale.
- Horizontal Axis - The horizontal axis represents Arithmetic Intensity, which is the ratio between Work (expressed in floating point operations per second), and Memory Traffic (expressed in bytes per second). The resulting unit is in floating point operations per byte. This axis is also shown using a logarithmic scale.
- Memory Bandwidth Boundary - The memory bandwidth boundary is the sloped part of the roofline. By default, this slope is determined entirely by the memory transfer rate of the GPU but can be customized inside the SpeedOfLight_RooflineChart.section file if desired.
- Peak Performance Boundary - The peak performance boundary is the flat part of the roofline By default, this value is determined entirely by the peak performance of the GPU but can be customized inside the SpeedOfLight_RooflineChart.section file if desired.
- Ridge Point - The ridge point is the point at which the memory bandwidth boundary meets the peak performance boundary. This point is a useful reference when analyzing kernel performance.
- Achieved Value - The achieved value represents the performance of the profiled kernel. If baselines are being used, the roofline chart will also contain an achieved value for each baseline. The outline color of the plotted achieved value point can be used to determine from which baseline the point came.
8.2. Analysis
The roofline chart can be very helpful in guiding performance optimization efforts for a particular kernel.

As shown here, the ridge point partitions the roofline chart into two regions. The area shaded in blue under the sloped Memory Bandwidth Boundary is the Memory Bound region, while the area shaded in green under the Peak Performance Boundary is the Compute Bound region. The region in which the achieved value falls, determines the current limiting factor of kernel performance.
The distance from the achieved value to the respective roofline boundary (shown in this figure as a dotted white line), represents the opportunity for performance improvement. The closer the achieved value is to the roofline boundary, the more optimal is its performance. An achieved value that lies on the Memory Bandwidth Boundary but is not yet at the height of the ridge point would indicate that any further improvements in overall FLOP/s are only possible if the Arithmetic Intensity is increased at the same time.
Using the baseline feature in combination with roofline charts, is a good way to track optimization progress over a number of kernel executions.
9. Memory Chart
The Memory Chart shows a graphical, logical representation of performance data for memory subunits on and off the GPU. Performance data includes transfer sizes, hit rates, number of instructions or requests, etc.
9.1. Overview

Logical Units (green)
Logical units are shown in green color.- Kernel: The CUDA kernel executing on the GPU's Streaming Multiprocessors
- Global: CUDA global memory
- Local: CUDA local memory
- Texture: CUDA texture memory
- Surface: CUDA surface memory
- Shared: CUDA shared memory
- Load Global Store Shared: Instructions loading directly from global into shared memory without intermediate register file access
Physical Units (blue)
Physical units are shown in blue color.- L1/TEX Cache: The L1/Texture cache. The underlying physical memory is split between this cache and the user-managed Shared Memory.
- Shared Memory: CUDA's user-managed shared memory. The underlying physical memory is split between this and the L1/TEX Cache.
- L2 Cache: The L2 cache
- L2 Compression: The memory compression unit of the L2 Cache
- System Memory: Off-chip system (CPU) memory
- Device Memory: On-chip device (GPU) memory of the CUDA device that executes the kernel
- Peer Memory: On-chip device (GPU) memory of other CUDA devices
Depending on the exact GPU architecture, the exact set of shown units can vary, as not all GPUs have all units.
Links
Links between Kernel and other logical units represent the number of executed instructions (Inst) targeting the respective unit. For example, the link between Kernel and Global represents the instructions loading from or storing to the global memory space. Instructions using the NVIDIA A100's Load Global Store Shared paradigm are shown separately, as their register or cache access behavior can be different from regular global loads or shared stores.
Links between logical units and blue, physical units represent the number of requests (Req) issued as a result of their respective instructions. For example, the link going from L1/TEX Cache to Global shows the number of requests generated due to global load instructions.
The color of each link represents the percentage of peak utilization of the corresponding communication path. The color legend to the right of the chart shows the applied color gradient from unused (0%) to operating at peak performance (100%). Triangle markers to the left of the legend correspond to the links in the chart. The markers offer a more accurate value estimate for the achieved peak performances than the color gradient alone.
A unit often shares a common data port for incoming and outgoing traffic. While the links sharing a port might operate well below their individual peak performances, the unit's data port may have already reached its peak. Port utilization is shown in the chart by colored rectangles inside the units located at the incoming and outgoing links. Ports use the same color gradient as the data links and have also a corresponding marker to the left of the legend.
An example of the correlation between the peak values reported in the memory tables and the ports in the memory chart is shown below.

10. Memory Tables
The Memory Tables show detailed metrics for the various memory HW units, such as shared memory, the caches, and device memory. For most table entries, you can hover over it to see the underlying metric name and description. Some entries are generated as derivatives from other cells, and do not show a metric name on their own, but the respective calculation. If a certain metric does not contribute to the generic derivative calculation, it is shown as UNUSED in the tooltip. You can hover over row or column headers to see a description of this part of the table.
10.1. Shared Memory
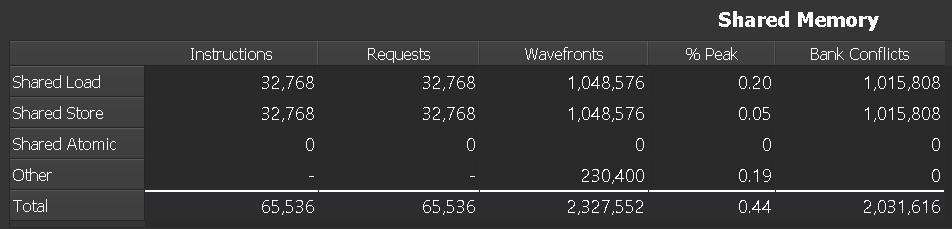
Columns
| Instructions |
For each access type, the total number of all actually executed assembly (SASS) instructions per warp. Predicated-off instructions are not included. E.g., the instruction STS would be counted towards Shared Store. |
| Requests |
The total number of all requests to shared memory. On SM 7.0 (Volta) and newer architectures, each shared memory instruction generates exactly one request. |
| Wavefronts | Number of wavefronts required to service the requested shared memory data. Wavefronts are serialized and processed on different cycles. |
| % Peak | Percentage of peak utilization. Higher values imply a higher utilization of the unit and can show potential bottlenecks, as it does not necessarily indicate efficient usage. |
| Bank Conflicts | If multiple threads' requested addresses map to different offsets in the same memory bank, the accesses are serialized. The hardware splits a conflicting memory request into as many separate conflict-free requests as necessary, decreasing the effective bandwidth by a factor equal to the number of colliding memory requests. |
10.2. L1/TEX Cache

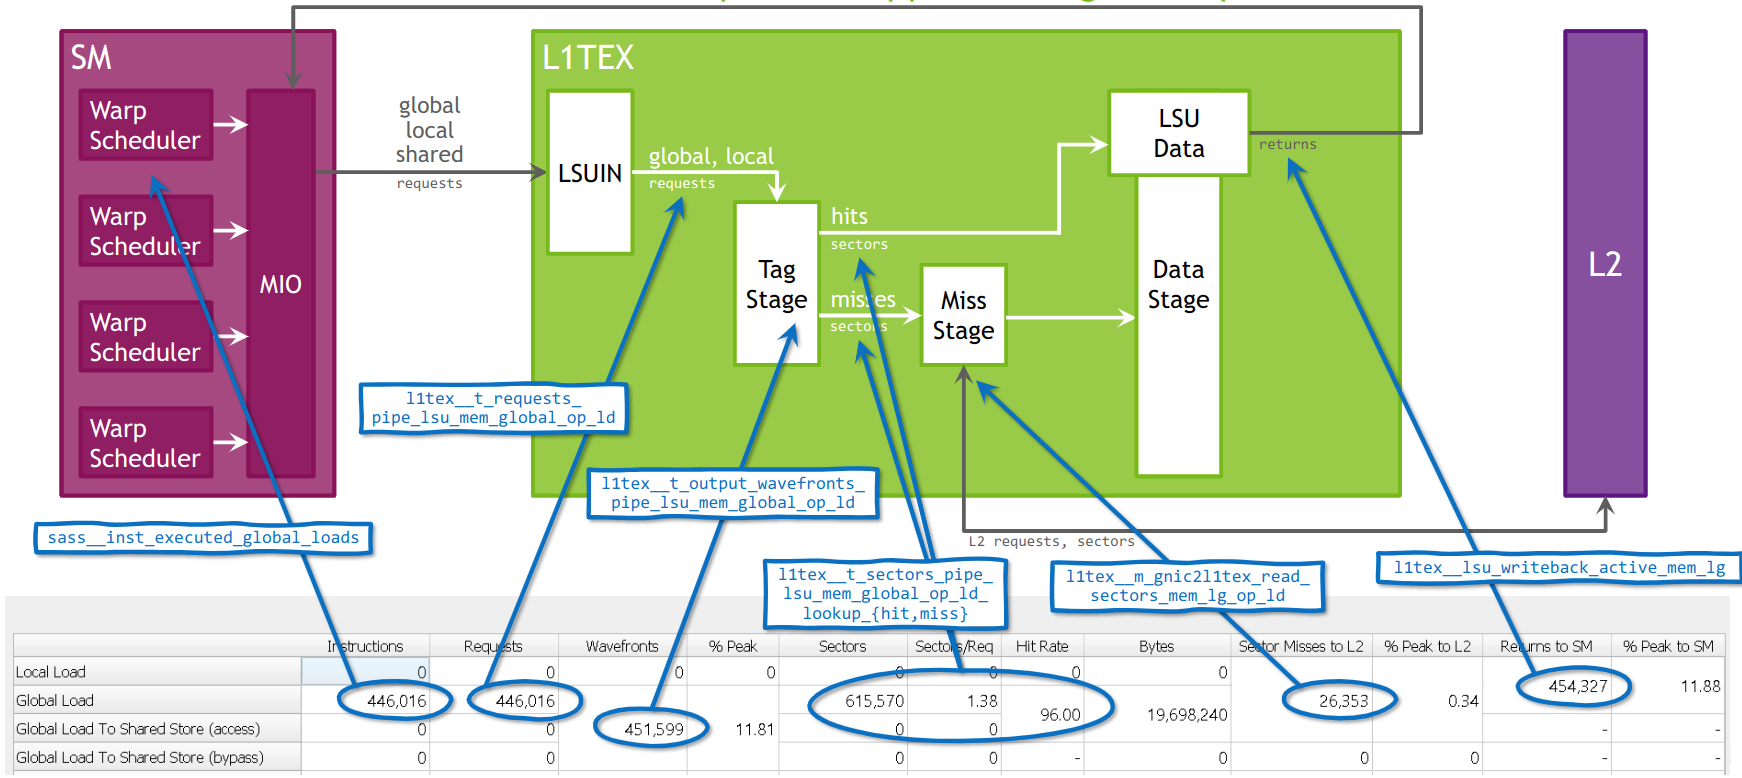
Columns
| Instructions |
For each access type, the total number of all actually executed assembly (SASS) instructions per warp. Predicated-off instructions are not included. E.g., the instruction LDG would be counted towards Global Loads. |
| Requests |
The total number of all requests to L1, generated for each instruction type. On SM 7.0 (Volta) and newer architectures, each instruction generates exactly one request for LSU traffic (global, local, ...). For texture (TEX) traffic, more than one request may be generated. In the example, each of the 65536 global load instructions generates exactly one request. |
| Wavefronts | Number of wavefronts required to service the requested memory operation. Wavefronts are serialized and processed on different cycles. |
| Wavefront % Peak | Percentage of peak utilization for the units processing wavefronts. High numbers can imply that the processing pipelines are saturated and can become a bottleneck. |
| Sectors | The total number of all L1 sectors accesses sent to L1. Each load or store request accesses one or more sectors in the L1 cache. Atomics and reductions are passed through to the L2 cache. |
| Sectors/Req |
The average ratio of sectors to requests for the L1 cache. For the same number of active threads in a warp, smaller numbers imply a more efficient memory access pattern. For warps with 32 active threads, the optimal ratios per access size are: 32-bit: 4, 64-bit: 8, 128-bit: 16. Smaller ratios indicate some degree of uniformity or overlapped loads within a cache line. Higher numbers can imply uncoalesced memory accesses and will result in increased memory traffic. In the example, the average ratio for global loads is 32 sectors per request, which implies that each thread needs to access a different sector. Ideally, for warps with 32 active threads, with each thread accessing a single, aligned 32-bit value, the ratio would be 4, as every 8 consecutive threads access the same sector. |
| Hit Rate | Sector hit rate (percentage of requested sectors that do not miss) in the L1 cache. Sectors that miss need to be requested from L2, thereby contributing to Sector Misses to L2. Higher hit rates imply better performance due to lower access latencies, as the request can be served by L1 instead of a later stage. Not to be confused with Tag Hit Rate (not shown). |
| Bytes | Total number of bytes requested from L1. This is identical to the number of sectors multiplied by 32 byte, since the minimum access size in L1 is one sector. |
| Sector Misses to L2 |
Total number of sectors that miss in L1 and generate subsequent requests in the L2 Cache. In this example, the 262144 sector misses for global and local loads can be computed as the miss-rate of 12.5%, multiplied by the number of 2097152 sectors. |
| % Peak to L2 | Percentage of peak utilization of the L1-to-XBAR interface, used to send L2 cache requests. If this number is high, the workload is likely dominated by scattered {writes, atomics, reductions}, which can increase the latency and cause warp stalls. |
| Returns to SM | Number of return packets sent from the L1 cache back to the SM. Larger request access sizes result in higher number of returned packets. |
| % Peak to SM | Percentage of peak utilization of the XBAR-to-L1 return path (compare Returns to SM). If this number is high, the workload is likely dominated by scattered reads, thereby causing warp stalls. Improving read-coalescing or the L1 hit rate could reduce this utilization. |
Rows
| (Access Types) | The various access types, e.g. loads from global memory or reduction operations on surface memory. |
| Loads | The aggregate of all load access types in the same column. |
| Stores | The aggregate of all store access types in the same column. |
| Total | The aggregate of all load and store access types in the same column. |
10.3. L2 Cache
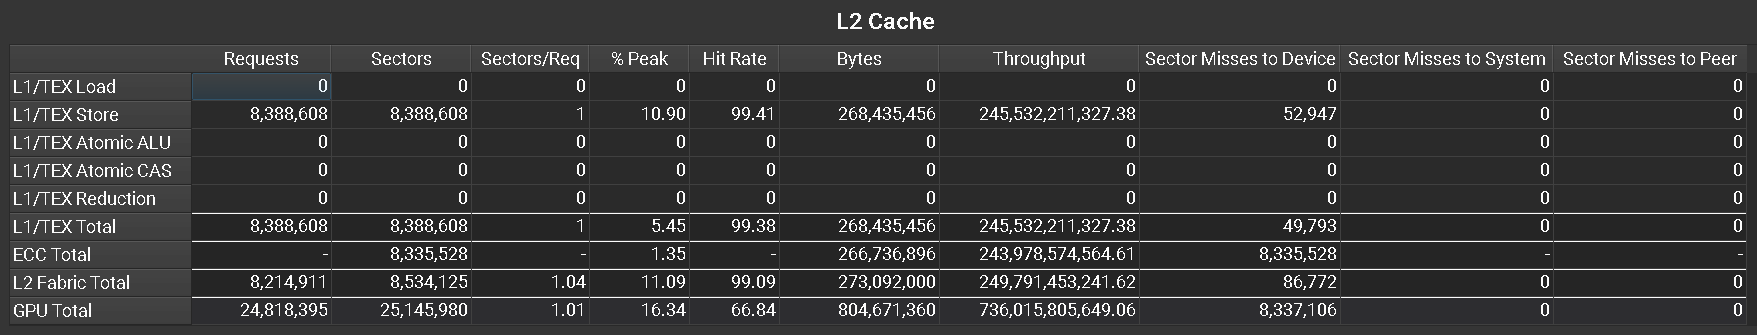
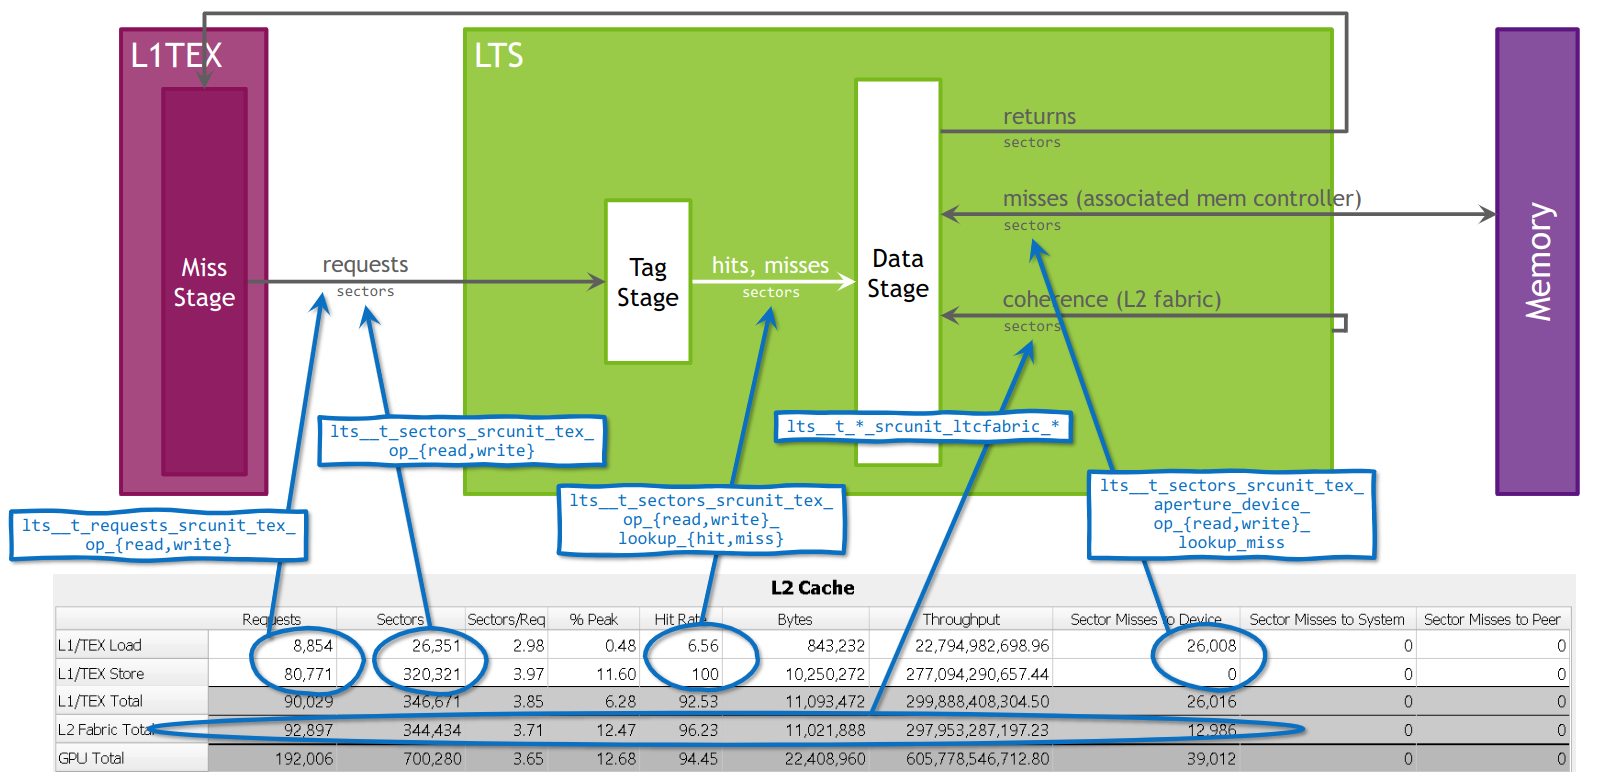
Columns
| Requests | For each access type, the total number of requests made to the L2 cache. This correlates with the Sector Misses to L2 for the L1 cache. Each request targets one 128 byte cache line. |
| Sectors | For each access type, the total number of sectors requested from the L2 cache. Each request accesses one or more sectors. |
| Sectors/Req | The average ratio of sectors to requests for the L2 cache. For the same number of active threads in a warp, smaller numbers imply a more efficient memory access pattern. For warps with 32 active threads, the optimal ratios per access size are: 32-bit: 4, 64-bit: 8, 128-bit: 16. Smaller ratios indicate some degree of uniformity or overlapped loads within a cache line. Higher numbers can imply uncoalesced memory accesses and will result in increased memory traffic. |
| % Peak | Percentage of peak sustained number of sectors. The "work package" in the L2 cache is a sector. Higher values imply a higher utilization of the unit and can show potential bottlenecks, as it does not necessarily indicate efficient usage. |
| Hit Rate | Hit rate (percentage of requested sectors that do not miss) in the L2 cache. Sectors that miss need to be requested from a later stage, thereby contributing to one of Sector Misses to Device, Sector Misses to System, or Sector Misses to Peer. Higher hit rates imply better performance due to lower access latencies, as the request can be served by L2 instead of a later stage. |
| Bytes | Total number of bytes requested from L2. This is identical to the number of sectors multiplied by 32 byte, since the minimum access size in L2 is one sector. |
| Throughput | Achieved L2 cache throughput in bytes per second. High values indicate high utilization of the unit. |
| Sector Misses to Device | Total number of sectors that miss in L2 and generate subsequent requests in device memory. |
| Sector Misses to System | Total number of sectors that miss in L2 and generate subsequent requests in system memory. |
| Sector Misses to Peer | Total number of sectors that miss in L2 and generate subsequent requests in peer memory. |
Rows
| (Access Types) | The various access types, e.g. loads or reductions originating from L1 cache. |
| L1/TEX Total | Total for all operations originating from the L1 cache. |
| ECC Total | Total for all operations caused by ECC (Error Correction Code). If ECC is enabled, L2 write requests that partially modify a sector cause a corresponding sector load from DRAM. These additional load operations increase the sector misses of L2. |
| L2 Fabric Total | Total for all operations across the L2 fabric connecting the two L2 partitions. This row is only shown for kernel launches on CUDA devices with L2 fabric. |
| GPU Total | Total for all operations across all clients of the L2 cache. Independent of having them split out separately in this table. |
10.4. L2 Cache Eviction Policies
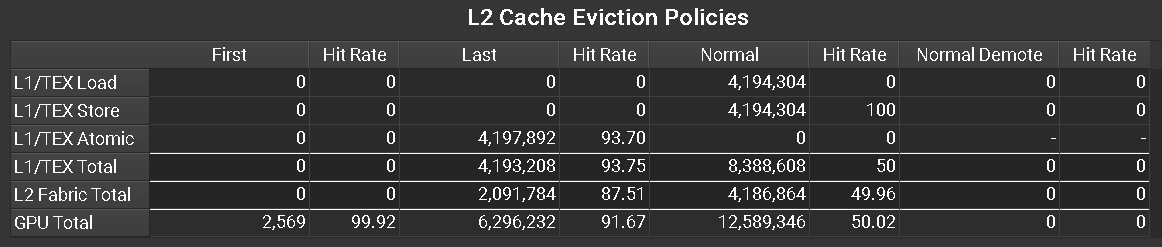
Columns
| First | Number of sectors accessed in the L2 cache using the evict_first policy. Data cached with this policy will be first in the eviction priority order and will likely be evicted when cache eviction is required. This policy is suitable for streaming data. |
| Hit Rate | Cache hit rate for sector accesses in the L2 cache using the evict_first policy. |
| Last | Number of sectors accessed in the L2 cache using the evict_last policy. Data cached with this policy will be last in the eviction priority order and will likely be evicted only after other data with evict_normal or evict_first eviction policy is already evicted. This policy is suitable for data that should remain persistent in cache. |
| Hit Rate | Cache hit rate for sector accesses in the L2 cache using the evict_last policy. |
| Normal | Number of sectors accessed in the L2 cache using the evict_normal policy. This is the default policy. |
| Hit Rate | Cache hit rate for sector accesses in the L2 cache using the evict_normal policy. |
| Normal Demote | Number of sectors accessed in the L2 cache using the evict_normal_demote policy. |
| Hit Rate | Cache hit rate for sector accesses in the L2 cache using the evict_normal_demote policy. |
Rows
| (Access Types) | The various access types, e.g. loads or reductions, originating from L1 cache. |
| L1/TEX Total | Total for all operations originating from the L1 cache. |
| L2 Fabric Total | Total for all operations across the L2 fabric connecting the two L2 partitions. This row is only shown for kernel launches on CUDA devices with L2 fabric. |
| GPU Total | Total for all operations across all clients of the L2 cache. Independent of having them split out separately in this table. |
10.5. Device Memory

Columns
| Sectors | For each access type, the total number of sectors requested from device memory. |
| % Peak | Percentage of peak device memory utilization. Higher values imply a higher utilization of the unit and can show potential bottlenecks, as it does not necessarily indicate efficient usage. |
| Bytes | Total number of bytes transferred between L2 Cache and device memory. |
| Throughput | Achieved device memory throughput in bytes per second. High values indicate high utilization of the unit. |
11. FAQ
- n/a metric values
n/a means that the metric value is "not available". The most common reason is that the requested metric does not exist. This can either be the result of a typo, or a missing suffix. Verify the metric name against the output of of the --query-metricsNVIDIA Nsight Compute CLI option.
If the metric name was copied (e.g. from an old version of this documentation), make sure that it does not contain zero-width unicode characters.
Finally, the metric might simply not exist for the targeted GPU architecture. For example, the IMMA pipeline metric sm__inst_executed_pipe_tensor_op_imma.avg.pct_of_peak_sustained_active is not available on GV100 chips.
- Metric values outside the expected logical range
This includes e.g. percentages exceeding 100% or metrics reporting negative values. For further details, see Range and Precision.
- ERR_NVGPUCTRPERM - The user does not have permission to access NVIDIA GPU Performance Counters on the target device.
By default, NVIDIA drivers require elevated permissions to access GPU performance counters. On mobile platforms, profile as root/using sudo. On other platforms, you can either start profiling as root/using sudo, or by enabling non-admin profiling. For further details, see https://developer.nvidia.com/ERR_NVGPUCTRPERM.
On Windows Subsystem for Linux (WSL), access to NVIDIA GPU Performance Counters must be enabled in the NVIDIA Control Panel of the Windows host.
- Unsupported GPU
This indicates that the GPU, on which the current kernel is launched, is not supported. See the Release Notes for a list of devices supported by your version of NVIDIA Nsight Compute. It can also indicate that the current GPU configuration is not supported. For example, NVIDIA Nsight Compute might not be able to profile GPUs in SLI configuration.
- Connection error detected communicating with target application.
The inter-process connection to the profiled application unexpectedly dropped. This happens if the application is killed or signals an exception (e.g. segmentation fault).
- Failed to connect. The target process may have exited.This occurs if
- the application does not call any CUDA API calls before it exits.
- the application terminates early because it was started from the wrong working directory, or with the wrong arguments. In this case, check the details in the Connection Dialog.
- the application crashes before calling any CUDA API calls.
- the application launches child processes which use the CUDA. In this case, launch with the --target-processes all option.
- The profiler returned an error code: (number)
For the non-interactive Profile activity, the NVIDIA Nsight Compute CLI is started to generate the report. If either the application exited with a non-zero return code, or the NVIDIA Nsight Compute CLI encountered an error itself, the resulting return code will be shown in this message.
For example, if the application hit a segmentation fault (SIGSEGV) on Linux, it will likely return error code 11. All non-zero return codes are considered errors, so the message is also shown if the application exits with return code 1 during regular execution.
To debug this issue, it can help to run the data collection directly from the command line using ncu in order to observe the application's and the profiler's command line output, e.g. ==ERROR== The application returned an error code (11)
- Failed to open/create lock file (path). Please check that this process has write permissions on this file.
NVIDIA Nsight Compute failed to create or open the file (path) with write permissions. This file is used for inter-process serialization. NVIDIA Nsight Compute does not remove this file after profiling by design. The error occurs if the file was created by a profiling process with permissions that prevent the current process from writing to this file, or if the current user can't acquire this file for other reasons (e.g. certain Linux kernel security settings).
The file is in the current temporary directory, i.e. TMPDIR/nsight-compute-lock. On Windows, TMPDIR is the path returned by the Windows GetTempPath API function. On other platforms, it is the path supplied by the first environment variable in the list TMPDIR, TMP, TEMP, TEMPDIR. If none of these is found, it's /var/nvidia on QNX and /tmp otherwise.
Older versions of NVIDIA Nsight Compute did not set write permissions for all users on this file by default. As a result, running the tool on the same system with a different user might cause this error. This has been resolved since version 2020.2.1.
The following workarounds can be used to solve this problem:- If it is otherwise ensured that no concurrent NVIDIA Nsight Compute instances are active on the same system, set TMPDIR to a different directory for which the current user has write permissions.
- Ask the user owning the file, or a system administrator, to remove it or add write permissions for all potential users.
- On Linux systems setting fs.protected_regular=1, root or other users may not be able to access this file, even though the owner can, if the sticky bit is set on the temporary directory. Either disable this setting using sudo sysctl fs.protected_regular=0, use a different temporary directory (see above), or enable access to hardware performance counters for non-root users and profile as the same user who owns the file (see https://developer.nvidia.com/ERR_NVGPUCTRPERM on how to change this setting).
- Profiling failed because a driver resource was unavailable.
The error indicates that a required CUDA driver resource was unavailable during profiling. Most commonly, this means that NVIDIA Nsight Compute could not reserve the driver's performance monitor, which is necessary for collecting most metrics.
This can happen if another application has a concurrent reservation on this resource. Such applications can be e.g. DCGM, a client of CUPTI's Profiling API, Nsight Graphics, or another instance of NVIDIA Nsight Compute without access to the same file system (see serialization for how this is prevented within the same file system).
If you expect the problem to be caused by DCGM, consider using dcgmi profile --pause to stop its monitoring while profiling with NVIDIA Nsight Compute.
-
Could not deploy stock * files to *
Could not determine user home directory for section deployment.
An error occurred while trying to deploy stock section or rule files. By default, NVIDIA Nsight Compute tries to deploy these to a versioned directory in the user's home directory (as identified by the HOME environment variable on Linux), e.g. /home/user/Documents/NVIDIA Nsight Compute/<version>/Sections.
If the directory cannot be determined (e.g. because this environment variable is not pointing to a valid directory), or if there is an error while deploying the files (e.g. because the current process does not have write permissions on it), warning messages are shown and NVIDIA Nsight Compute falls back to using stock sections and rules from the installation directory.
If you are in an environment where you consistently don't have write access to the user's home directory, consider populating this directory upfront using ncu --section-folder-restore, or by making /home/user/Documents/NVIDIA Nsight Compute/<version> a symlink to a writable directory.
-
ProxyJump SSH option is not working
NVIDIA Nsight Compute does not manage authentication or interactive prompts with the OpenSSH client launched when using the ProxyJump option. Therefore, to connect through an intermediate host for the first time, you will not be able to accept the intermediate host's key. A simple way to pinpoint the cause of failures in this case is to open a terminal and use the OpenSSH client to connect to the remote target. Once that connection succeeds, NVIDIA Nsight Compute should be able to connect to the target, too.
-
SSH connection fails without trying to connect
If the connection fails without trying to connect, there may be a problem with the settings you entered into the connection dialog. Please make sure that the IP/Host Name, User Name and Port fields are correctly set.
-
SSH connections are still not working
The problem might come from NVIDIA Nsight Compute's SSH client not finding a suitable host key algorithm to use which is supported by the remote server. You can force NVIDIA Nsight Compute to use a specific set of host key algorithms by setting the HostKeyAlgorithms option for the problematic host in your SSH configuration file. To list the supported host key algorithms for a remote target, you can use the ssh-keyscan utility which comes with the OpenSSH client.
-
Removing host keys from known hosts files
When connecting to a target machine, NVIDIA Nsight Compute tries to verify the target's host key against the same local database as the OpenSSH client. If NVIDIA Nsight Compute find the host key is incorrect, it will inform you through a failure dialog. If you trust the key hash shown in the dialog, you can remove the previously saved key for that host by manually editing your known hosts database or using the ssh-keygen -R <host> command.
-
Qt initialization failed
Failed to load Qt platform plugin
See System Requirements for Linux.
Notices
Notice
ALL NVIDIA DESIGN SPECIFICATIONS, REFERENCE BOARDS, FILES, DRAWINGS, DIAGNOSTICS, LISTS, AND OTHER DOCUMENTS (TOGETHER AND SEPARATELY, "MATERIALS") ARE BEING PROVIDED "AS IS." NVIDIA MAKES NO WARRANTIES, EXPRESSED, IMPLIED, STATUTORY, OR OTHERWISE WITH RESPECT TO THE MATERIALS, AND EXPRESSLY DISCLAIMS ALL IMPLIED WARRANTIES OF NONINFRINGEMENT, MERCHANTABILITY, AND FITNESS FOR A PARTICULAR PURPOSE.
Information furnished is believed to be accurate and reliable. However, NVIDIA Corporation assumes no responsibility for the consequences of use of such information or for any infringement of patents or other rights of third parties that may result from its use. No license is granted by implication of otherwise under any patent rights of NVIDIA Corporation. Specifications mentioned in this publication are subject to change without notice. This publication supersedes and replaces all other information previously supplied. NVIDIA Corporation products are not authorized as critical components in life support devices or systems without express written approval of NVIDIA Corporation.