API Inspector
When using the Frame Debugger feature of NVIDIA Nsight Graphics, you may wish to do a deep dive into the API state for specific draw calls in order to analyze your application further.
To use the API Inspector:
- Start the Frame Debugger by launching the application and going to Pause and Capture Frame.
- If not already opened by default, you can open the API Inspector by going to Frame Debugger > API Inspector or by clicking the link for the action in the Events View.
- Along the left side of the window, you can see the Pipeline State Navigator.
IA — The Input Assembler shows the layout of your vertex buffers and index buffers.
VS — Shows all of the shader resource views and constant buffers bound to the Vertex Shader stage, as well as links to the HLSL source code and other shader information.
HS — This shows all of the shader resource views and constant buffers bound to the Hull Shader stage, as well as links to the HLSL source code and other shader information.
DS — This shows all of the shader resource views and constant buffer bound to the Domain Shader stage, as well as links to the HLSL source code and other shader information.
GS — Shows all of the shader resource views and constant buffers bound to the Geometry Shader stage, as well as links to the HLSL source code and other shader information.
SO — Shows the resources bound for Stream Output.
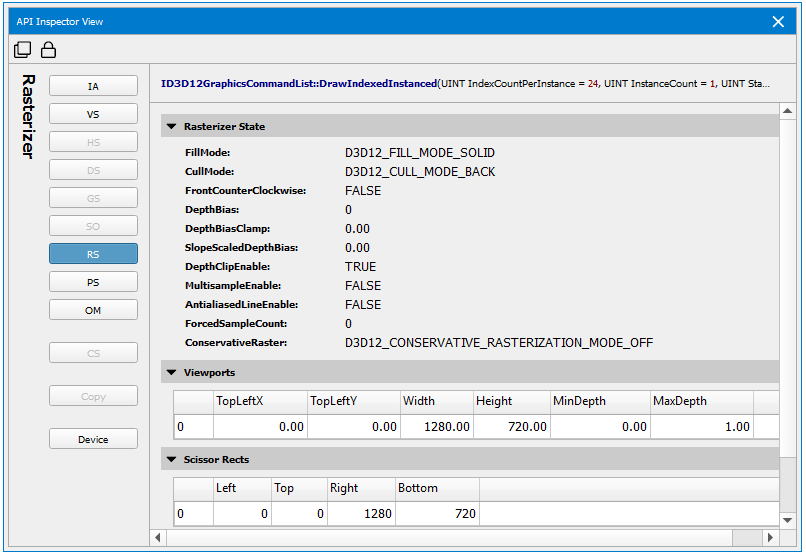
RS — Shows the Rasterizer State parameters, including culling mode, scissor and viewport rectangles, etc.
PS — Shows all of the shader resource views, constant buffers, and render target views bound to the Pixel Shader stage, as well as links to the HLSL source code and other shader information.
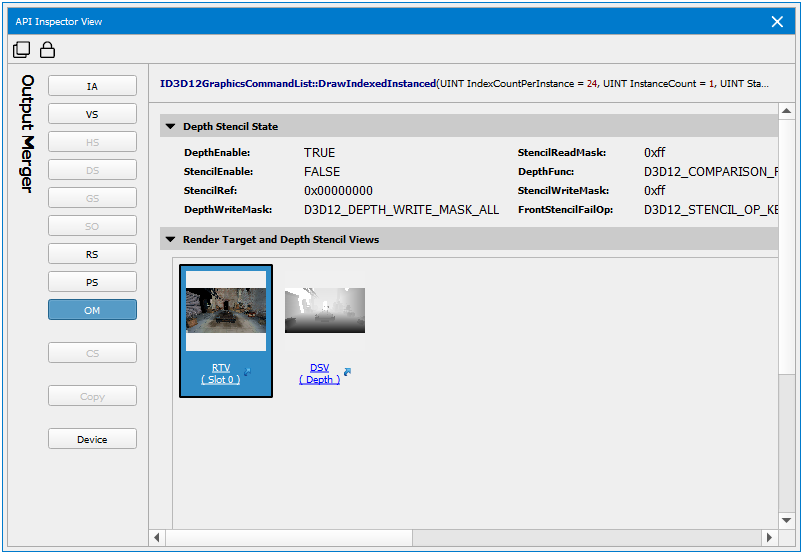
OM — Shows the Output Merger parameters, including blending setup, depth, stencil, render target views, etc.
CS — This shows all of the shader resource and unordered access views and constant buffers bound to the Compute Shader stage, as well as links to the HLSL source code and other shader information.
- From here, you can further inspect the API state for each pipeline stage, including what textures and render targets are bound, or which shaders are in use in the related constants.
The available pipeline stages for a Direct3D 12 application are detailed below.
Input Assembler (IA)
The Input Assembler page shows the layout of your vertex buffers and index buffers, as well as the vertex declaration information.

Shaders (VS, HS, DS, GS, PS, CS)
The various shader pages display all of the constant buffers, shader resource views, and input/output parameters, as well as links to the HLSL source code and other shader information.
In the constant buffer list, you can expand the buffer to see which HLSL variables are mapped to each entry, as well as the current values.
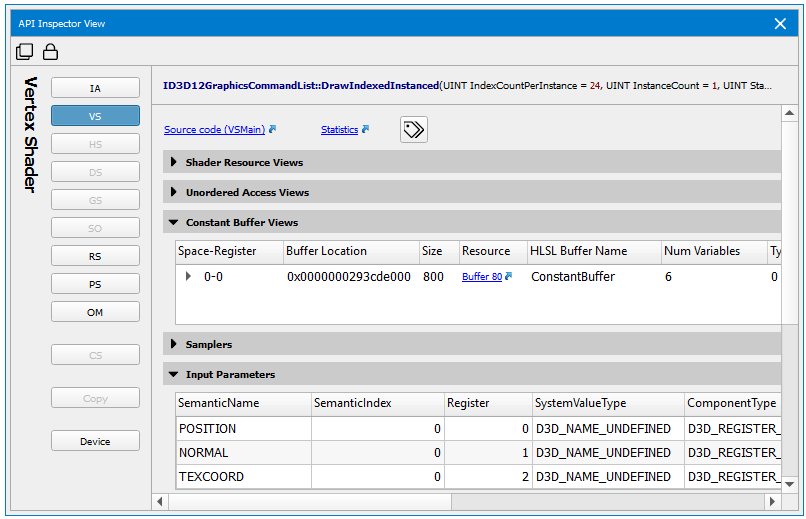
To enable resolution of HLSL variables, you must enable debug info when compiling the shader. Debug info can be enabled by using the /Zi command line option to fxc.exe or setting the D3DCOMPILE_DEBUG flag in the call to D3DCompile.
Rasterizer
The Rasterizer page displays render state settings, texture wrapping modes, and viewport information.
Output Merger (OM)
The Output Merger page displays parameters such as blending setup, depth, and stencil states.
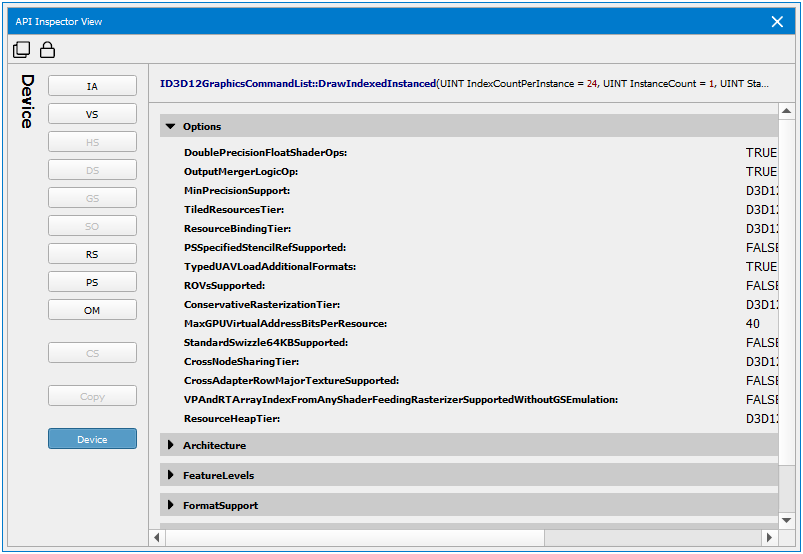
Device
The Device page displays details about the architecture that was used.
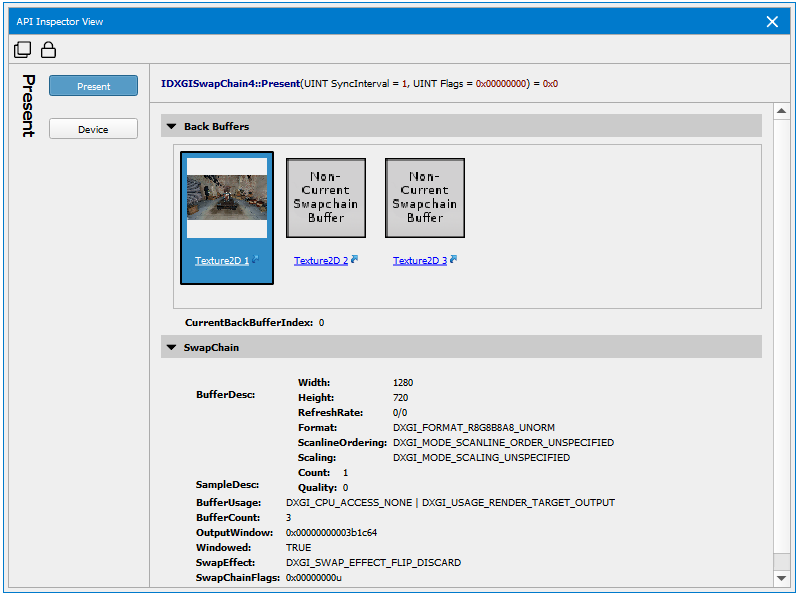
Present
The Present page displays information about back buffers that were used.

NVIDIA® Nsight Graphics Documentation Rev. 2018.4.180813 ©2018. NVIDIA Corporation. All Rights Reserved.