Frame Debugging
The NVIDIA Nsight Graphics Frame Debugger provides the ability for both real-time and capture-based application analysis. In real time, the Performance Dashboard shows a heads-up display (HUD) on the application being debugged, which includes real time performance data from both the GPU and CPU.
Once a capture is performed, you can navigate through draw events with the Frame Scrubber, see pipeline states in the API Inspector, inspect render targets and textures in the Resources View, and display profiler information with the scene broken down according to API performance markers. (Many of these features are similar to NVIDIA's Nsight Visual Studio Edition software, which may be familiar to you.)
Launch the Frame Debugger:
- From the main toolbar, select Connect to launch your target application.
- The Connect to process dialog will appear. Enter the Executable, Working Directory, Command Line Arguments and any Environment variables you need to run your application. Press the Launch button to launch the application.
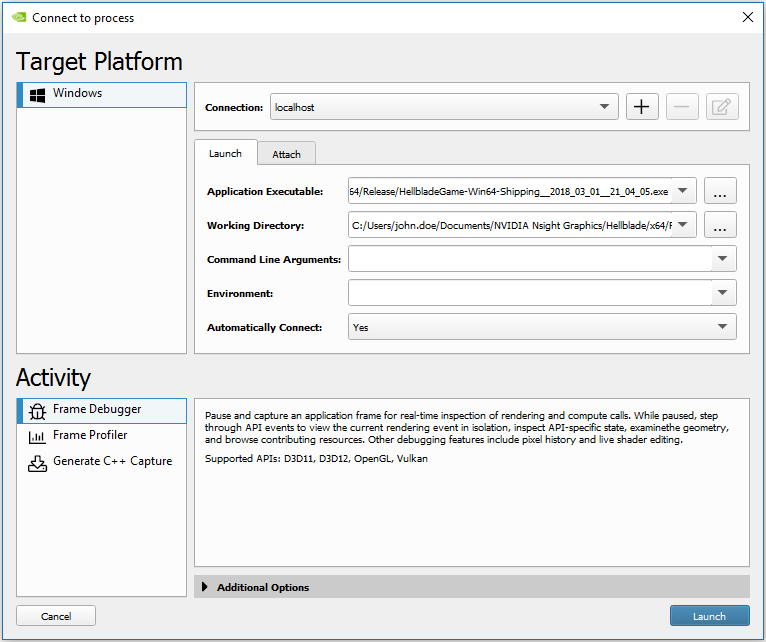
- If Automatically Connect is set to Yes, then NVIDIA Nsight Graphics will automatically connect to the application that is launched.
However, if your application requires a launcher application, then it should be set to No. If No is selected, the view will automatically switch to the Attach tab after you launch the application.
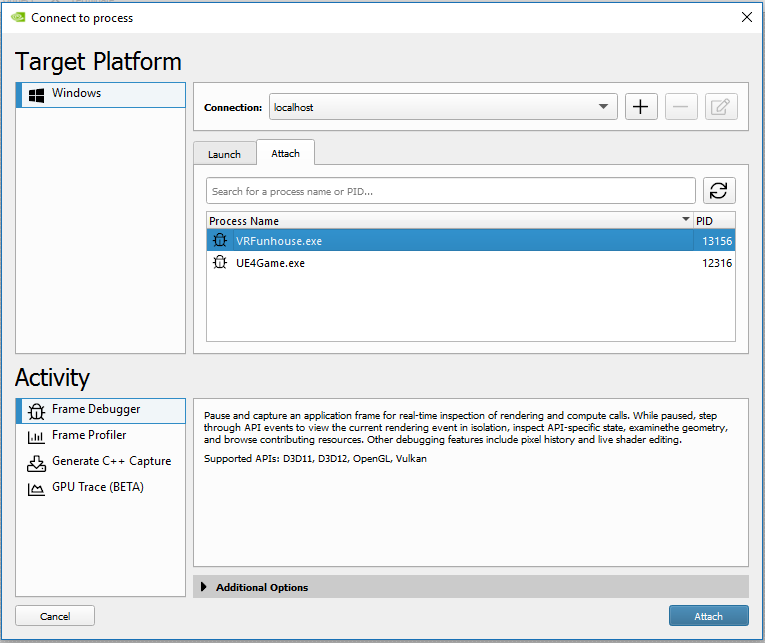
The Attach tab will show a list of processes that are available to be debugged by NVIDIA Nsight Graphics. Select the process that you wish to debug and click the Attach button.
- Once your application is running, the Performance Dashboard provides a real-time view of application performance, in relation to CPU and GPU activity.
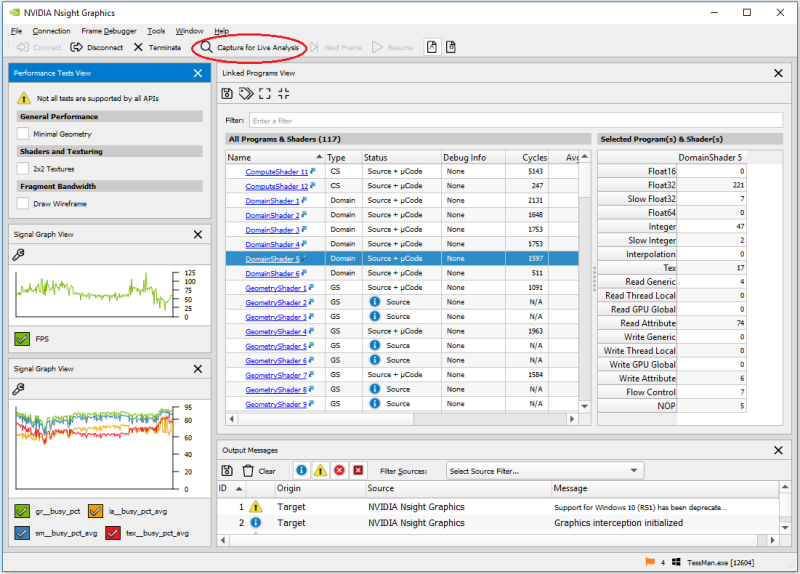
- From the main toolbar, select Capture for Live Analysis. In NVIDIA Nsight Graphics, a number of views will open. On the target application, the HUD will appear with the toolbar and scrubber.


Common Frame Debugger Features
There are two buttons that are common across several frame debugger views.
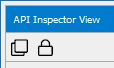
- The Clone button makes a copy of the current view, so that you can compare different parts of the API Inspector (or other cloned views) for the current action.
- The Lock button freezes the current view so that changing the current event does not update this view. This is helpful when trying to compare the same state on two different actions.
Supported APIs
Additional Resources

NVIDIA® Nsight Graphics Documentation Rev. 2018.4.180813 ©2018. NVIDIA Corporation. All Rights Reserved.