GPU Trace
Launch GPU Trace
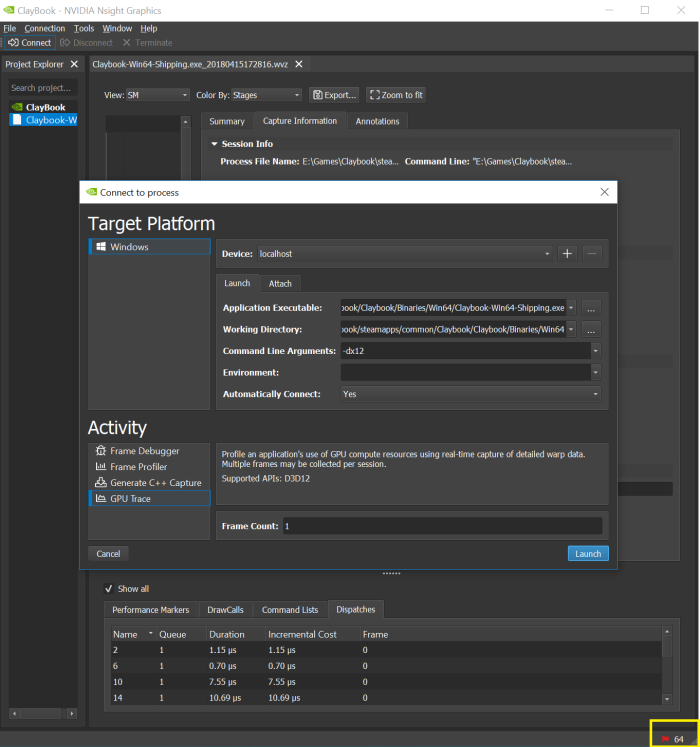
- From the main toolbar, select Connect to launch your target application.
- The Launch and Connect dialog will appear. Select GPU Trace activity in the Activities list.
- Enter the Executable, Working Directory, Command Line Arguments and any Environment variables you need to run your application. Press the Launch button to launch the application.
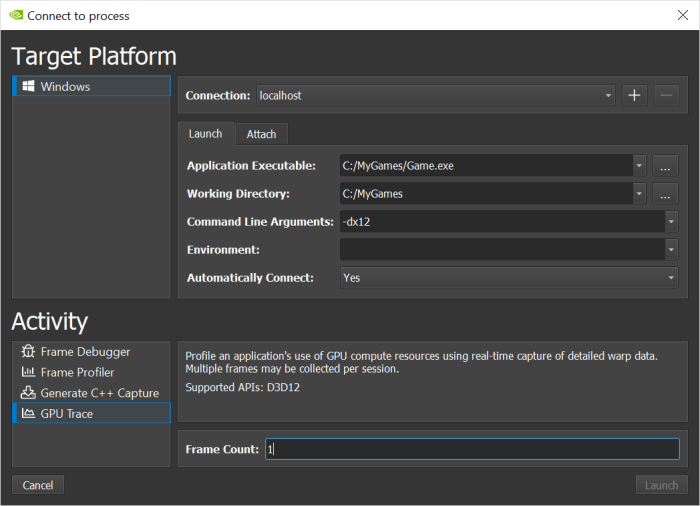
Frame Count defines how many frames will be captured. The maximum value is 10.

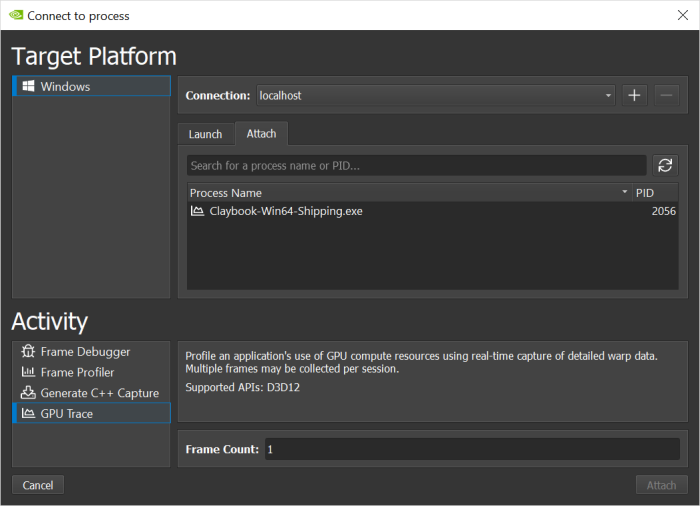
Note: GPU Trace consumes a lot of memory, especially in complex frames. You need to make sure that by capturing large number of frames, there is enough memory to consume it all. - If the Automatically Connect check box is enabled, then NVIDIA Nsight Graphics will automatically connect to the application that is launched. However, if your application requires a launcher application, then leave the check box disabled. With the check box disabled, the view will automatically switch to the Attach tab.
- When ready, your application should appear in the Process Name window. Click it to connect.
If the application successfully connected, the process name will appear in the lower right corner on the window.
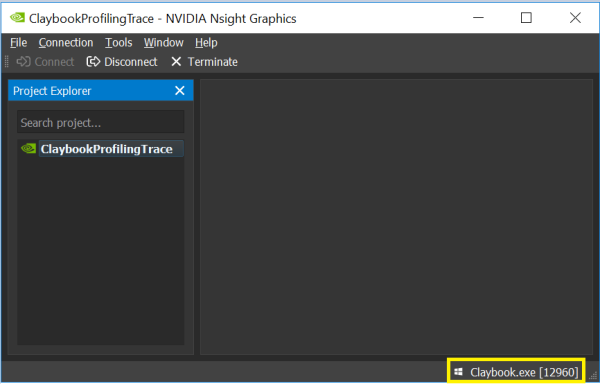
Note: Currently, it is only possible to run GPU Trace when the host and target are running on the same machine. - Once launched and connected, you can press F11 to capture a frame. Once F11 has been pressed, the newly captured file will appear in the Projects pane. Double-click the file to open.
Note: It is recommended that you capture the frame while the game is running in Full Screen mode. Note: It is recommended that you close the application after capturing, in order to free up your system's memory while exploring the captured file.
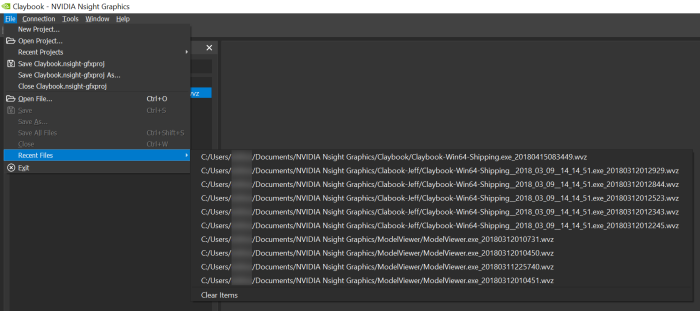
Recent Files
Load projects and files which were previously created through Files > Recent Files, or Files > Open Files.
Quick Launch
This option creates an empty new project in the Project Explorer. When you click on the empty project, a connection dialog will be displayed.
Working with GPU Trace
This chapter will walk through GPU Trace application with NVIDIA Nsight Graphics.
The GPU Trace window is comprised of 3 sections:
- Scrubber
- Information Tabs
- Events table
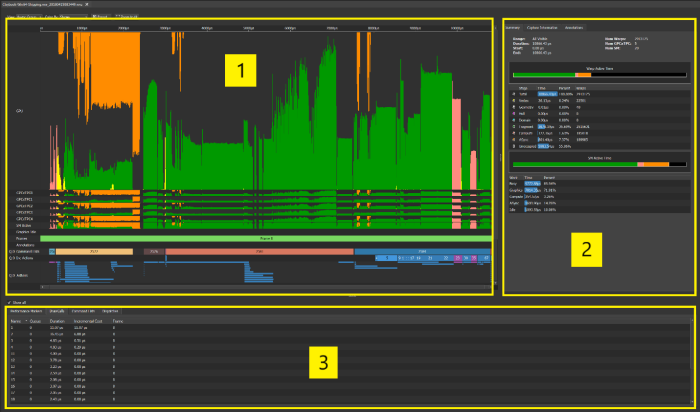
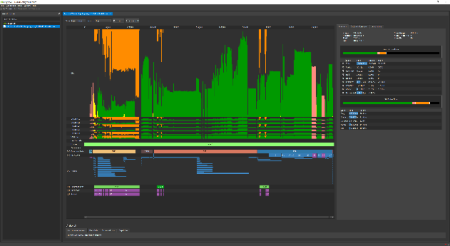
GPU Trace Scrubber
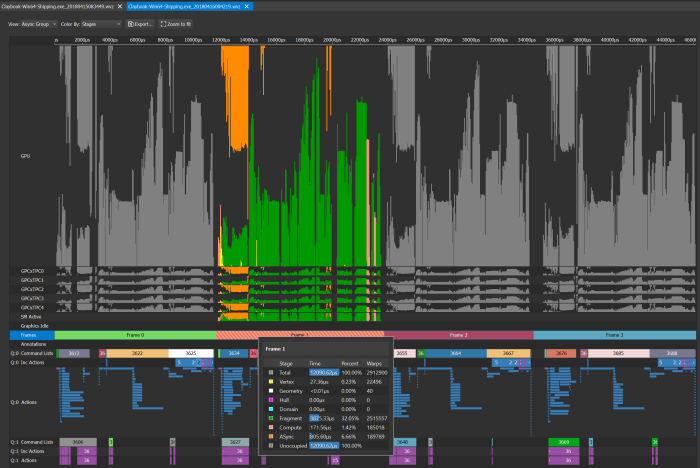
The GPU Trace scrubber is the main component in which you can observe the captured frame data.
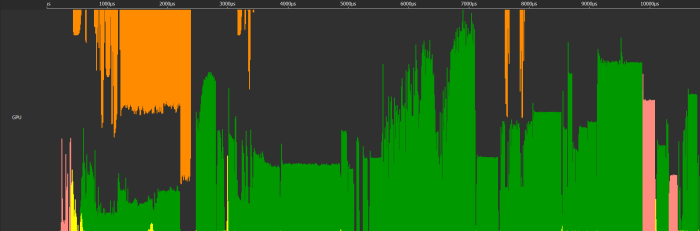
GPU Occupancy
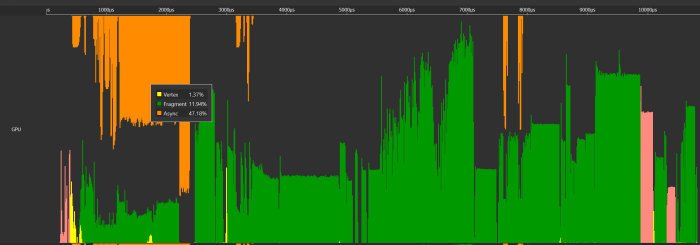
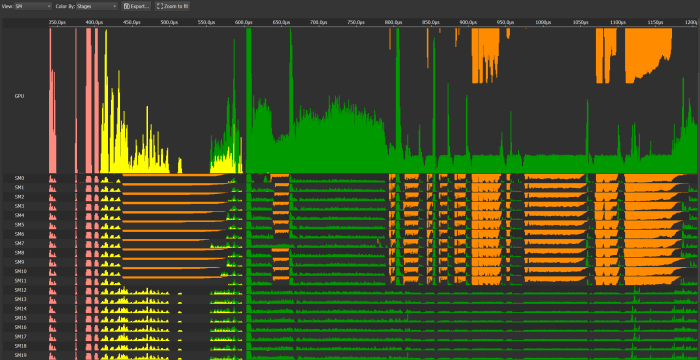
The GPU Occupancy row shows the occupancy of the hardware stages, in terms of warps. This shows the total warps' execution on the GPU. The warps may be grouped and colored according to stages, marker, actions, or Command Lists. By default, the warps' color is determined by stage (e.g., Vertex, Geometry, Hull, Domain, Fragment, Compute, Pixel, Compute, and Async Compute shaders).
Note: A compute shader running on an asynchronous queue will display from top to bottom (the orange in the below picture). All other shaders, which run on the graphics queue, will display from bottom to top.
When hovering your mouse over the scrubber, a tooltip will appear that displays the percentage of the warps' occupancy by stage, per the specific time.
GPCxTPC
The GPCxTPC row is a semantic grouping of the graphics processing units. Each GPU has multiple GPCs (Graphics Processing Clusters). Each GPC has numerous logical Texture Processing Clusters, or TPCs. The TPCs are numbered.
TPC#N blocks from each GPC in the GPU serve as a logical group for warp executions.
For example: if you have 1 GPU with 2 GPCs, and 3 TPCs per GPC, you’ll get the following logical groupings:
- GPCxTPC0 holds GPC0TPC0, GPC1TPC0
- GPCxTPC1 holds GPC0TPC1, GPC1TPC1
- GPCxTPC2 holds GPC0TPC2, GPC1TPC2

SM Active
The SM Active row shows a "flattened" view of the warps, in terms of total occupancy for each SM. If an individual SM has at least one warp in it, then it is counted as active. If all SMs have at least one active warp, then this graph would show a value 100% the height of the row. All graphics operations are shown in green, while all compute operations are shown in orange or pink.

Graphics/Compute Idle
The Graphics/Compute Idle metric represents the percentage of cycles spent idle in the Graphics Engine of the GPU, meaning the GPU is not performing any warp's execution for graphics and compute. The Graphics Engine services 3D, 2D, I2M, and Compute processing hardware. The GPU is composed of several engines, including Copy, Video, Display, and Security. As such, this metric does not account for any GPU work included in that list. Idle Graphics/Compute time may indicate:
- The workload is CPU-bound. This could occur when the CPU is not feeding commands fast enough to the GPU Front End (FE), so the FE has no work to process.
- DX12 Wait calls on fences in the Graphics/Compute engine (see Synchronization and Multi-Engine).

Frames
The Frames row helps detect warps per frame. When selecting a frame, only the warps related to the selected frame will be highlighted. When hovering your mouse over the frame, a tooltip summarizing the warps' activity will appear.
Command Lists
This row shows the captured Command List per queue. The Command List ID is displayed on the Command List bar. By hovering with the mouse, a tooltip summarizing the warp's activity will appear. Clicking on a Command List will highlight all of the warps which are part of that Command List.
Incremental Actions
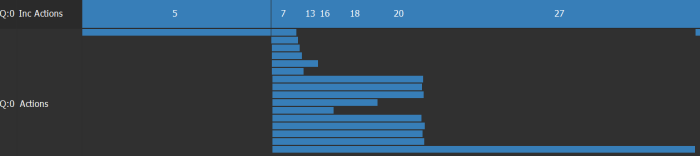
Incremental Actions represent actions by how much extra time is required to execute them on a GPU. If an action can execute inside the time of another action (i.e., perfect parallelism), then it would have no width on this line.
Actions
An action is a subset of the event types. It can be one of the following:
- Draw call
- Clear
- Dispatch
Actions are of interest because they explicitly change data, which may result in visual changes on the scrubber.
The Actions row shows the captured actions per queue. By hovering with the mouse, a tooltip summarizing the warp's activity will appear, as well as the action's ID. Clicking on the Action will highlight all of the warps which are part of that Action.
User Markers
GPU Trace also captures any user markers that exist in the application. This may help understand the frame workflow.

Scrubber Toolbar
At the top of the Scrubber view, there are 4 buttons that extend the Scrubber's capabilities.

View Options
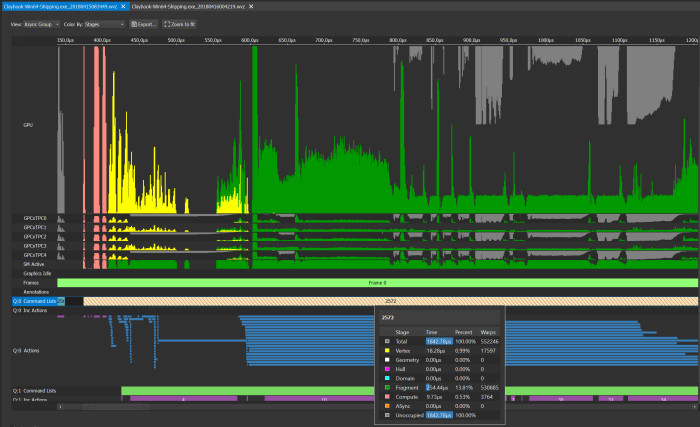
The View button on the Scrubber toolbar allows you to change the way the data is presented, from Grouped by GPCxTPC to per SM and vice versa. Viewing the warp's occupancy by SM may give more information as to how the GPU is being utilized. This is how the view appears like when sorted per SM:
Color Options
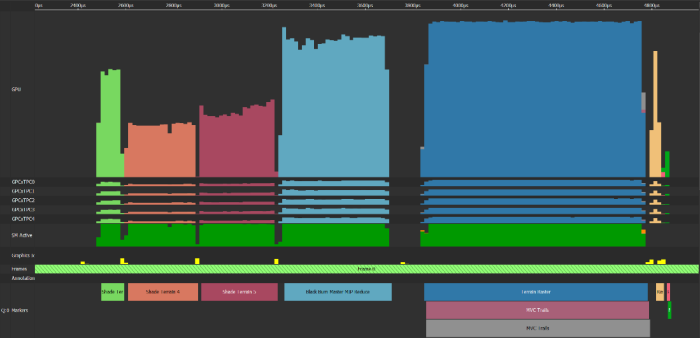
Color by Markers
The Direct3D 12 API added the ability to add User markers. This helps us to understand the frame execution and debug it. GPU Trace captures user markers, and also allows you to color the warps according to the marker execution.
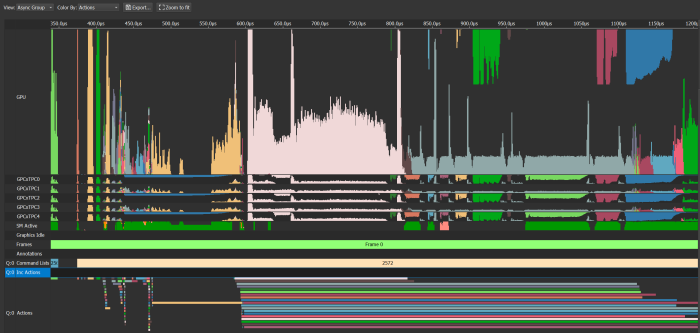
Color by Action
Choosing this option will color the warps according to which Action they belong to.
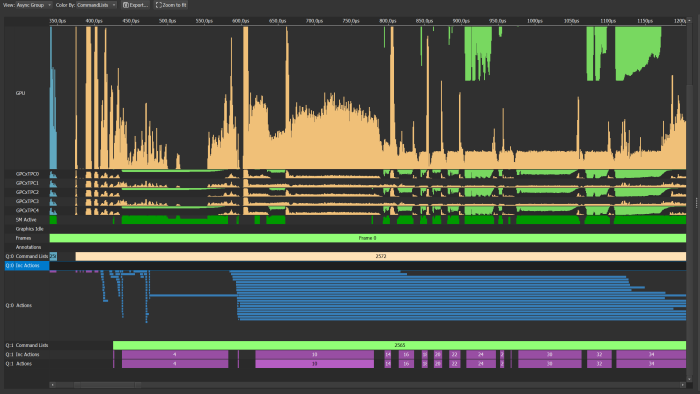
Color by Command List
Choosing this option will color the warps according to which Command List they belong to.
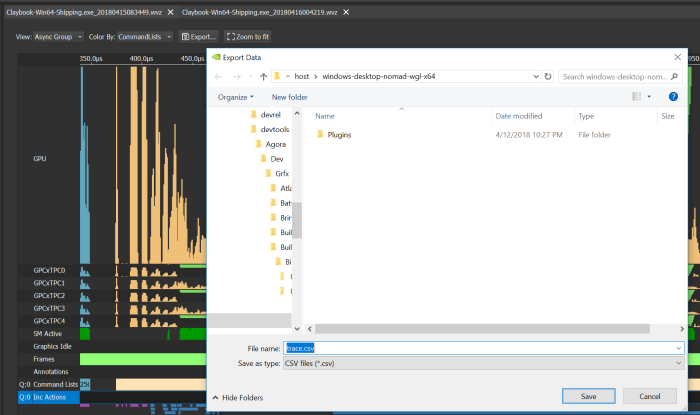
Export
GPU Trace allows you to export the warps data into a file in CSV format. This provides some flexibility in further calculation, if desired.
Zoom to Fit
Clicking this button will restore the original window zoom.
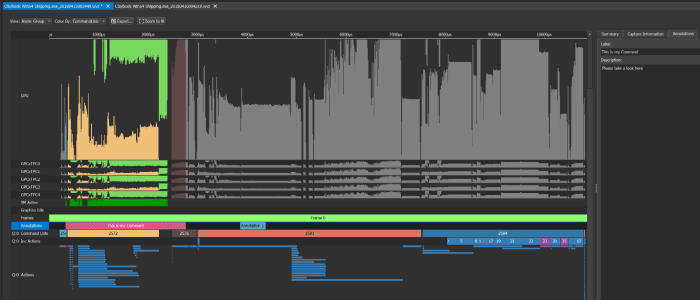
Annotations
While analyzing the captured data, you may want to add comments in certain locations. This can later serve as a reminder of where to look, or it may help if you wish to send the file to another user for further analysis.
To add an annotation, do the following:
- Select a range within the Annotations row.
- In the information section, the annotation tab will be opened.
- The annotation has 2 sections which you can edit:
- Label
- Description
The annotation section behaves like any other component in the scrubber; you can select, hover to review the corresponding tooltip, or zoom.
Once you create an annotation, an asterisk will appear by the name of the file in the window tab:
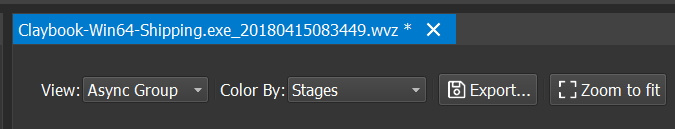
You can use the File menu to Save (or Save As...) the file for future reference.
Using the Scrubber
For more information on using the Scrubber, see one of the links below for your corresponding API:
Information Tabs
Summary Tab
The Summary tab shows important information on the captured data and the area that was selected in the Scrubber.
The main table shows information per shader type. You can uncheck the box next to a certain shader type to filter out those warps in the Scrubber view, and thus make it easier to understand the warp's occupancy.
- Range — Shows whether the data shown reflects the entire captured data or a user selection.
- Duration — The duration of the range selected.
- Start and End — Start and end times of the range selected.
- Num Warps — The number of warps in the range.
- Num GPCxTPC — The number of GPCxTPCs participating in the range's execution.
- Num SM — The number of SMs participating in the range's execution.
- Warp Active Time — The table shows time, percentage, and number of warps per stage. In this table, you can view the color scheme for each stage. The tables also allow you to select and deselect warps, according to which stage they belong to.
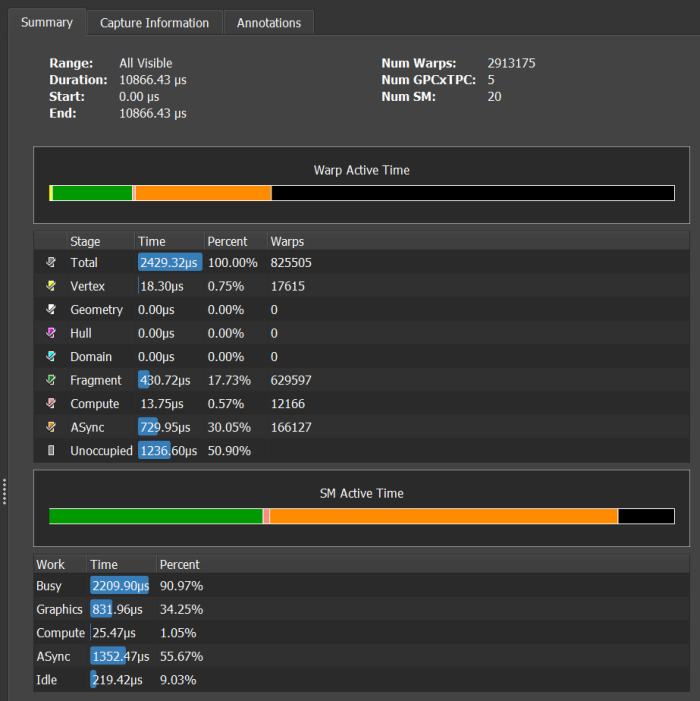
- SM Active time — This table shows how many SMs were active, in percentage, according to Graphics, Compute, and Async Compute for the selected range. This view can quickly show whether the GPU was idle unexpectedly longer then assumed for this range, which could indicate the application is CPU-bound.
Capture Information Tab
The Capture Information tab gives general information about the captured file. This might be useful when trying to analyze workload behavior or reproduce issues.
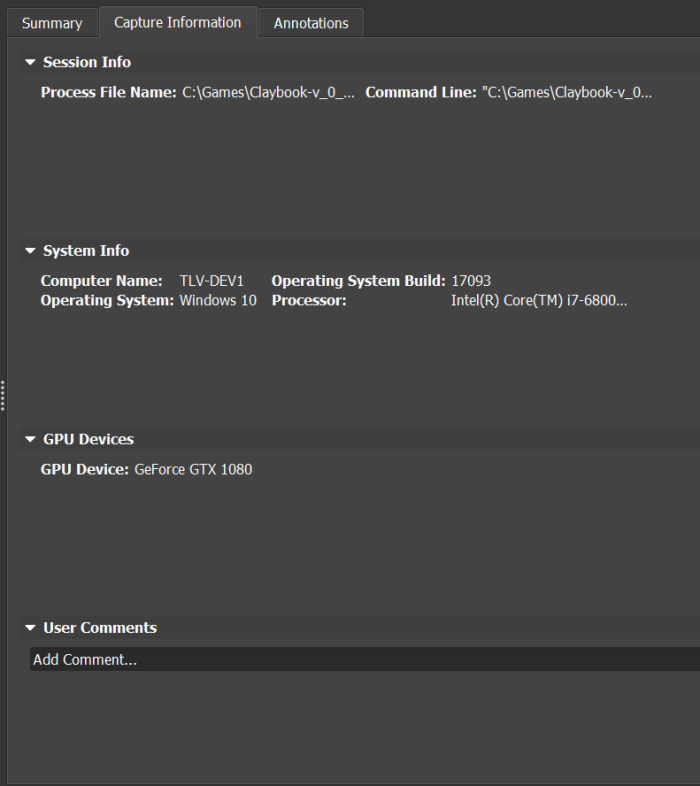
- Session Info — The Session Info section includes the process file name and location, as well as any command line arguments that were used when the application was run.
- System Info — This section lists the computer name, operating system, operating system build, and processor that was used.
- GPU Device — The GPU that was used when running the session.
- User Comments — This field can be changed or edited by the user. It is saved in the captured file for future reference. This can be very useful when collaborating with others on an application.
Annotations Tab
The Annotations tab is used for getting the data for a newly created annotation. For specifications, see the Annotations section.
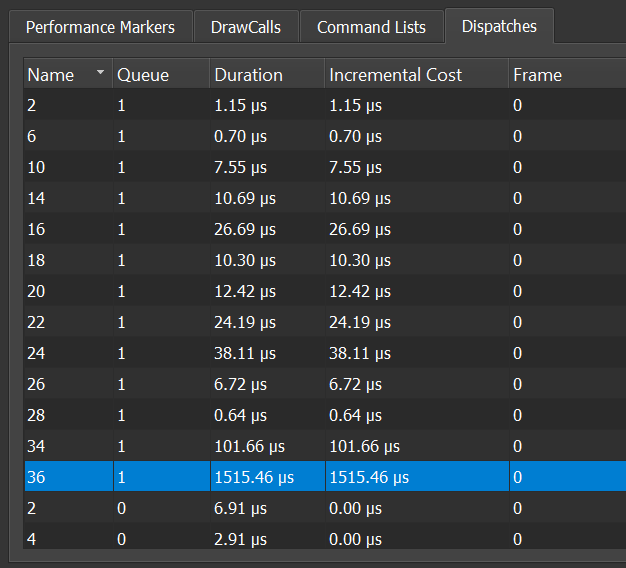
Events Table
The Events Table summarizes the captured events according to types:
- Performance markers
- Draw Calls
- Command Lists
- Dispatches
The Events Table allows you to browse the various events, and sort them according to name, queue, duration, Incremental Cost, or frame.
The Events table correlates with the Scrubber. Selecting one of the events will automatically select the correlating event in the Scrubber, making it easy to find.
Troubleshooting
Launching a graphics application with NVIDIA Nsight Graphics and capturing the data is not a trivial task and there are many things that can go wrong.
While trying to connect you might notice a small red flag in the bottom right corner of the NVIDIA Nsight Graphics application.
Double-clicking on the flag icon will open the Output Messages window. This window logs many types of events that the application triggers. This could provide some assistance when trying to determine why your application may not run, connect, or capture correctly.

NVIDIA® Nsight Graphics Documentation Rev. 2018.4.180813 ©2018. NVIDIA Corporation. All Rights Reserved.