Range Profiler
The Range Profiler is a powerful tool that can help you determine how sections of your frame utilize the GPU, and give you direction to optimize the rendering of your application. Once you have captured a frame, the Range Profiler displays your frame broken down into a collection of ranges, or groups of contiguous actions. For each action, you can see the GPU execution times for each, as well as detailed GPU hardware statistics across all of the units in the GPU.
The Range Profiler also includes unmatched data mining capabilities that allow you to group calls in the frame into ranges based on various criteria that you choose.
The Range Profiler is accessed via the Frame Debugger. For steps on setting this up, see debugging your graphics project.

NOTE: Under certain conditions, the Range Profiler pane may be disabled and display one of the following messages.
Hardware signals are not supported in this configurationThis message could be due to one of the following reasons:
- You are running NVIDIA Nsight Graphics with a Kepler or lower GPU.
- You are using a defunct or non-NVIDIA GPU.
- You are attempting to profile a debug build of the project.
No hardware signals found for this API/GPU combinationThis message is likely to occur when you are running NVIDIA Nsight Graphics on a non-MSHybrid laptop.
What to Profile?
The first step for improving performance in a GPU bound application is to determine where you are spending GPU time in the rendering of the scene. This can be accomplished a number of ways using the Frame Debugger. First, adjust the scaling of the Scrubber to be based on GPU time.
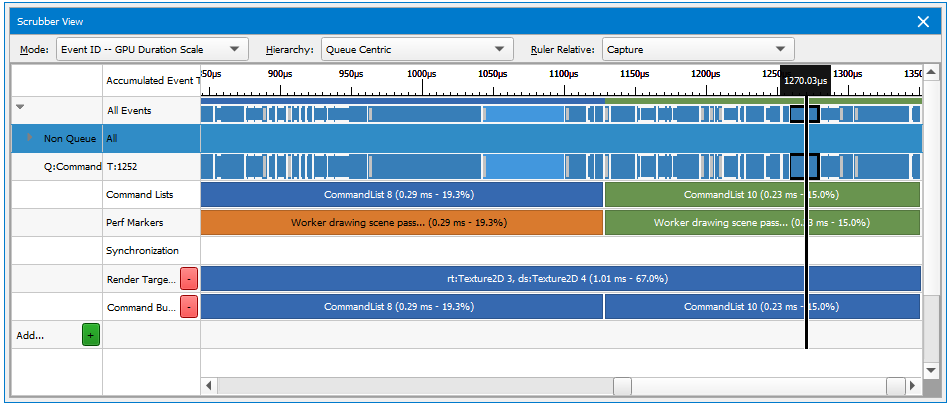
This will allow you to see at a glance where the time is being spent on the frame. These ranges will show up in the Scrubber, also scaled by the amount of time the work executed within them takes. Finally, if you haven’t added debug ranges, you can use various criteria to create them on the fly in your debugging session, including render target sets, shader programs in use, etc.
Look for ranges that seem larger than expected, given what you are trying to accomplish in that section of the frame. Also, larger ranges/draw calls likely have more headroom for improvement, so they can be good places to start deeper investigation.
You can also see how much GPU time is spent on various actions and ranges in the Events View. By sorting by GPU Time, you can quickly find the most expensive parts of the frame and begin your analysis from there.
Opening the Range Profiler
Once you find an area you are interested in profiling, use the right mouse button context menu to initiate the Range Profiler. This will open up the profiler focused on the range or call you determined to be interesting. (Alternatively, you can open the Range Profiler through Frame Debugger > Range Profiler.)
Once you have opened the Range Profiler, you will notice that the calls and ranges are scaled by GPU time, similar to the Scrubber.
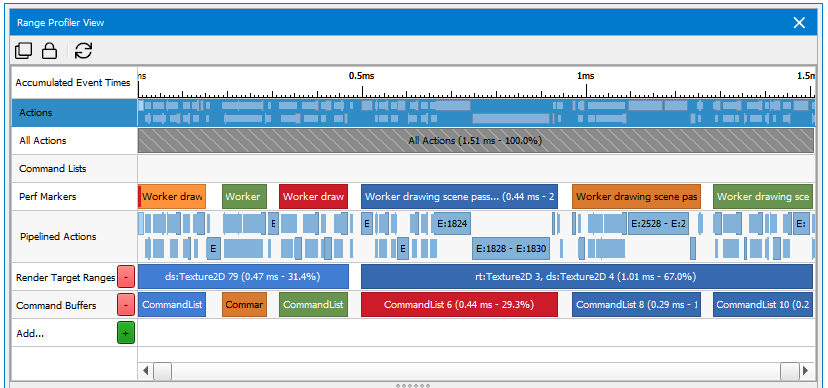
Like the Scrubber, you can use the Range Selector to find interesting sections in the scene to profile, as well as drill into a currently selected range.
The default view will show ranges based on the performance markers you have defined in your application. These can be done via the NVTX library, KHR_debug, or any other range definition API supported by your graphics API of choice. Clicking the Add... button will open a dialog that allows you to select what type of range you want to add.
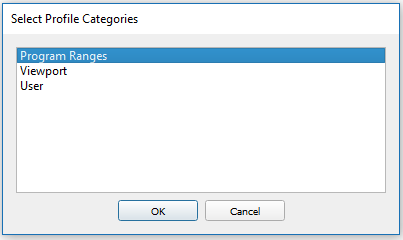
- Program ranges — Actions that use the same shader program.
- Viewport ranges — Actions that render to the same viewport rectangle.
- User ranges — A range defined by you on the fly. Use SHIFT + left-click and drag the scrubber on the created "User" row to create a new range. This can be helpful to drill into a section of the scene, or to compare different frame sections that don’t already have ranges defined for it.
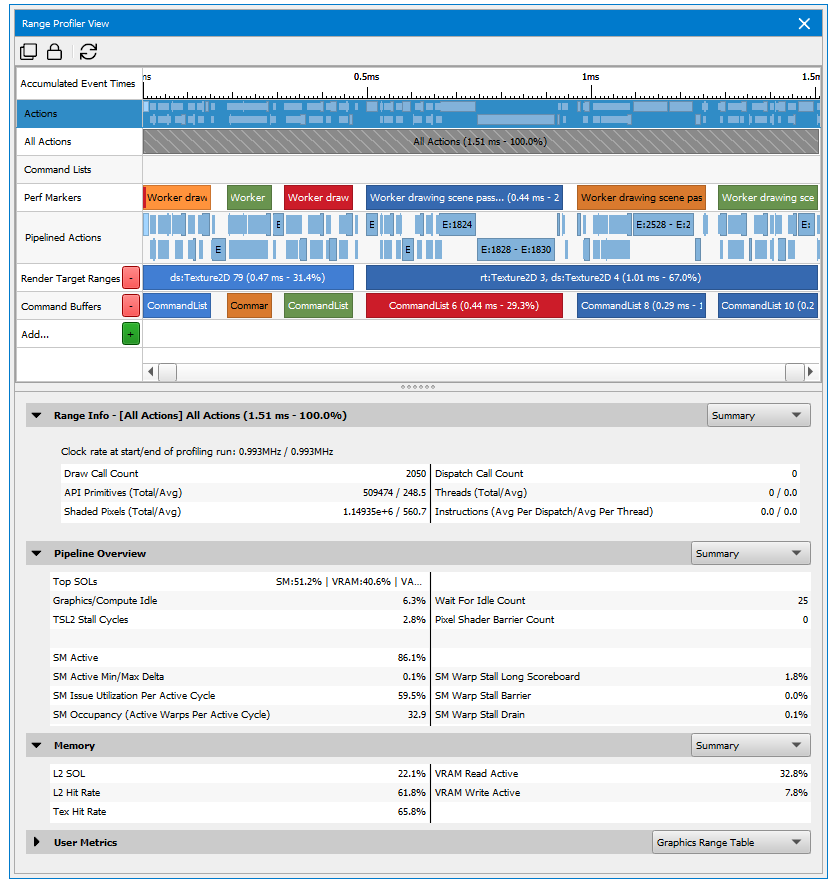
When you click on a range on the Scrubber portion, the other sections of the Range Profiler View will automatically update with that selected range's information. You can also click on a single action in the Scrubber to profile only that action.
Range Profiler Sections
The Range Profiler is split up into 3 sections: Range Info, Pipeline, and Memory. Each of these sections has a combo box on the right side of the section header that allows you to choose the different visualizations available for displaying the data: Summary, Range Diagram, Range Table, Timeline, Action Table, and Action Chart (depending on the section). These will be explained further in the corresponding sections below.
Range Info
The Range Info section gives you basic information about the selected range, split up with the draw calls on the left-hand side, and the compute dispatches on the right-hand side. For the draw calls, there is the number of calls in the range as well as the number of primitives and pixels rendered, both total and average per draw call. On the compute side, there is similarly the number of calls, as well as thread and instruction counts, both total and average.
The combo box in this section has 5 entries: Summary, Action Table, Timeline, Range Chart, and Action Chart. The Action Table shows all of the values in the Summary, but in a table format and measured per action. The Timeline show a graph of the GPU time for each action (draw call or dispatch) in the selected range. This will look similar to the Range Selector, but narrowed down to actions in the currently selected range. The Range and Action Charts allow you to take any 4 values and show them in a graphical chart display. The Range version shows a single value per metric for the current range, and the Action version shows the value measured for each action in the selected range.
Pipeline
The Pipeline section gives an overview of how the selected ranges utilized the GPU. It does this by calculating two metrics for each of the units in the GPU pipeline: Speed of Light (or SOL) and Busy percentages.
Speed of Light (SOL): This metric gives an idea of how close the workload came to the maximum throughput of one of the sub-units of the GPU unit in question. The idea is that, for the given amount of time the workload was in the GPU, there is a maximum amount of work that could be done in that unit. These values can include attributes fetched, fragments rasterized, pixels blended, etc. Any value less than 100% indicates that the unit did not process the maximum amount of work possible.
Busy: The busy value gives an idea of what percentage of time the given unit was actively working. While waiting for work to come down the pipeline, or after the work is processed, the unit may be idle, resulting in a busy value less than 100%.
The general rule when looking at GPU performance is to look for units that have a low SOL (work not being performed at peak efficiency) and a medium to high Busy percentage (a lot of work to do). In this case, you will want to look at the work being done to see if it can be accomplished more efficiently. Examples of this on the shader unit can be time spent waiting for memory or the texture unit to return, or overall low occupancy because of a higher local memory or register usage. Another case would be low SOL and low Busy. In this situation, the unit was not busy so it doesn’t matter as much if the work was done as efficiently as possible. In fact, the workload may not have been sufficient to fully populate that GPU sub-unit. Finally, a high SOL with a high Busy should be viewed a little differently. Unlike the first case, the task is not to make the unit more efficient, since the work was done very efficiently. In this instance, you want to try to reduce the amount of work being done, in order to increase overall pipeline throughput.
The Pipeline section has 4 visualization settings.
- Summary: This shows the 4 GPU sub-units for the selected range with the lowest Speed of Light values. This gives a quick idea of where the opportunities for optimization may be.
- Range Diagram: The Range Diagram shows all GPU sub-units, laid out in pipeline order, with an indicator of the inefficiency factor. If the factor gets over 70%, there will be a yellow outline on the unit, and a red one will appear of the factor gets over 90%.
- Range Table: This table puts profiler values for the range in a spreadsheet layout, including all of the constituent metrics for values like the inefficiency factors.
- Action Table: Similar to the Range Table, this visualization shows the same values, but measured per draw call and dispatch. This can be helpful to dig from the range into the calls that make it up, looking at the details of the call and how it utilizes the various units of the GPU.
Memory
The Memory section displays information about the L2 cache and Frame Buffer or memory unit. Each interface has a maximum throughput for a given amount of time. The memory section shows the percentage of the subsystem interfaces utilized for the current range.
The Memory section has 4 visualization settings.
- Summary: The summary focuses on the L2 cache, since L2 utilization and cache hit percentage are important for many of the units in the GPU. Memory localization, especially in the shader and texture units, are essential for reducing latency. Reading from and writing to the memory subsystem, for either making shader calculations or blending fragment values into the frame buffer, consumes this limited resource.
- Range Diagram: The range diagram shows all the GPU units that consume memory, how they are connected to each other in the unit-cache-frame buffer hierarchy, and the percentage utilized of each interface. The L2 unit also has the hit rate overlaid.
- Range Table: Like the range table in the Pipeline section, this displays a spreadsheet with all values in tabular form.
- Action Table: The action table section measures and displays the interface utilization for every draw call and dispatch in the range. This can be used to look for particularly inefficient users of the L2 cache, for instance.
Range Profiler Cookbook
Is my program CPU or GPU bound?
Try hotkey experiments such as minimum geometry and null scissor, to determine if you are GPU bound.
What are the most expensive draw calls in my application?
Capture a frame, and then run the Range Profiler. Once the Range Profiler is done running experiments, the entire scene will be selected by default. This will allow you to see details about all of the draw calls and dispatches in the scene. If you select Action Details in the Range Info section, you will see details on each draw call, including the execution time. Sort the table to time to see the most expensive draw call.
How can I optimize a range of draw calls?
In the Pipeline section, select Range Details and you will see an image with a virtual GPU pipeline. The red bars indicate units in the GPU that are not being used as efficiently as they could, so look for the higher bars to indicate where you need to spend time optimizing. (See below for specific tips on optimizing your API inputs for a particular unit).
How do I see collections of draw calls which share common state (like pixel shaders and vertex shaders)?
The Range Profiler contains a powerful grouping capability that allows you make new ranges based on common state. These include ranges based on program/shaders being used, viewport, render targets, and even user ranges that can be declared on the fly.
How do I profile draw calls which are in a specific performance marker?
The scrubber at the top of the Range Profiler View shows all of the performance marker ranges defined by the application, along with the amount of time spent for each one. A good strategy would be to look for ranges with a large amount of time, then drill down to where you see a large amount of time being spent. Once you click on that range, you can look at the Pipeline section for details on how that selected range is utilizing the GPU.
Why does my application run at a different frame rate under NVIDIA Nsight Graphics?
The NVIDIA Nsight Graphics Frame Debugger disables VSYNC, so applications that have VSYNC enabled under normal circumstances may see a higher frame rate when the same application is run under the Frame Debugger. NVIDIA Nsight Graphics also has a small performance overhead, which may reduce the frame rate slightly.

NVIDIA® Nsight Graphics Documentation Rev. 2018.4.180813 ©2018. NVIDIA Corporation. All Rights Reserved.