Introduction to NVIDIA Nsight Graphics
Nsight Graphics™ is a standalone application for the debugging, profiling, and analysis of graphics applications. Nsight Graphics supports applications built with DirectCompute, Direct3D (11, 12), OpenGL, Vulkan, Oculus SDK, and OpenVR.
This documentation is separated up into different sections to help you understand how to get started using the software, understand activities, and offer a reference on the user interface.
-
Getting Started - Offers a brief introduction on how to use the tools.
-
Activities - Nsight Graphics Supports multiple activities to target your workload to the need of your work at a particular point in time. This section documents each of these activities in detail.
-
User Interface Reference - Provides a deep view of all of the user interface elements and views that Nsight Graphics offers.
-
Appendix - Contains a selection of topics on concerns not covered by any other section.
Getting Started
This section describes an approach to using the Nsight Graphics tools.
Expected Workflow
When debugging or profiling, it is important to narrow your investigation to the path that provides the most impactful and actionable data for you to make conclusions and solve problems. Nsight Graphics provides a number of tools to fit each of these workflow scenarios.
When debugging a rendering problem, Nsight Graphics's Frame Debugger is the tool of choice. This tool enables the inspection of events, API state, resource values, and dependencies to understand where your application might have issues. For more information on the Frame Debugger, see Frame Debugger.
When profiling a graphical application, the first step is to determine if you are CPU or GPU bound. If you are CPU bound, you will not be able to issue enough work to the GPU to take full advantage of its full processing power. If you are GPU bound, the GPU is not able to process the work it is issued fast enough and your engine may stall. One way of making the determination of which aspect is limiting you is to use Nsight Systems™. Nsight Systems is a system-wide performance analysis tool designed to visualize an application’s algorithms, help you select the largest opportunities to optimize, and tune to scale efficiently across any quantity of CPUs and GPUs in your computer. NVIDIA also provides a system analysis and trace tool within Nsight Visual Studio Edition; for more information on that tool see this site.
If you have determined that you are CPU bound, you will want to use a CPU profiling tool to discover how you can eliminate inefficiencies to issue work faster to the GPU. You may also want to look into the overhead of the API constructs you are using and determine if there are more lighter weight constructs that can offer the same effect at less cost. The Frame Debugger tool is an excellent resource while you are making these adjustments to your engine.
When GPU bound, you will want to determine where and how you are limited by the GPU. Nsight Graphics 's profiling tools can offer you this information. For a quick, high-level evaluation of your GPU performance, the real-time frame performance graphs that Nsight Graphics provides can offer you a continuous look at your performance as you navigate your scene. For a detailed, per-range analysis of your GPU performance, you can use the Range Profiler to gather this information. This analysis can help you to determine whether you need to optimize your shaders, render target and texture usage, or memory configuration.
The GPU Trace activity within Nsight Graphics allows for analysis of a few different GPU bound scenarios. GPU Trace offers a deep analysis of your SM's performance by tracing the execution of your shaders on the SM across a series of frames. Another key technique in optimizing performance is to take advantage of the GPUs ability to process parallel work by using techniques to achieve simultaneous compute and graphics (SCG), also known as async compute. GPU Trace allows you to both see opportunities for async compute as well as to confirm and measure the impact of async compute on your frame.
How to Launch and Connect to Your Application
To analyze an application, Nsight Graphics requires the launching of applications through its launching facilities. The sections below describe creating a project, launching the application, and connecting to it so that you can perform your analysis.
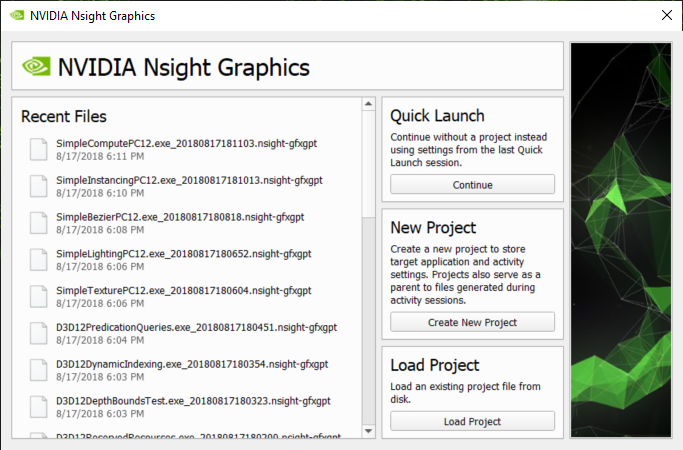
Upon starting Nsight Graphics, you are presented with the option to create a project. If you are using Nsight Graphics for the first time, skip project creation by selecting continue under Quick Launch.
Once selected, you will be presented with a target-specific dialog that allows you to configure the application to launch. Browse and select the activity you wish to run and then proceed to the target-specific instructions below to configure the application to analyze.
The target-specific sections below describe how to launch and connect on each specific platform. While the process may be different on different targets, there are many commonalities between all systems. In particular, once a process is launched, the Nsight host must attach to that process in order to analyze it. This logical separation of launch and attach facilities allows for complex use cases including remote targets, launching though command lines, reattaching to previous sessions, etc. The Nsight host does simplify many common cases, however, by supporting user-controlled automatic connection to processes that were just launched. The sections below cover these uses cases and more, in turn.
Process Launch and Connection on Windows Targets
Launching an Application with Automatic Attach
Nsight Graphics supports automatic attach to processes of interest. It accomplishes this by identifying the processes in a process hierarchy that perform graphics work, signaling that these are of interest.
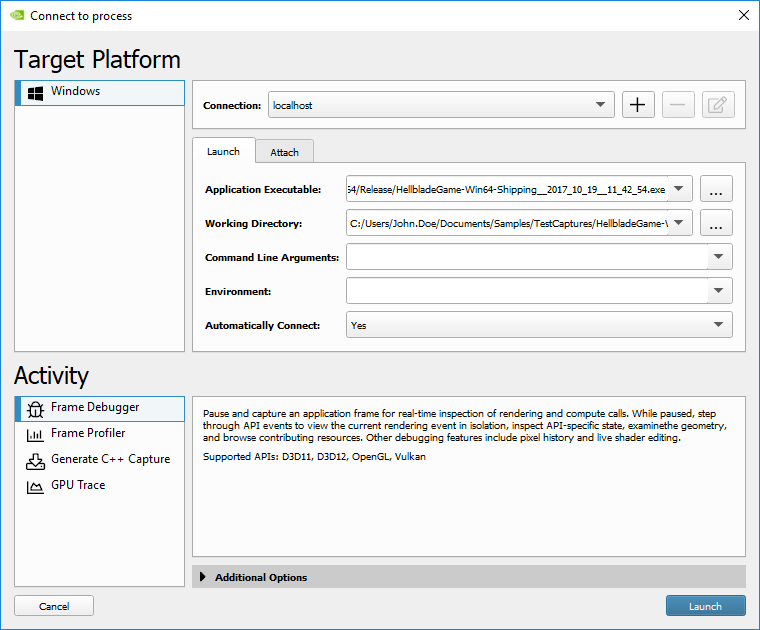
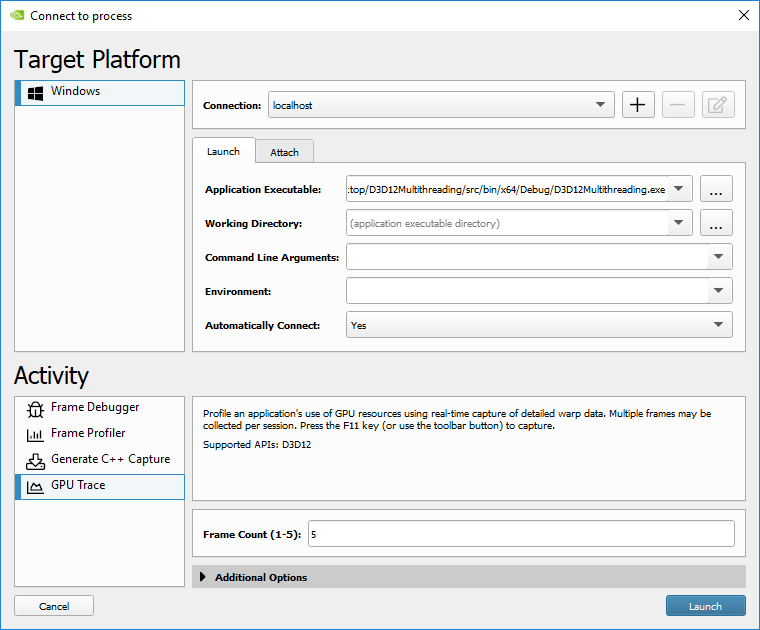
To launch your application, perform the following steps.
- Set the application executable to the path of your application. This path may be any executable or batch file.
- If your application requires a working directory that is different from your application's directory, adjust it now.
- Adjust the environment (if necessary).
- Leave Automatically Connect as Yes.
- Click Launch.
Once launched, you will be presented with a dialog that notes the launching and attaching of your application. After the launch completes, you are ready to begin your analysis.
Connecting to an Application with Manual Attach
There may be some cases where a manual attach to an application is desired. These situations include:
- Using the command line launcher to launch applications (see Process Launch from a Command Line)
- Automatic attach is attaching to an application other than the one you want
- Connecting to an application that has previously been detached and reattach to the analysis session is desired
If the application is already launched, perform the following steps:
- Click the Connect button.
- Select the Attach tab.
- Select the application you wish to analyze in the attach tab and click Attach.
After the launch completes you are ready to begin your analysis.
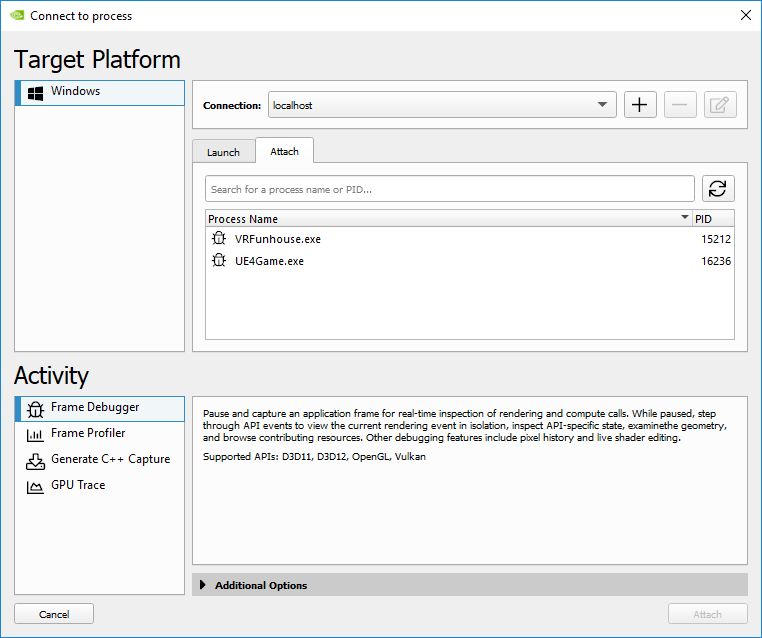
In the example image above, VRFunhouse.exe is a child process of the UE4Game.exe launcher. Selecting VRFunhouse.exe and clicking Attach would allow you to analyze the primary application.
Remote Launching
Remote debugging is supported on Nsight Graphics on Windows through use of the Nsight Remote Monitor. This is a process that runs on a target machine to allow connections to be started on that machine.
To run the remote monitor, install Nsight Graphics on the target machine. Then, launch the remote monitor on that machine by Start > NVIDIA Corporation > Nsight Remote Monitor.
Once the monitor is launched on the remote machine, you need to add the remote monitor as a connection in Nsight Graphics. By default, launches will be done on the localhost machine. To add another machine, click the + button.

This brings up a dialog in which you can add a machine name or IP address.
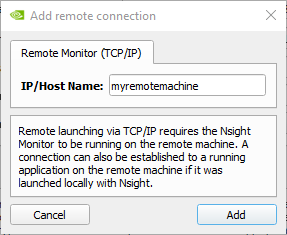
Enter the machine name in IP/Host Name. Click Add to add the connection. The machine you just added will be listed as the target connection at this time.

Any number of connections may be added; connections can be removed by clicking - on the selected connection. The connections may be switched between any of the added connections before launch or attach. Connections are globally persisted and may be applied to any project once they are added.
Process Launch and Connection on Linux Targets
Remote debugging on Linux is supported through SSH connections. Enter your SSH information when establishing the connection to connect to the target machine.
Process Launch from a Command Line
Nsight Graphics offers a command line interface (CLI) to facilitate launching on applications for which the environment setup can be complex to transfer to the host application. Currently it also provides a non-interactive way to Generate C++ Capture from a Command Line or Generate GPU Trace Capture from a Command Line).
This executable is located in the host application folder:
Windows
<install directory>/host/windows-desktop-nomad-x64/ngfx.exe
Linux
<install directory>/host/linux-desktop-nomad-x64/ngfx.bin
CLI Arguments Details
To understand how to launch, start by launching the CLI with the --help argument. This will display what a general options the CLI has.
Several of these arguments are optional, while some are required. The full argument list is the following:
| Option | Description |
|---|---|
|
--help |
Display all available general arguments. |
|
--help-all |
Display all available arguments, including all activity specific arguments. |
|
--activity arg |
Select the target activity to use. This argument is always required. Note: "activity name" must be exact name in "Activity" section of connection dialog. The available activity names can also be found in the help message (--help). |
|
--platform arg |
Select the target platform to use. This argument is recommended to be set, otherwise it'll use the local platform as a default. Note: "platform name" must be exact name in "Target Platform" section of connection dialog. The available platform names can also be found in the help message (--help). |
|
--hostname arg |
Select the device on which to launch the application. Default value is "localhost". This argument is required if trying to launch application in a machine with nv-nsight-remote-monitor running. |
|
--exe arg |
Set the executable path on target device. NOTE: This argument is usually required, but can be implicitly deduced from project settings if a project has been loaded (see --project). |
|
--dir arg |
Set the working directory of the application to be launched. |
|
--env arg |
Set the additional environments of the application to be launched. These arguments should be in the form of "FOO=1; BAR=0;". |
|
--args arg |
Set the arguments passed to the application to be launched. |
|
--project arg |
Select an Nsight Graphics project to load. If a project has been successfully loaded, some arguments (e.g., --exe) can be implicitly deduced from the loaded project settings if they are not specified. If there's a dedicated project for a certain application, and there are changed and saved options for adjusting the activity, it is preferred to run the CLI with this argument. |
|
--output-dir arg |
Set output folder to export/write data to. If not specified, it'll use the default document folder on Nsight Graphics GUI |
|
--verbose |
Enable verbose mode to display more messages. |
|
--no-timeout |
By default operations (e.g., launch) are bound to proper timeouts, disable timeouts if some applications can take a long time to perform operations. NOTE: This argument is not used for simply launching the target application. |
|
--launch-detached |
Run the CLI as a command line launcher; the CLI exits after launching the target application. You may attach to the application with the Nsight Host after it has been launched. |
There are also activity-specific options beyond the general options above. For examples on launching with a specific activity, as well as referencing these activity specific options, see the follow sections:
- Generate C++ Capture activity options (see Generate C++ Capture from a Command Line)
- GPU Trace activity options (see Generate GPU Trace Capture from a Command Line)
If you wish to simply launch an application, without automatically performing a capture, the CLI can launch an application with commands in the form of the below command.
ngfx.exe --launch-detached [general_options]
Examples:
ngfx.exe --activity="Frame Profiler" --platform="Windows"
--project="D:\Projects\Bloom.ngfx-proj" --launch-detached
Launch an application in the local host, with using the launch options and activity options read from a Nsight Graphics project.
ngfx.exe --activity="Frame Debugger" --platform="Windows"
--hostname=192.168.1.10 --exe=D:\Bloom\bloom.exe --launch-detached
Launch an application on a remote machine.
Using Nsight Graphics With WebGL
Nsight Graphics has the ability to debug and profile WebGL applications running in a browser. However, there are some setup steps that must be taken to ensure compatiblity and provide as much API contextual information as possible. This is important because many browsers, especially on Microsoft Windows, will use graphics APIs other than OpenGL for the backend rendering. Because of this, when you attempt to debug your application, you may see some DirectX calls that won't map easily to the WebGL calls you originally made. Using the correct settings can force an OpenGL backend, which will look more similar to what you are expecting and aid in debugability.
To get started, make sure you close out all browser windows. This is necessary due to the method that Nsight Graphics uses for injecting code into your application. Specifically, Chrome will tend to launch a child process from one of the other, already running processes. If that initial process is not injected, then the child process will not be either, even if you launched it from the Nsight Graphics Connection dialog. So, close out any browser windows and use Task Manager to ensure that no Google Chrome processes (or other browser processes) remain.
Next, you will want to set the browser to use the OpenGL backend. In Chrome, you need to:
- Type chrome://flags/ in the address bar to bring up the settings
- Search the settings for OpenGL
- For the ANGLE graphics backend, choose OpenGL
Finally, browsers typically need additional settings to ensure tool compatibility. For Google Chrome, you need so specify the following additional command line options when launching the browser:
| Option | Description |
|---|---|
|
--no-sandbox |
Disable some of the Chrome security checks to allow process injection to work. |
|
--disable-gpu-watchdog |
Disable the Chrome GPU activity check. This allows for the application to be paused live and not have Chrome exit. |
|
--gpu-startup-dialog |
Optional: This flag will cause a dialog to display on launch of the graphics process, to help find the process you want to debug. Note that Nsight Graphics can typically find the process without resorting to manual intervention. |
Automatic Cleanup of Launcher Processes
There are some processes that have the potential of interfering with the launch of an analysis session of your application. These processes are typically long-lived application launchers – they often perform a coordinated launch between child process and the parent launcher. In some cases, this coordinated launch can interfere the process by which Nsight Graphics injects itself with the approach analysis settings.
To mitigate this problem, Nsight Graphics attempts to detect processes that are known to interfere and to offer the user an opportunity (dialog shown below) to terminate the processes before launch, thereby allowing a launch without interference.
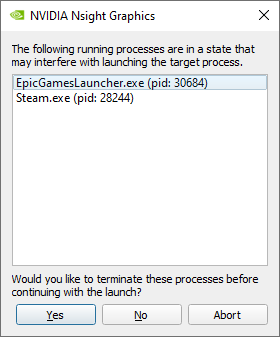
The buttons on the dialog perform the following actions:
- Yes - terminate the processes and continue launching
- No - do not terminate the processes, but continue to launch the application
- Abort - cancel the launch entirely
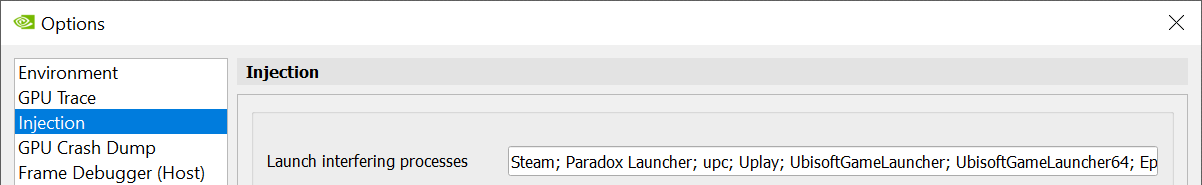
To edit the list of processes that are detected, add an entry to the list in Tools > Options > Injection.
After a Process is Connected
After a process is connected, it is ready to be analyzed. For many activities, a default set of windows will come up that offer an impactful set of tools for analysis that pertains to the activity. You can also add additional windows to the application by selecting a view from the menu bar. See the User Interface Reference for a detailed discussion of each view and tool window.
For the Frame Debugger activity that was started above, there are both live analysis and capture utilities. When capturing from this activity, done though the Target application capture hotkey or "Capture for Live Analysis", a number of views will open. On the target application, the HUD will appear with the toolbar and scrubber. This UI allows you to view an exhaustive amount of information on the state, resources, and synchronization of your application.
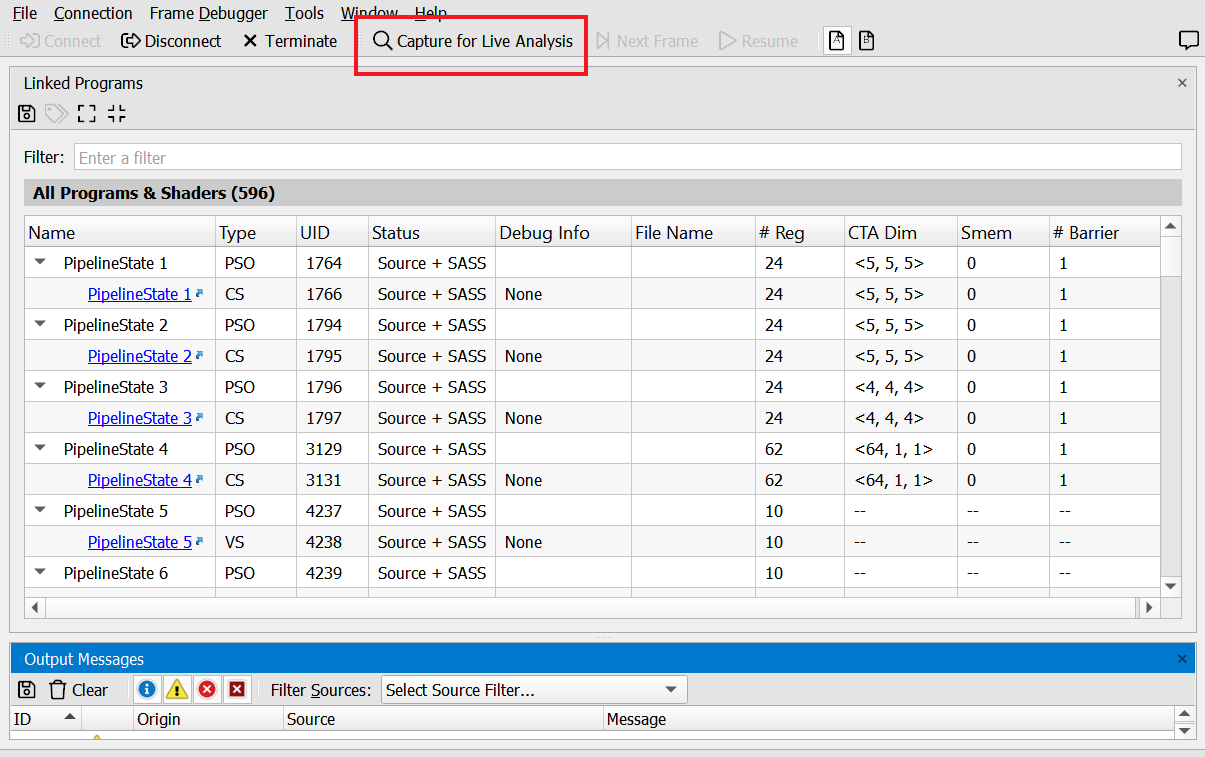
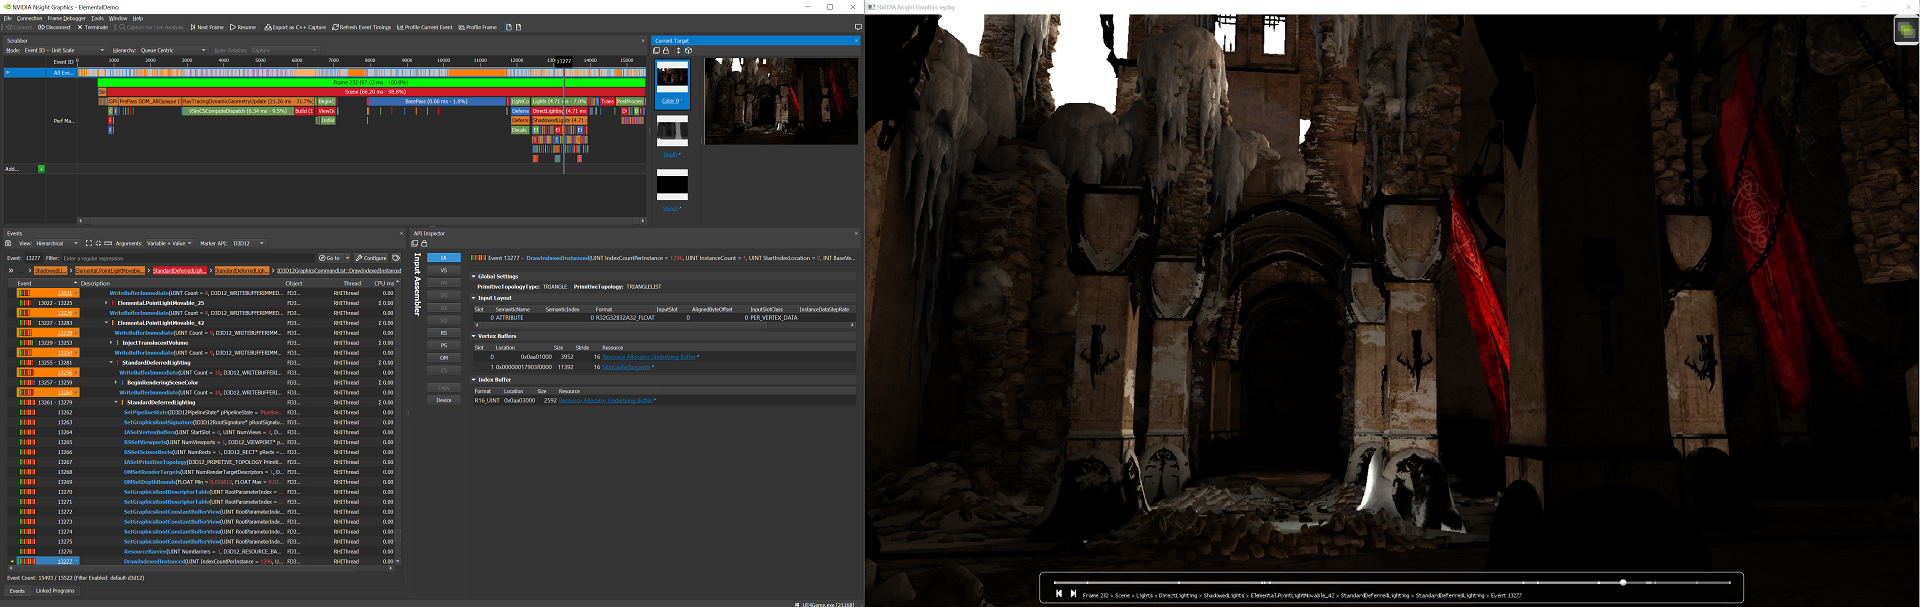
With such an expansive set of information available, debugging a rendering problem is made easier.
Choose Window To Debug
If your application has multiple windows, each with a graphics context, you can choose the window that you want to focus your debugging and profiling efforts on. For instance, if your application has 3 different windows, each with it's own view of the scene, you can easily select the window of interest to capture. When multiple windows are detected, there will be a new "Select Window" control on the top toolbar. The combo box to the right will be populated with the detected windows, including the window name and size to aid in determing the correct window.
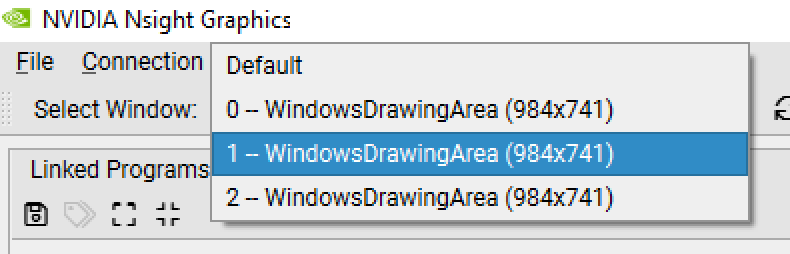
Any time that you are not currently in an active Capture/Replay, you can use the control to specify the window to capture. If you select "Default", the most recent window to present the back buffer will be selected as the window to capture. This option is available with the Frame Debugger, Frame Profiler, and Generate C++ Capture activities.
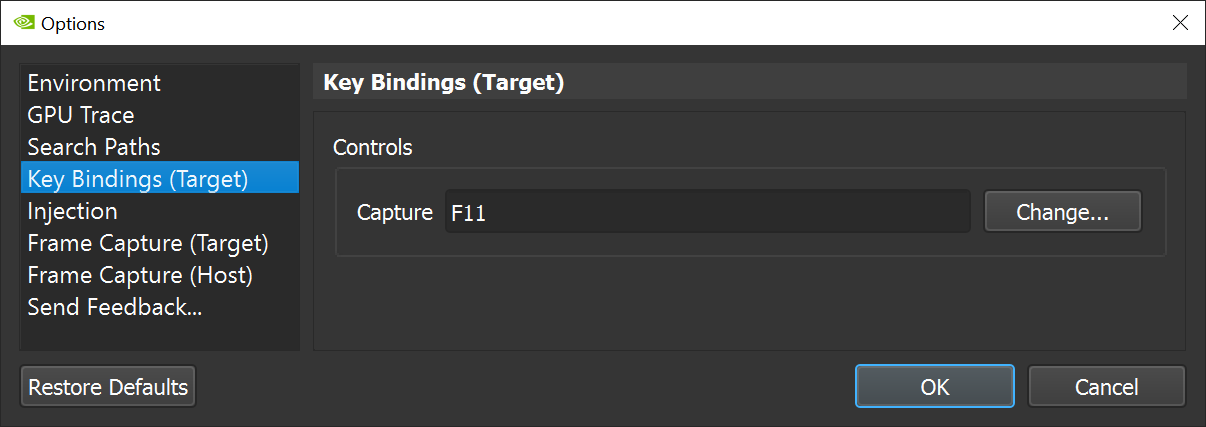
Target application capture hotkey
Activities support triggering capture from the Nsight Graphics UI or directly from the target application. The default capture hotkey is F11. This may be configured also in Tools > Options.
Configuring Your Application for Optimal Analysis
In order for your application to work well with the analysis tools provided by Nsight Graphics, there are a number of details you should consider when configuring your application.
Using Performance Markers
Performance markers are integral to nearly all workflows. We recommend that your application always run with perf markers when running under tools analysis.
Performance markers are most commonly used to delineate sections of events and note where in your application they begin and end. They can also be nested to show sub-sections of events. Perf markers are generally used to measure the amount of time that an inner portion of algorithm will take.
There are multiple different types of perf markers that are supported in Nsight Graphics:
-
D3D9 perf markers are supported for all D3D applications.
-
ID3DUserDefinedAnnotation may be used for D3D11 or D3D12 applications. See ID3DUserDefinedAnnotation interface on MSDN.
-
Perf markers made available by Microsoft's PIXBeginEvent/PixEndEvent APIs are supported for D3D12. See https://devblogs.microsoft.com/pix/winpixeventruntime/.
-
Vulkan applications may use either VK_EXT_debug_utils or VK_EXT_debug_marker.
-
OpenGL applications use the KHR_debug group, glPushDebugGroup and glPopDebugGroup.
-
The NVTX tools extension library provides API-agnostic perf markers and may be used with all applications.
Shader Compilation
Nsight Graphics works best when you have the full shader source available for debugging. Follow the steps below to set up your application for optimal configuration.
D3D Configuration
Nsight Graphics works best with access to the original HLSL source code of your shaders. There are a few ways to accomplish this task. The first is to precompile the shaders into binary format using the using one of the legacy D3DCompile functions or the latest IDxcCompiler interfaces and saving the results out to a file.
Alternatively, you can use the offline compiler, fxc.exe or dxc.exe, provided by the DirectX SDK.
For each of these methods, you need to specify some flags in order for the HLSL debug information to be embedded in the binary output, outlined below:
Compile type Required action D3DCompile, D3DCompile2, D3DCompileFromFile
Add the D3DCOMPILE_DEBUG flag to the Flags1 parameter
IDxcCompiler::Compile, IDxcCompiler2::Compile
Add "-Zi" option to the pArguments parameter to get full debug info, such as linetable info required for shader profiling.
For dynamic shader editing, you can retrieve a minimal set of debug info using the "-Zs" option to the pArguments parameter when using a newer compiler (April 2021 or later).
Shaders compiled offline from dxc.exe or fxc.exe
Add -Zi flag to command line to get full debug info, such as linetable info required for shader profiling.
For dynamic shader editing, you can retrieve a minimal set of debug info using the -Zs option when using a newer compiler (April 2021 or later).
Nsight Graphics also supports reading debug info from files that have been generated using the dxc.exe -Fd option. To load these external files, the user will need to set the appropriate path(s) in the Compiled Shader Symbol Paths section of the Search Paths
Vulkan Configuration
Nsight Graphics works best with access to the original high-level source code of your shaders. To accomplish this, shaders need to be compiled with debug information in order for the original high-level source code to be embedded in the SPIR-V binary modules.
When using the glslangValidator tool, add -g flag to the shader compilation command line. For example:
glslangValidator -V shader.vert -o shader.spv -g
When using the dxc tool, add -Zi flag to the shader compilation command line. For example:
dxc -spirv -T ps_6_5 -E PSMain shader.frag -Fo shader.spv -Zi
Naming Objects and Threads
Many of Nsight Graphics's views and analysis benefits from naming API objects and threads. Similar to perf markers, these names can help offer increased context for your analysis. The tables below list the supported methods for naming objects and threads.
| API | Method |
|---|---|
|
D3D11 |
No programmatic method; use Nsight-generated names |
|
D3D12 |
|
|
OpenGL |
|
|
Vulkan |
vkDebugMarkerSetObjectNameEXT or vkSetDebugUtilsObjectNameEXT |
How To Setup and Inspect GPU Crash Dumps
This section describes how to use NVIDIA Nsight Aftermath Monitor to generate GPU crash dumps for applications using the Direct3D 12 or Vulkan API, and how to open and inspect those GPU crash dumps with the crash dump inspector plug-in in Nsight Graphics.
Workflow
The general workflow for working with Nsight Aftermath GPU crash dumps is to:
-
Run the NVIDIA Nsight Aftermath GPU Crash Dump Monitor.
-
Configure GPU crash dump features.
-
Optional: if you want to collect additional information via event markers or to enable source-level shader mappings, you can optionally instrument the graphics application with Aftermath Library.
-
Run the graphics application for which to capture GPU crash dumps and reproduce the crash/TDR, allowing the monitor to collect the crash dump.
-
Open the GPU crash dump in Nsight Graphics.
-
Configure GPU Crash Dump Inspector settings.
-
Inspect the crash dump data using the Nsight Graphics crash dump inspector.
See the sections below for details on each step of this process.
The GPU Crash Dump Monitor
The NVIDIA Nsight Aftermath Crash Dump Monitor provides the means to capture GPU crash dump files for GPU crashes or GPU hangs, and to modify the driver configuration settings related to crash dump generation.
Running the GPU Crash Dump Monitor
The NVIDIA Nsight Aftermath Monitor nv-aftermath-monitor.exe is installed to the Nsight Graphics host directory. Typically this is:
C:\Program Files\NVIDIA Corporation\NVIDIA Nsight Graphics 2021.3.0\host\windows-desktop-nomad-x64The crash dump monitor application will by default start in the background. Its user interface is accessible through the NVIDA Nsight Aftermath Monitor icon in the Microsoft Windows system notification area (system tray).
Configuring the GPU Crash Dump Monitor
All configuration options related to GPU crash dump creation are available through the GPU Crash Dump Monitor Settings dialog.
-
Set up directory where crash dump files are stored.
-
Set up directory where shader debug information files are stored.
-
Enable Aftermath GPU Crash Dump collection. Either set Aftermath mode to Global to enable crash dumps for all applications using the D3D12 or Vulkan API or selectively enable it for one or more applications by managing an application Whitelist.
-
Enable the desired Aftermath tracking features, like
-
Generate Shader Debug Information to generate shader debug information to map GPU addresses of active shader warps at the time of a crash to intermediate shader assembly lines or shader source lines.
-
Enable Resource Tracking to enable additional driver-side resource tracking to map GPU Virtual Addresses in page faults to still available or already released resources.
-
Enable Call Stack Capturing to enable additional driver-side tracking for draw calls, dispatches, or copies, including capturing call stacks. NOTE: As with other crash dumps, like Windows minidump files, when this feature is enabled the GPU crash dump file may contain the file path for the crashing applications executable as well as the file paths for all DLLs loaded by the application.
Modifying Aftermath settings requires Windows Administrator privileges. Therefore, when any of these settings are modified and applied, a User Account Control confirmation window may pop-up asking for permission to modify system settings.
-
The GPU Crash Dump Inspector
The NVIDIA Nsight Aftermath Crash Dump Inspector provides the means to open, inspect, and analyze GPU crash dump files created by the NVIDIA Nsight Aftermath Monitor.
Loading GPU Crash Dump Files
GPU crash dump files use the .nv-gpudmp file extension and can be loaded through File > Open File... This will bring up a GPU Crash Dump Inspector window displaying the crash dump file's content.
Configuring the GPU Crash Dump Inspector
In order to use all functionality provided by the GPU crash dump inspector, the following configuration settings should be made in the Search Paths Settings.
-
Add the directories where shader source files are stored to Shader Source Paths. If the shader sources cannot be found, the Shader View will not be able to display shader source.
-
Add the directories where binary shader files (DXIL or SPIR-V shader files) are stored to Pre-compiled Shader Paths. If the binary shaders cannot be found, the Shader View will not be able to display intermediate shader assembly code or shader source.
-
Add the directories where the shader debug info files (.lld or .pdb files generated by dxc.exe for instance) are stored to Compiled Shader Symbol Paths. If the shaders debug info cannot be found, the Shader View will not be able to map GPU addresses of Active Warps to intermediate shader assembly or shader source code.
-
Add the directories where the NVIDIA shader debug info files written by the GPU crash dump monitor are stored to Driver Shader Output Paths. If the NVIDIA shaders debug info cannot be found, the Shader View will not be able to map GPU addresses of Active Warps to intermediate shader assembly or shader source code.
-
Add the directories where to find the symbol files for the application for which the GPU crash dump has been captured to C++ Symbol Paths. This allows the Aftermath Marker Call Stack View to resolve addresses to functions and source locations.
Inspecting GPU Crash Dump Files
Use the GPU Crash Dump Inspector to analyze crash reasons. This is not an exhaustive tutorial on how to analyze GPU crash dumps, because every crash or hang is different, but it should provide some hints to get started.
After loading a crash dump file, it is usually a good start to check the Exception Summary on the Dump Info tab. This will show a high-level fault reason, e.g. whether the graphics device was hung or an error like a page fault has occurred.
In case of a hang it makes sense to check if there is an Active Warps section on the Dump Info tab showing shader activity. This could point towards an issue with very long running shader warps or shader warps being stuck in an infinite loop. In that case the Shader View may help to root cause the problem.
If the device state indicates there was a memory fault, the next step would be to look for a Page Fault section on the Dump Info tab. This may help to pin point problems with out-of-bounds resource access or accessing an already deleted resource.
If the application was instrumented with Aftermath Event markers, a Aftermath Markers section should be available on the Dump Info tab. This may help to pin point the draw or dispatch call that caused problems.
If Call Stack Capturing was enabled when capturing the GPU crash dump, Call Stack links should be available in the Aftermath Markers section, pointing to the draw, dispatch, or copy call that may be related to the problem.
Last, the GPU State section on the Dump Info tab may provide some hints about which parts of the graphics pipeline were active or have faulted when the crash occurred.
Instrumenting Applications With The Aftermath API
The NVIDIA Nsight Aftermath SDK provides the Aftermath API that can be used by developers to instrument their applications. The latest version can be downloaded from https://developer.nvidia.com/nsight-aftermath.
C:\Program Files\NVIDIA Corporation\NVIDIA Nsight Graphics 2021.3.0\SDKs\NsightAftermathSDK
Detailed information about the functionality provided by the library and how to use it in an application can be found in the Readme.md that comes with the SDK package and the header files.
Aftermath Event Markers
In D3D applications, the Aftermath event marker API (GFSDK_Aftermath_SetEventMarker) can be used to inject event markers with user defined data directly into the graphics command stream. If the application is instrumented with event markers, information about the last event markers that were processed by the GPU for each command stream will be captured into the GPU crash dump, including the user provided event data.
Similar functionality is available for Vulkan applications with the VK_NV_device_diagnostic_checkpoints extension.
Source Shader Debug Information
For mapping shader addresses to high-level shader source or intermediate language (IL) lines, shaders need to be compiled with debug information. This debug information must be available when analyzing crash dumps in Nsight Graphics to perform the mapping.
The generation of shader debug information needs to be enabled either through the Nsight Aftermath crash dump monitor settings or Aftermath feature flags when using the Nsight Aftermath SDK.
Furthermore, to allow shader source line mapping the high-level shader source needs to be compiled with debug information, too.
- Compile and use full shader blobs: Compile the shaders with debug
information. Use the full (i.e. not stripped) shader binary when running
the application and make it accessible to Nsight Graphics when inspecting
GPU crash dumps. For example:
dxc -Zi [..] -Fo shader.bin shader.hlsl - Compile and strip: Compile the shaders with debug information
then strip off the debug information. Use the stripped shader binary when
running the application and make both stripped and not stripped file
accessible to Nsight Graphics when inspecting GPU crash dumps.
dxc -Zi [..] -Fo full_shader.bin shader.hlsl dxc -dumpbin -Qstrip_debug -Fo shader.bin full_shader.bin - Compile with separate debug information: Compile the shaders with
debug information and instruct the compiler to store the meta data in a
separate shader debug information file. Make the shader binary and the
shader debug information file accessible to Nsight Graphics when
inspecting GPU crash dumps.
dxc -Zi [..] -Fo shader.bin -Fd debugInfo\ shader.hlsl
Note, no source-level shader mapping is supported for shaders compiled with the legacy Microsoft DirectX fxc.exe shader compiler.
glslangValidator -V -g -o ./full/shader.spv shader.vert
Samples
Nsight Graphics ships with a selection of samples that can help you understand how to use the tool. To access these samples, select Help > Samples and choose a sample to open. Upon selection, a sample project will be created and the connection dialog will come up, allowing you to work with and example the sample. Some samples also include example reports for you to study.
Note that samples are also an effective tool for disambiguating Nsight Graphics problems from system problems. If the samples do not run for you without issue, there is likely a system problem that needs diagnosing.
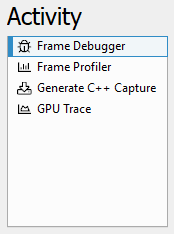
Activities
Nsight Graphics Supports multiple activities to target your workload to the need of your work at a particular point in your development process.
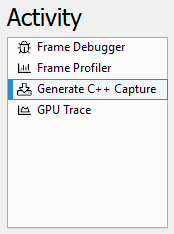
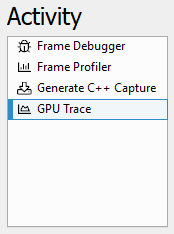
-
Frame Debugger - allows you debug a frame by each draw call. You can view vertex shaders, pixel shaders, and pipeline states.
-
Frame Profiler - provides a deep analysis of the performance of your application. Several features are provided to analyze.
-
Generate C++ Capture - The C++ Capture activity allows you to export an application frame as C++ code to be compiled and run as a self-contained application for later analysis, debugging, profiling, regression testing, and edit-and-compile experimentation a frame by each draw call. You can view vertex shaders, pixel shaders, and pipeline states.
-
GPU Trace - supports the analysis of SM workloads.
Frame Debugger
The Frame Debugger activity allows for:
-
Real-time examination of rendering calls;
-
Interactive examination of GPU pipeline state, including visualization of bound textures, geometry and unordered access views;
-
Pixel History shows all operations that affect a given pixel;
-
Range Profiler identifies performance bottlenecks and GPU utilization;
-
C++ Capture exports for offline collaboration and analysis.
When to use the Frame Debugger Activity
The Frame Debugger activity offers a comprehensive set of tools for discovering problems with your application's rendering or general operation. This activity enables the inspection of events, API state, resource values, and dependencies to understand where your application might have issues. Use this activity when:
The Frame Debugger activity supports all APIs that are generally supported by Nsight Graphics.
Basic Workflow
To start this activity, select Frame Debugger from the connection dialog.
The basic workflow for the Frame Debugger activity is to capture an application and then navigate the events, data, and resources that your application is submitting/using to identify your issue.
Whether you are debugging on the CPU or GPU, the first step of any debugging process is to narrow in on the set of data that you need to analyze to understand your problem. Generally, this means that you will want to scrub to a particular event of interest in either the Scrubber or the Event Viewer. Because Nsight Graphics™ will show you the rendering contribution of every draw call, looking at either the HUD or the Current Target View will give you an indication of where your rendering might be going wrong. Another alternative is to use the Pixel History experiment to automatically identify the draw calls that relate to a particular texture update.
From there, you will want to use your knowledge of the graphics pipeline to try to understand what might be causing a problem. Some questions to ask yourself:
-
Is this a geometry problem? If so, is it a pre-transform or post-transform problem?
-
Is this a blending problem?
-
Is this a synchronization problem?
In some cases, there may be a combination of problems that exacerbate a given problem. Isolating the symptoms can be challenging, but an effective use of the tools can offer increased confidence that you are heading in the right direction.
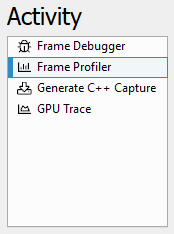
Frame Profiler
The Frame Profiler activity provides a powerful set of tools to assess the performance of your application from a multiplicity of angles. The Frame Profiler Activity allows for:
-
Optimizing the rendering of your application
-
Seeing detailed GPU utilization
-
Automatic determination of performance limiters
When to Use the Frame Profiling Activity
The profiling activity provides detailed performance information for all units of the GPU. Use this activity when:
-
You know that your application is GPU bound.
-
You want to determine whether you are SM bound.
-
You want to explore the performance of a functional unit of the GPU.
The profiling activity currently supports profiling D3D11, D3D12, and OpenGL applications.
Basic Workflow
To start this activity, select Frame Profiler from the connection dialog.
This activity allows for detailed frame profiling and analysis once captured.
Detailed Frame Analysis
Profiling is supported by a similar capture workflow as discussed in the Frame Debugger activity. Once you have captured your application, several views come up by default that are targeted at providing the information you need to understand your applications performance on the GPU. Several views interact to make this possible, including action timings in the Event Viewer, a graphical display of the timings in the Scrubber, and a detailed breakdown of each of your application's workflows in the Range Profiler.
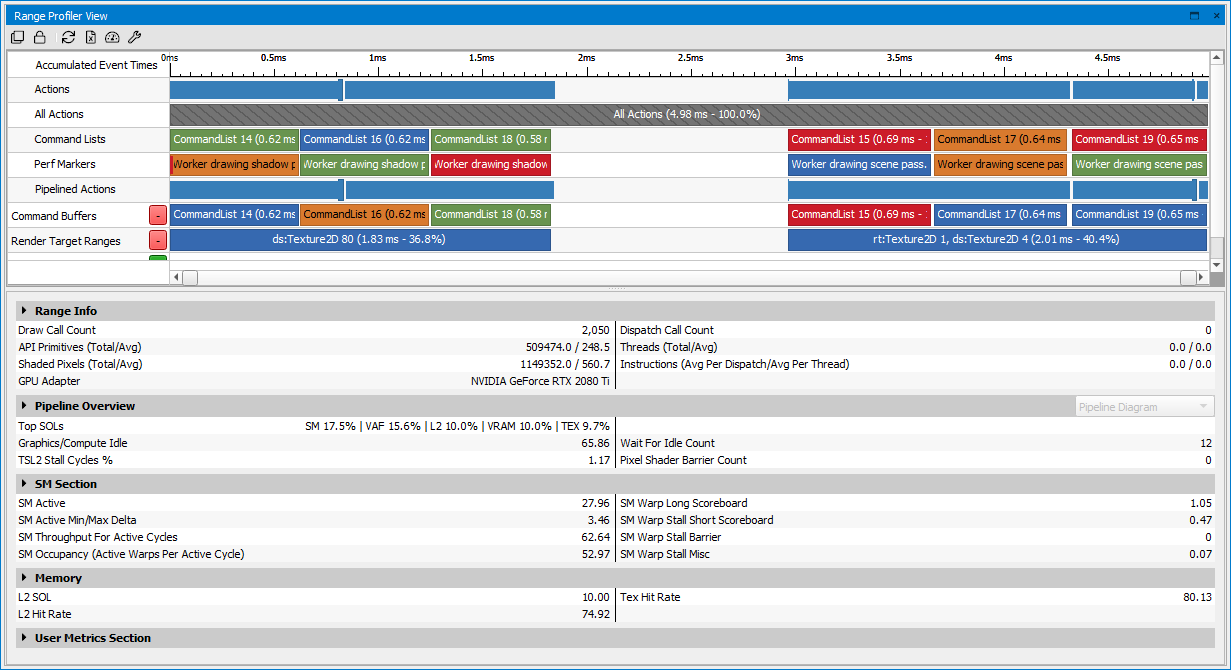
Once you have opened the Range Profiler, you will notice the Range Selector at the top of the view. This widget displays individual actions and ranges scaled by GPU time, similar to the Scrubber.
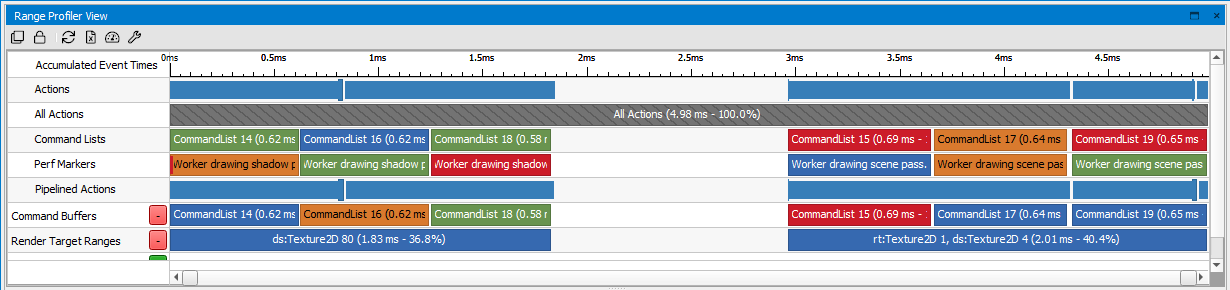
You can use the Range Selector to see the timings of various sections or passes in the captured scene, and select one of them to drill in and collect the detailed performance metrics. For more information on how to configure the Range Selector, see the Range Selector section.
What to Profile?
The first step for improving performance in a GPU bound application is to determine where you are spending GPU time in the rendering of the scene. This can be accomplished a number of ways using the Frame Debugger. First, adjust the scaling of the Scrubber to be based on GPU time.
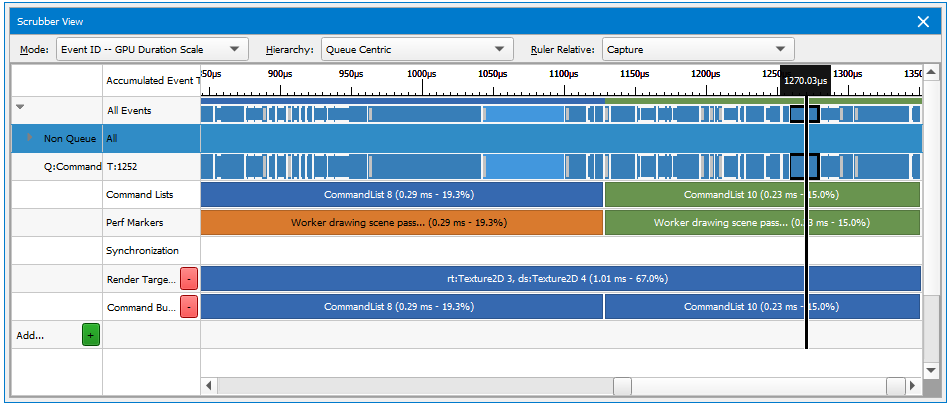
This will allow you to see at a glance where the time is being spent on the frame. These ranges will show up in the Scrubber, also scaled by the amount of time the work executed within them takes. Finally, if you haven’t added debug ranges, you can use various criteria to create them on the fly in your debugging session, including render target sets, shader programs in use, etc.
Look for ranges that seem larger than expected, given what you are trying to accomplish in that section of the frame. Also, larger ranges/draw calls likely have more headroom for improvement, so they can be good places to start deeper investigation.
You can also see how much GPU time is spent on various actions and ranges in the Event Viewer. By sorting by GPU Time, you can quickly find the most expensive parts of the frame and begin your analysis from there.
Once you find an area you are interested in profiling, use the right mouse button context menu to initiate the Range Profiler. This will open up the profiler focused on the range or call you determined to be interesting. (Alternatively, you can open the Range Profiler through Frame Debugger > Range Profiler.)
Range Profiler Cookbook
Is my program CPU or GPU bound?
Try hotkey experiments such as minimum geometry and null scissor, to determine if you are GPU bound.
What are the most expensive draw calls in my application?
Capture a frame, and then run the Range Profiler. Once the Range Profiler is done running experiments, the entire scene will be selected by default. This will allow you to see details about all of the draw calls and dispatches in the scene. If you select Action Details in the Range Info section, you will see details on each draw call, including the execution time. Sort the table to time to see the most expensive draw call.
How can I optimize a range of draw calls?
In the Pipeline section, select Range Details and you will see an image with a virtual GPU pipeline. The red bars indicate units in the GPU that are not being used as efficiently as they could, so look for the higher bars to indicate where you need to spend time optimizing. (See below for specific tips on optimizing your API inputs for a particular unit).
How do I see collections of draw calls which share common state (like pixel shaders and vertex shaders)?
The Range Profiler contains a powerful grouping capability that allows you make new ranges based on common state. These include ranges based on program/shaders being used, viewport, render targets, and even user ranges that can be declared on the fly.
How do I profile draw calls which are in a specific performance marker?
The scrubber at the top of the Range Profiler View shows all of the performance marker ranges defined by the application, along with the amount of time spent for each one. A good strategy would be to look for ranges with a large amount of time, then drill down to where you see a large amount of time being spent. Once you click on that range, you can look at the Pipeline section for details on how that selected range is utilizing the GPU.
Why does my application run at a different frame rate under Nsight Graphics?
The Nsight Graphics Frame Debugger disables VSYNC, so applications that have VSYNC enabled under normal circumstances may see a higher frame rate when the same application is run under the Frame Debugger. Nsight Graphics also has a small performance overhead, which may reduce the frame rate slightly.
Shader Profiling for SM Limited Workloads
The Shader Profiler is a tool for analyzing the performance of SM-limited workloads. It helps you, as a developer, identify the reasons that your shader is stalling and thus lowering performance. With the data that the shader profiler provides, you can investigate, at both a high- and low-level, how to get more performance out of your shaders. The Shader Profiler is currently in beta for D3D12 and Vulkan APIs.
How do I use it?
The Shader Profiler can be launched from several locations within the tool, much like the Range Profiler. Because the Shader Profiler targets the performance of your shaders, we recommend that you launch the Shader Profiler when the Range Profiler has identified that a particular range is shader limited. Once identified, you can click through a link in the Shaders section of the range profiler to collect and present a Shader Profiler report.
How does it work?
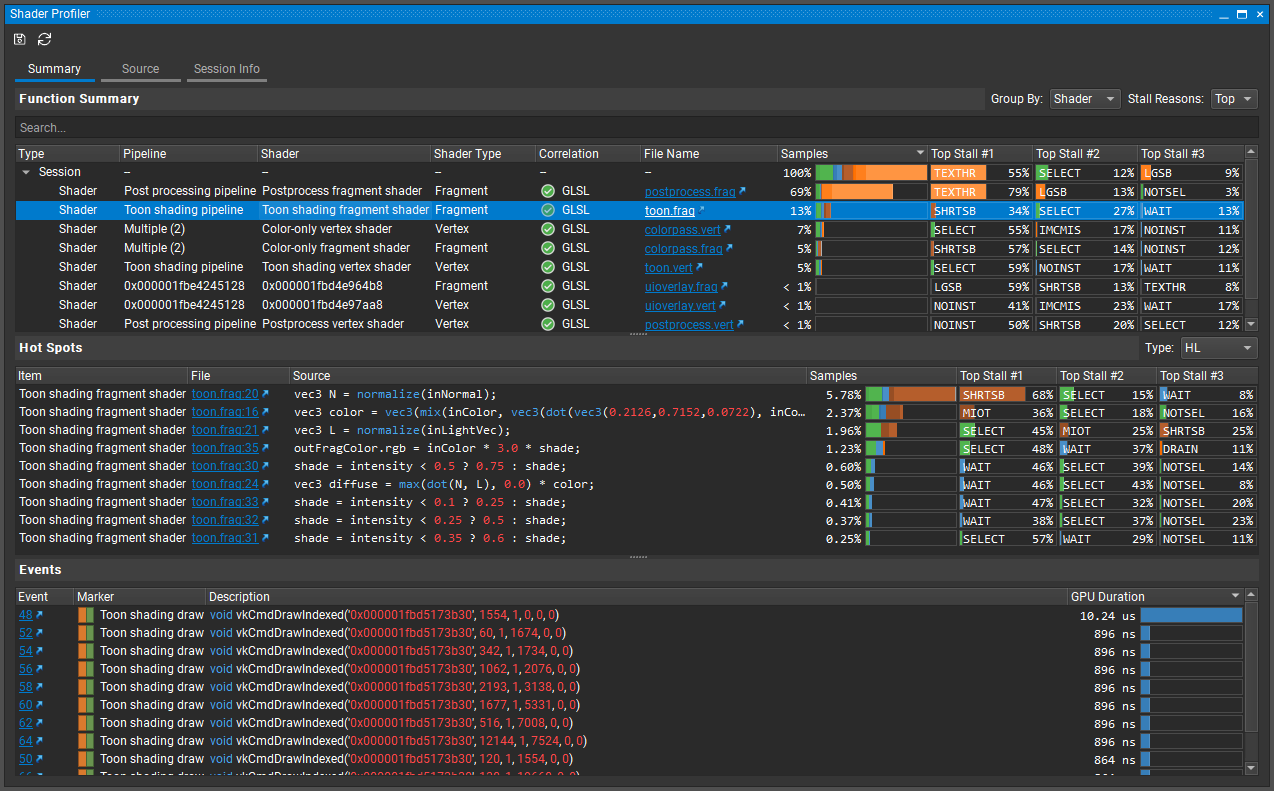
The Shader Profiler works by repeatedly running your shader code in a replay and using dedicated hardware samplers to determine the reasons why your code is stalling. The repeated runs allow for capturing of statistically valid sampling that ensures that you are getting a reliable, actionable analysis. Once the sampling experiment is completed, a report is generated that will allow you to find and action on the key hot spots within your shader pipeline.
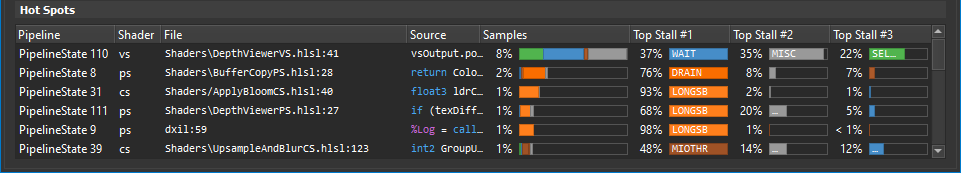
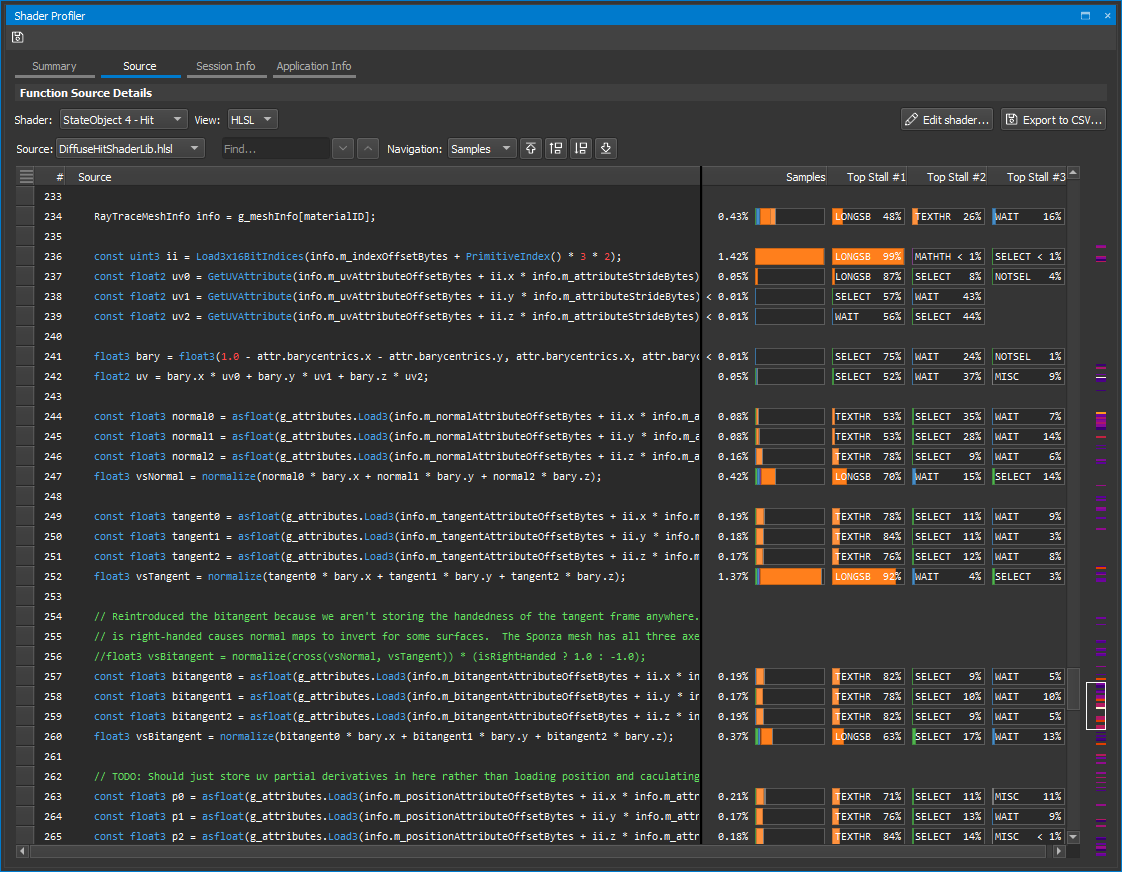
The reports contains several sections, including a Function Summary rollup of all of the shaders that were active within the range that was sampled, a high-level, selection-sensitive Sample Summary of the samples within that range, and a Hot spots view that identifies the key lines that contributed the most samples in the overall range. The report also presents tabs that report on session and application information, as well as the Source tab that allows for mapping, on a line-by-line basis, where samples hit.
Key Concepts
The shader profiler should be used to optimize latency-bound shaders. These types of shaders often have signatures of these forms:
- SM Activity and SM Occupancy are high. (If not, improve these first.)
- SM Throughput is low.
- Cache Throughputs (L1TEX, L1.5, L2) are low or middling.
If SM Throughput is high, the shader is likely computationally-bound, and better solved through a Range Profiler workflow.
Average Warp Latency
The average warp latency is the number of cycles that an average warp was resident on the GPU. The Samples% indicates the % of the average warp latency occupied by a given shader, function, or PC. Sorting by Samples reveals the regions of code with the highest contribution to latency. After identify top latency contributors, determine next steps by inspecting stall reasons.
Interpreting Sample Locations
Stalls are reported at the PC where a warp was unable to make progress. In many cases, this is due to an execution or data dependency on a prior instruction. For example, the following code may report a large number of samples on the line of code that consumes texResult, but the real culprit is the data producer g_MeshTexture.Sample().
float4 texResult = g_MeshTexture.Sample(MeshTextureSampler, In.TextureUV);
Output.RGBColor = texResult * In.Diffuse;
Note that samples can appear in the shadow of a taken branch - that is, on the instruction following a branch, even if that instruction is not executed - because the branch is still resolving at the time of the sampling.
if (constantBuffer.ConditionWeExpectToBeFalse)
{
texResult = ...; // samples in the shadow of a branch
output = dot(color, textResult);
}
else
{
output = dot(color, constant); // expect all samples to fall here
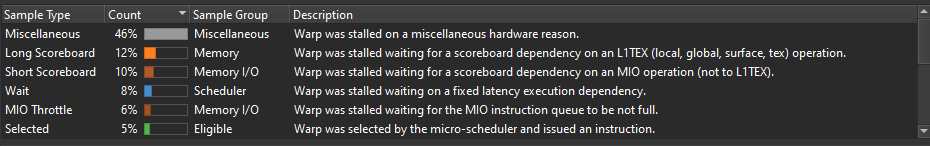
}Stall Reasons
Stall reasons explain why a warp was unable to issue an instruction. Each stall reason is provoked by a distinct set of conditions or instructions; by eliminating those conditions or transforming code from one set of instructions to another, you can reduce stalls.
-
Barrier: Compute warps are waiting for sibling warps at a GroupSync.
- If the thread group size is 512 threads or greater, consider splitting it into smaller groups. This can increase eligible warps without affecting occupancy, unless shared memory becomes a new occupancy limiter.
- Review whether all GroupSyncs are really necessary.
-
Dispatch Stall: A pipeline interlock prevented instruction dispatch for a selected warp.
-
If dispatch stalls are higher than 5%, please file a bug to NVIDIA with reproducible.
-
-
Drain : Exited warp is waiting to drain memory writes and pixel export.
-
LG Throttle : Input FIFO to the LSU pipe for local and global memory instructions is full.
-
Eliminate redundant global memory accesses (UAV accesses).
-
Data organization: pack UAV or SRV data to allow 64-bit or 128-bit accesses in place of multiple 32-bit accesses.
-
Long Scoreboard : Waiting on data dependency for local, global, texture, or surface load.
-
Find the instruction or line of code that produces the data being waited upon; that instruction is the culprit.
-
Consider transforming a lookup table into a calculation.
-
Consider transforming global reads in which all threads read the same address into constant buffer reads.
-
If L1 hit rate is low, try to improve spatial locality (coalesced accesses).
-
If VRAM Throughput is high, try to improve spatial locality (coalesced accesses).
-
-
Math Pipe Throttle : A math pipe input FIFO is full (FMA, ALU, FP16+Tensor).
-
This stall reason implies being computationally bound. Use the Range Profiler to best determine how to move computation to a different execution unit.
-
-
Membar : Waiting for a memory barrier to return.
-
Memory barriers are issued by GroupMemoryBarrier, DeviceMemoryBarrier, AllMemoryBarrier, and their GroupSync variants.
-
Review whether the specified scope of each barrier in the shader is really needed. Group-level barriers resolve much faster than Device-level.
-
Review whether a memory barrier is needed at all. A compute shader where each thread writes to a unique UAV location does not require a memory barrier.
-
-
MIO Throttle : The input FIFO to MIO is full.
-
May be triggered by local, global, shared, attribute, IPA, indexed constant loads (LDC), and decoupled math.
-
-
Misc : A stall reason not covered elsewhere.
-
Not Selected : Warp was eligible but not selected, because another warp was.
-
High “not selected” could indicate an opportunity to increase register or shared memory usage (lowering occupancy) without impacting performance. Opening the doors to greater shader complexity or improved quality.
-
-
Selected : Warp issued an instruction. Technically not a stall.
-
Short Scoreboard : Waiting for short latency MIO or RTCORE data dependency.
-
TEX Throttle : The TEXIN input FIFO is full.
-
Try issuing fewer texture fetches, surface loads, surface stores, or decoupled math operations.
-
Check whether the shader is using decoupled math (usually to be avoided).
-
Consider converting texture lookups or surface loads into global memory lookups (UAVs). Texture can accept 4 threads’ requests per cycle, whereas global accepts 32 threads.
-
-
Wait : Waiting for coupled math data dependency (FMA, ALU, FP16+Tensor).
Source Correlation
The shader profiler has the ability to correlate the samples that are gathered to source-level lines. This allows you, as the user, to determine, on a line-by-line basis, how your code is running. There are two types of correlation that are supported -- high-level shader language correlation and GPU shader assembly (SASS) correlation. High-level shader language correlation prepares a listing of your shaders source code, and along-side it, a chart of the samples that landed on each particular line. High-level correlation is very effective at grounding you to the code you are most familiar with, which is the shader source itself. For users who have access to the Pro builds of Nsight Graphics, and who wish to dive into the lower-level shader assembly, a SASS view is provided for individual instruction association of samples.
Generate C++ Capture
The C++ Capture activity allows you to export an application frame as C++ code to be compiled and run as a self-contained application for later analysis, debugging, profiling, regression testing, and edit-and-compile experimentation.
When to Use the Generate C++ Capture Activity
While C++ captures can be collected in while Frame Debugging, the C++ capture activity provides a focused activity to streamline the creation of captures. Non-necessary analysis subsystems are turned off in order to allow for the quickest and more robust application capture. This activity is an excellent way to save a snapshot of your application, frozen in time. Use this activity when:
-
You want to save a deterministic application for follow-up performance analysis.
-
You want to save a reference point for how your application is working.
-
You want to share a minimal reproducible with the developer tools or driver teams at NVIDIA to facilitate bug reporting.
The Generate C++ Capture activity supports all APIs that are generally supported by Nsight Graphics.
Basic Workflow
To start this activity, select Generate C++ Capture from the connection dialog.
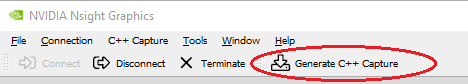
Once the application is running, the Generate C++ Capture button will be available on the main toolbar.
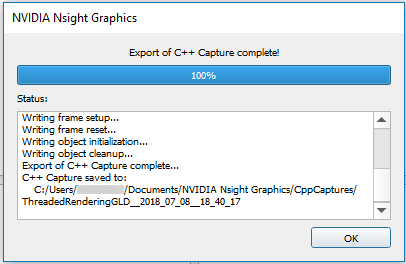
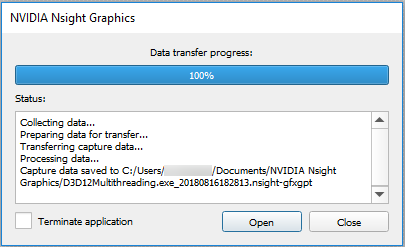
Once a capture is started, the target application will temporarily pause, and a progress dialog will be shown detailing the steps of the export to C++ process. When complete, the C++ project is written to the disk and the application will resume.
By default, the save directory is co-located beside the current project. If no project is currently loaded the default save directory is used (see Options > Environment > Default Documents Folder).
In addition to the C++ project, the code generation process also produces an ngfx-cppcap file with additional information and utilities. These ngfx-cppcap files are automatically associated with the current project and can be reopened later.
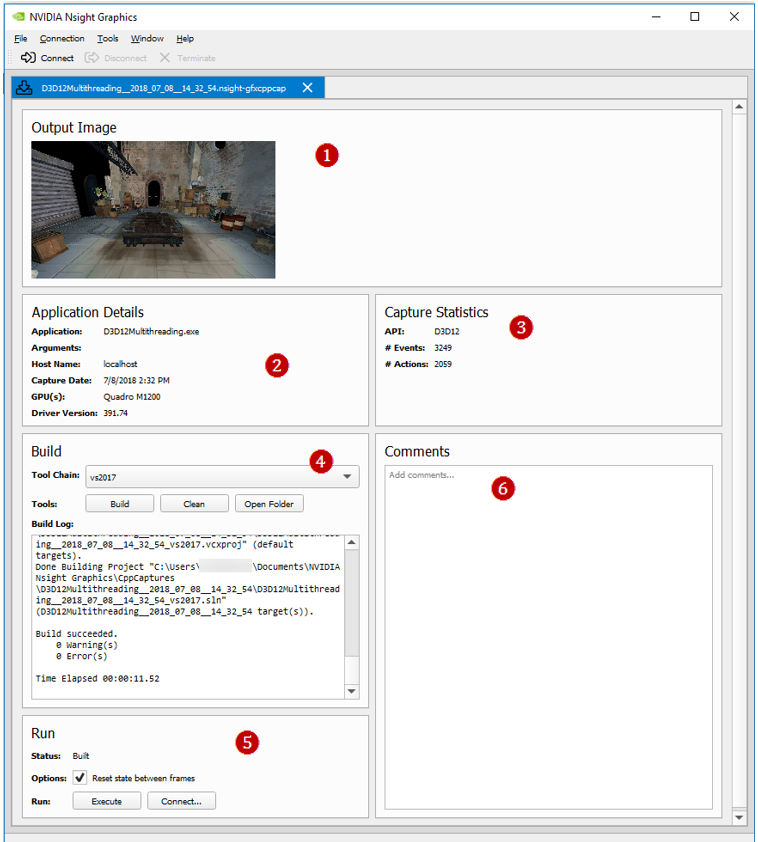
The additional features of an ngfx-cppcap file include:
-
Screenshot of the capture taken from the original application.
-
Information about the captured application and its original system.
-
Statistics about the captured API stream.
-
Utilities to build the C++ capture without opening the generated Visual Studio project.
-
Utilities to launch the compiled application:
-
The Execute button will launch the compiled executable.
-
The Connect... button will populate a new connection dialog that allows you to run a specific activity on the generated capture.
-
-
User comments that are persisted within this file.
Using a Saved Capture
-
To use the saved capture, use Visual Studio's Open Folder capability on the directory that was generated. After doing this, Visual Studio will read the CMakeLists.txt and allow you to build and run the executable . Alternatively, if you are using a version of Visual Studio that is earlier than 2017, and it does not support native CMake loading, you can use a standalone CMake tool to generate the projects for your version of Visual Studio.
-
These solution files contain a number of generated source files.
-
Main.cpp — This is where all of the initialization code is called, resources are created, and each frame portion is called in a message loop.
-
ResourcesNN.cpp — Depending on the number of resources to be created, there will be multiple ResourcesNN.cpp files, each with a CreateResourcesNN call in them, that will construct all of the resources (device(s), textures, shaders, etc.) that are used in the scene. These are called in Main.cpp before replaying the frame in the message loop.
-
FrameSetup.cpp — This file contains all of the state setting calls to set the API state to the proper values for the beginning of the frame, including what buffers are bound, which shaders are enabled, etc.
-
FrameNPartMM.cpp — In Direct3D and single-threaded OpenGL captures, these files contain the API functions, each named RunFrameNPartMM(), to replay the frame. It is split into multiple files so generated code is easier to work with. These functions are called sequentially in the message loop in Main.cpp.
-
ThreadLLFrameNPartMM.cpp — In multi-threaded OpenGL captures, these files contain the API functions, each named ThreadLLRunFrameNPartMM(), to replay the frame. The functions correspond to the work done by each thread during the frame. These functions are called by their respective threads and synchronized to replay the saved events in the same order as captured.
-
ReadOnlyDatabase.cpp — This is a helper class to access resource data that is stored in the data.bin file. It is accessed throughout the code via the GetResource() call.
-
Helpers.cpp — These functions are used throughout the replayer for various conversions and access to the ReadOnlyDatabase.
-
Threading.cpp — This file contains helper functions and classes to manage threads used in the project.
-
-
Build and run the project.
Building a Saved Capture for a Different Platform
For Vulkan applications, Nsight Graphics currently supports building and running the saved capture for a different platform, e.g., you may have a capture saved on Windows but would like to run it on Embedded Linux.
Nsight Graphics tries to support the cross-platform converting on a best-efforts basis, but there are some platform-specific considerations and mechanisms outside Vulkan, and some platform-specific extensions and functions may not be able to be converted properly for a different platform. Accordingly, the runtime compatibility of the cross-platform converted capture cannot be ensured.
To use a capture saved on a different platform, you can simply open an ngfx-cppcap file in Nsight Graphics through File > Open File..., and click Build button. We will automatically determine the default compile options for you.
Alternatively, you can manually build a saved capture from a command line, but you need to explicitly specify the compile options:
- NV_TARGET_PLATFORM: select target platform to build for
- NV_WINSYS: select window system type to interact with graphics API
- NV_SDKDIR: specify the path to SDK directory (only required when building for Embedded Linux)
Examples:
-
Build a saved capture for Embedded Linux and use x11 as the window system:
mkdir -p int &&
cd int &&
cmake -G "Unix Makefiles" -DNV_INSTALL_FOLDER=bin -DNV_TARGET_PLATFORM=LINUX_EMBEDDED -DNV_WINSYS=x11 -DNV_SDKDIR=<SDK_PATH> .. &&
cmake --build . --config RelWithDebInfo --target install -- -j13
-
Build a saved capture for Windows:
MD int &&
CD int &&
cmake -G "Visual Studio 16 2019" -A x64 -DCMAKE_GENERATOR_INSTANCE="C:\Program Files (x86)\Microsoft Visual Studio\2019\Professional" -DNV_INSTALL_FOLDER=bin .. &&
cmake --build . --config RelWithDebInfo --target install
-
Build a saved capture for Linux Desktop and use xcb as the window system:
mkdir -p int &&
cd int &&
cmake -G "Unix Makefiles" -DNV_INSTALL_FOLDER=bin -DNV_TARGET_PLATFORM=LINUX_DESKTOP -DNV_WINSYS=xcb .. &&
cmake --build . --config RelWithDebInfo --target install -- -j13
Changing a Resource
If you want to change a resource (for example, to swap in a different texture), you can change the parameters for the construction by looking within the ResourcesNN.cpp files for the texture in question. Textures can be matched by size and/or format. Once you find the variable for the texture, look for that name in the FrameSetup.cpp file. This will contain source lines to lock the texture, call GetResource() to retrieve the data from the ReadOnlyDatabase, and then call memcpy(…) to link the data to the texture. You can substitute the call to the ReadOnlyDatabase with a call to read from a file of choice to load the alternate texture.
Changing a Draw Call
If you want to change the state for a given draw call, you can locate the draw call by replaying the capture within Nsight Graphics and scrubbing to find the call you want to examine. Search in the FrameNPartMM.cpp files for Draw NN, where NN is the 0-based draw call index that Nsight Graphics displayed on the scrubber. Doing this will bring you to the source line for that draw call, and from here, you can add any state changes before that call. Alternatively, you can also disable that specific call by commenting out the source call containing the draw call.
Parameters
-
-repeat N — This setting enables Nsight Graphics to use serialized captures in the normal arch workflow. The N setting indicates the number of times to repeat the entire capture; the default setting is -1, which keeps the capture running on an infinite loop.
-
-noreset — This setting controls whether context state and all resources are reset to their beginning of frame value. When this setting is specified, all frame restoration operations will be skipped, avoiding the performance cost associated with them. Note that this may introduce rendering errors if the rendered frame has a data dependency on the results of a previous frame. Additionally, note that, while uncommon, skipping frame restoration does have the opportunity to lead to application crashes.
Generate C++ Capture from a Command Line
To understand how to generate C++ capture, start by launching the CLI with the --help-all argument. This will display all available options the CLI has.
The CLI can launch an application for generating C++ capture in the form:
ngfx.exe --activity="Generate C++ Capture" [general_options] [Generate_C++_Capture_activity_options]
See CLI Arguments Details for the general options details, the Generate C++ Capture activity options:
| Option | Description |
|---|---|
|
--wait-seconds arg |
Wait time (in seconds) before capturing a frame. |
|
--wait-hotkey |
The capture is expected to be triggered by pressing Target application capture hotkey on the running application. If enabled, the option about waiting in seconds would be ignored. |
Examples:
ngfx.exe --activity="Generate C++ Capture" --platform="Windows"
--exe=D:\Bloom\bloom.exe --wait-seconds=10
Launch an application for automatically generating C++ capture after waiting the specified count of seconds.
ngfx.exe --activity="Generate C++ Capture" --platform="Windows"
--exe=D:\Bloom\bloom.exe --wait-hotkey
Launch an application for manually triggering capture so as to generate C++ capture. CLI is waiting for the capture triggered from the target side (pressing CTRL+Z and spacebar on the running application).
ngfx.exe --activity="Generate C++ Capture" --platform="Windows"
--project="D:\Projects\Bloom.ngfx-proj" --wait-seconds=10 --no-timeout
Launch an application for automatically generating C++ capture after waiting the specified count of seconds, but with using the launch options and activity options read from a Nsight Graphics project. In addition, --no-timeout disables all timeouts in case this application may take a long time to launch/capture/.
GPU Trace
The GPU Trace activity is a low-level profiler that can be used for developers to optimize DirectX12 application for NVIDIA Turing Hardware. It runs on live applications and captures GPU Units' utilization throughout frame execution. The GPU Trace captured report may help to detect bottlenecks in the GPU Pipeline, as well as areas where your application is under utilizing the GPU.
When to Use the GPU Trace Activity
The GPU Trace activity provides detailed performance information for various GPU Units.
Use this activity when:
-
You wish to understand the GPU Units' utilization and search for throughput bottlenecks.
-
You wish to understand how synchronization objects across queues are being executed.
-
You would like to search for opportunities where your application is under-utilizing the GPU.
-
You suspect your engine will benefit from asynchronous compute.
The GPU Trace activity currently supports profiling Direct3D 12 applications and NVIDIA Turing architecture.
Basic Workflow
To start the activity, select GPU Trace from the connection dialog.
-
Set up your application for connection (see How to Launch and Connect to Your Application for more information.).
-
Set a Frame Count. This parameter defines how many frames will be captured. The maximum value is 5.
-
Launch or attach to your application. (See How to Launch and Connect to Your Application for more information.)
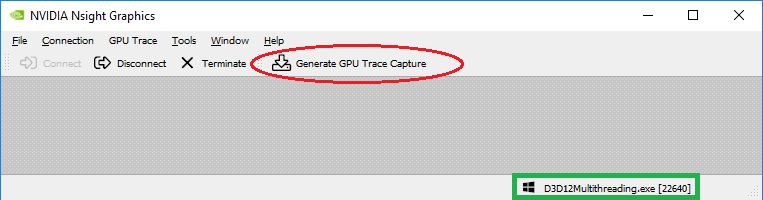
-
If the application successfully connected, the process name will appear in the lower right corner of the window. You can generate a new capture by clicking the Generate GPU Trace Capture button or by clicking Target application capture hotkey on the running application.
Note:
For best accuracy, it is recommended that you run your application in full-screen mode and turn off VSYNC. You can turn VSYNC off from your application or set DXGI SyncInterval to 0 under Additional Options in the connection dialog.
Note:
By default, GPU Trace will lock the GPU clock to base before capturing. This methodology is recommended so consecutive captures will be comparable.
-
Once launched and connected, click Generate GPU Trace Capture (or select it from the GPU Trace menu) to create a capture report file.
How to Interpret a Report
When interpreting a report, reference the GPU Trace UI section for information on how to interpret each of the pieces of information that is provided. Things to consider:
-
Am I GPU bound?
-
Am I using asynchronous compute?
-
Do I have opportunities for asynchronous compute?
-
What workloads are taking the most time?
-
Is my occupancy low for these workloads?
If you determine that you have opportunities for asynchronous compute and you are not currently using (or achieving) async compute, you may want to investigate your engine to understand where or how you can achieve it.
If you determine that you have expensive workloads with low occupancy, you will want to analyze your shader for opportunities to reduce work or reduce register/memory usage to allow for more occupancy.
Generate GPU Trace Capture from a Command Line
To understand how to generate GPU Trace capture, start by launching the CLI with the --help-all argument. This will display all available options the CLI has.
The CLI can launch an application for generating GPU Trace capture in the form:
ngfx.exe --activity="GPU Trace" [general_options] [GPU_Trace_activity_options]
See CLI Arguments Details for the general options details, the GPU Trace activity options:
| Option | Description |
|---|---|
|
--wait-frames arg |
Wait in frames before generating GPU Trace capture. |
|
--wait-seconds arg |
Wait time (in seconds) before generating GPU Trace capture. |
|
--wait-hotkey |
The capture is expected to be triggered by pressing the Target application capture hotkey on the running application. If enabled, the options about waiting in frames/seconds would be ignored. |
|
--auto-export |
Automatically export metrics data after generating GPU Trace capture. |
|
--num-frames arg |
How many frames (1-15) to capture (may be limited by memory availability). |
|
--metric-set arg |
Select metric set index to use. NOTE: The available metric set indices (and the corresponding metric set names) can be found in the help message (--help-all). |
Examples:
ngfx.exe --activity="GPU Trace" --platform="Windows"
--exe=D:\Bloom\bloom.exe --wait-seconds=10 --metric-set=1
Launch an application for automatically generating GPU Trace capture after waiting the specified count of seconds, with using the metric set index of 1.
ngfx.exe --activity="GPU Trace" --platform="Windows"
--exe=D:\Bloom\bloom.exe --wait-hotkey --auto-export
Launch an application for manually triggering generating GPU Trace capture. CLI is waiting for the capture triggered from the target side (pressing Target application capture hotkey on the running application). After the capture is finished, CLI also opens the generated GPU Trace capture and exports the metrics data.
ngfx.exe --activity="GPU Trace" --platform="Windows"
--project="D:\Projects\Bloom.ngfx-proj" --wait-seconds=10
Launch an application for automatically generating GPU Trace capture after waiting the specified count of seconds, but with using the launch options and activity options read from a Nsight Graphics project.
System Trace
The System Trace activity is a special activity that connects to the Nsight Systems™ tool. See the Expected Workflow section to understand how Nsight Systems can fit into your profiling and optimization workflow.
When a compatible version of Nsight Systems is present on the system, the System Trace activity offers a connection to Nsight Systems to automatically populate a system trace activity on the external tool with settings from the Nsight Graphics connection dialog. This allows for easy saving of project properties in a singular location.
When a compatible version of Nsight Systems is not present on the system, the System Trace activity offers a convenient link to download the tool. Nsight Graphics must be restarted to discover any newly installed versions of Nsight Systems.
User Interface Reference
This section provides a deep view of all of the user interface elements and views that Nsight Graphics offers.
App Configuration and Activity Selection UI
Launch Tab
The Launch tab enables launching applications for analysis. This is where you will add the basic process information to launch and subsequently connect to the application you wish to analyze.
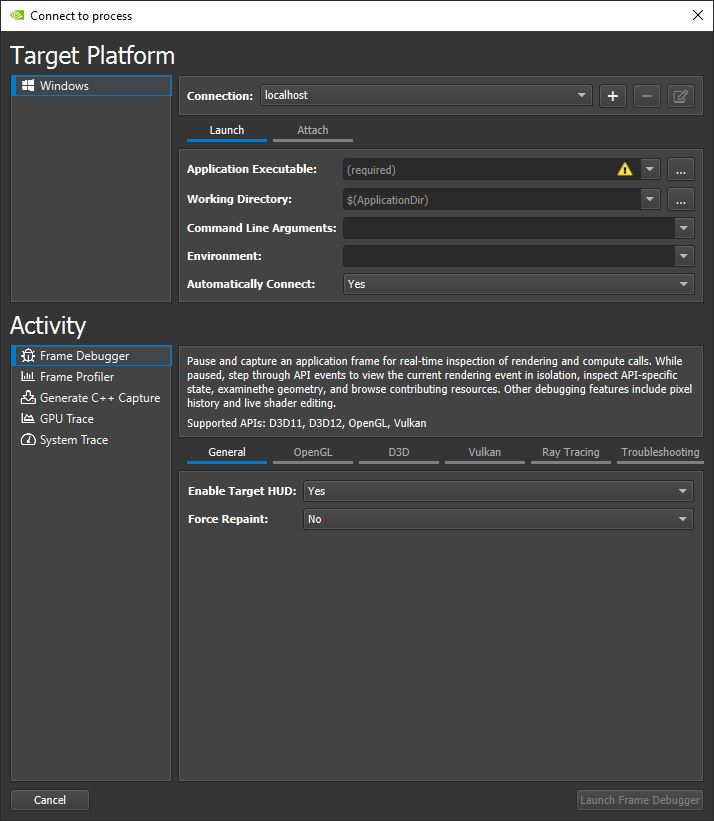
This tab has the following controls:
- Application Executable - Specifies the root application to launch. Note that this may not be the final application that you wish to analyze. Reference this field using $(ApplicationExecutable), or its parent directory using $(ApplicationDir).
- Working Directory - The directory in which the application will be launched. By default the working directory will be set to the application directory. Reference this field using $(WorkingDir).
- Command Line Arguments - Specify the arguments to pass the application executable.
- Environment - The environment variables to set in the launched application.
- Automatically Connect - Specifies whether the launched application should be automatically connected to. If the launched application is a launcher that creates the process that you ultimately wish to analyze, set this to 'No'.
The following variables can be used in any of the Launch tab fields:
- $(ProjectDir) - Refers to directory in which the current project is saved.
- $(ApplicationExecutable) - Refers to the value in the Application Executable field.
- $(ApplicationDir) - Refers to parent folder of the Application Executable.
- $(WorkingDir) - Refers to the value in the Working Directory field.
 selector to allow you to cycle through
recently used entries. This is a useful capability for cycling
through common configurations.
selector to allow you to cycle through
recently used entries. This is a useful capability for cycling
through common configurations.
Attach Tab
To attach to an application, it must have previously been launched through the launch tab. This page will list the launched application as well as any children that the application has launched.
Activities Options
Nsight Graphics allows for adjusting the activity with a large set of options. Options are available in the Connect window under the Additional Options section. These options are saved per-project, and per-activity, because the options for one activity may not relate to the other. Note that you may need to apply them to multiple activities if your needs for each activity are the same.
| Option | Description |
|---|---|
|
Enables the HUD on the target application, which enables: |
|
|
Enables a periodic trigger of window invalidation, which causes applications that lazily present to repaint, such as many professional visualization applications. This is useful for providing a consistent stream of frames with which Nsight Graphics can perform its analysis. |
| Option | Description |
|---|---|
|
Force the Vulkan validation layers to be enabled. This requires the LunarG Vulkan SDK to be installed. |
|
|
Layers used when force enabling validation. This option is only visible when 'Force Validation' is turned on. |
|
|
Enables buffer device address capture/replay support so that buffers with VK_BUFFER_USAGE_SHADER_DEVICE_ADDRESS_BIT have the same address between capture and C++ replay. Enabling this option may lead to instability due to different allocation methods used by the driver. This option is only needed to when generating C++ captures of applications that indirectly access a buffer address within a shader. |
|
|
Forces the VK_MEMORY_ALLOCATE_DEVICE_ADDRESS_BIT and VK_MEMORY_ALLOCATE_DEVICE_ADDRESS_CAPTURE_REPLAY_BIT bits to be be set on all device memory allocations. This is necessary if the application is later binding addressable buffers but incorrectly excluded the flag on the associated memory. |
|
|
Includes the entire contents of device memory for C++ captures, as opposed to just the bound contents. This results in larger capture but might address issues with out-of-bounds memory access. |
|
|
Controls the monitoring and collection of mapped coherent buffer updates during capture. This is potentially an expensive operation and many applications can replay a single frame without actively monitoring these changes. Use this option if your capture takes a long time but you do not straddle frames with coherent updates. |
|
|
Controls the collection of revision zero (e.g. pre-capture) data during capture. This is potentially an expensive operation, in both memory and processing time, and some applications can replay a single frame without explicitly storing these revisions. |
|
|
Allows the inspection of Vulkan structures with potentially dangerous pNext values. By default structures with no known extensions are skipped. |
|
|
Controls how objects are stored internally by the tool. Safe lookup are slower but may improve stability when using an unsupported extension. |
|
|
This option controls which objects are exported as part of a Vulkan C++ capture. By default we limit the object set to only objects used in the capture but in some cases a user might want to see all objects used in the application. This typically isn't necessary and can lead to a very large C++ project. This might also help WAR a bug where the tool incorrectly prunes an object it shouldn't have.
|
|
|
Amount of physical device heap space (MB) to automatically reserve for the frame debugger. |
|
|
For multi-threaded applications, attempts to remove excessive context switching by grouping thread events together. May improve C++ capture replay performance of heavily threaded applications. |
|
|
To capture an application that uses wrapper libraries atop Vulkan, for example DXVK, set this setting to 'Yes' to ignore the wrapper library and capture the underlying Vulkan calls. When set to 'Auto', Nsight will attempt to auto-detect whether wrapper libraries should be ignored. |
| Option | Description |
|---|---|
|
Controls the enablement of capabilities that require driver support. This effectively disables: Disabling this option is the first and best option to try if you run into capture errors as it disambiguates problems quickly given the number of subsystems it turns off. |
|
|
Controls the collection of all information reflected from shader objects. This includes source code, disassembly, input attributes, resource associations, etc... Note, dynamic shader editing is not available when this option is disabled. This option is useful if you suspect an error or incompatibility with a shader reflection tool (such as D3DCompiler.dll or SPIRV-Cross). |
|
|
Enable fetch of SASS shaders which can be used to collect shader performance stats. |
|
|
Enable creation of shader-to-PC line tables used by the shader profiler for source correlation. |
|
|
Enables the collection of performance metrics from the hardware. |
|
|
Nsight Graphics uses an incompatibility system to detect and report problems that are likely to interfere with the analysis of your application. By default, these incompatibilities are reported and the user is given the option of capturing despite them (with an associated warning of the possibility of issues). Some applications may have innocuous incompatibilities, however, and having to view this warning every time might be undesired. When this option is enabled, the frame will attempt to capture despite any incompatibilities. Use this option only when you are certain that the incompatibility will not impact your analysis. |
|
|
Nsight Graphics uses an incompatibility system to detect and report problems that are likely to interfere with the analysis of your application. In some cases, these incompatibilities may be the first sign of an impending failure. Accordingly, being able to block on such a reported failure may aid in triaging and understanding a crash when running under Nsight Graphics . This option defaults to 'Auto' such that it only reports critical incompatibilities, allowing lesser incompatibilities so as not to interfere with expected operation. It may be useful to toggle to 'Enable' if you encounter an application crash under Nsight Graphics to force an opportunity to investigate the crash. |
|
|
Enables the collection and reporting of crash data to help identify issues with the frame debugger. While a user is always prompted before a crash report is sent, this option is available to suppress these facilities entirely. |
|
|
Enables the ability to serialize a capture to C/C++. By default, applications are available to create a C++ capture, but there are some cases where extra data is collected in support of this feature before it is invoked. This option allows that collection to be disabled entirely. |
|
|
Controls whether capture proceeds with concurrent threads or with serialized threads. Use this option if you suspect your application's multi-threading may be interfering with the capture process. |
|
|
Controls the strategy used in live analysis for pausing threads.
|
Frame Debugging/Profiling UI
The Frame Debugger and Frame Profiler activities are capture-based activities. There are two classes of views in these activities – pre-capture views and post-capture views. Pre-capture views generally report real-time information on the application as it is running. Post-capture views show information related to the captured frame and are only available after an application has been captured for live analysis. For an example of how to capture, follow the example walkthrough in How to Launch and Connect to Your Application.
All Resources View
The All Resources View allows you to see all of the available resources in the scene.
To access this view, go to Frame Debugger > All Resources.
This view shows a grid of all of the resources used by the application. For graphical resources, these resources will be displayed graphically. For others, an icon is used to denote its type. When a resource is selected, a row of revisions will be shown for that resource. Clicking on any revision will change the frame debugger event to the closest event that generated or had the potential of consuming that revision.
Clicking the link below a resource, or double-clicking on the resource thumbnail, will open a Resource Viewer or Acceleration Structure View on that resource.
There are a number of additional capabilities in this view. At the top of the All Resources view, you'll find a toolbar:
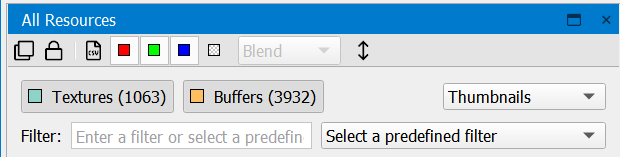
-
Clone — makes a copy of the current view, so that you can open another instance.
-
Lock — freezes the current view so that changing the current event does not update this view. This is helpful when trying to compare the state or a resource at two different actions.
-
Save — saves the captured resources to disk.
-
Red, Green, and Blue — toggles on and off specific colors.
-
Alpha — enables alpha visualization. In the neighboring drop-down, you can select one of the following two options:
-
Blend — blends the alpha with a checkerboard background.
-
Grayscale — alpha values are displayed as grayscale.
-
-
Flip Image — inverts the image of the resource displayed.
Below the toolbar is a set of buttons for high-level filtering of the resources based on type. Next to that, there is a drop-down menu that allows you to select how you wish to view the resources: thumbnails, small thumbnails, tiles, or details.
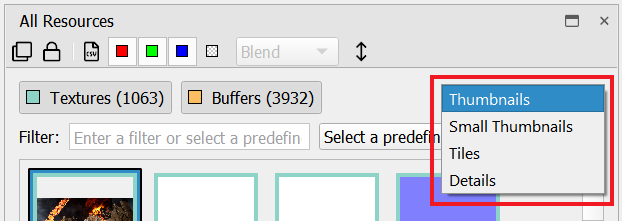
If you select the Details view, you can sort the resources by the available column headings (type, name, size, etc.).
Filtering
There are three ways to filter the available resources.
-
For high-level filtering, there are color coded buttons to filter based on resource type. All resource types are visible by default, and you can filter the resource list by de-selecting the button for the type you don't want to see. For example, if you'd like to see only textures, you can click the other buttons to de-select them and remove them from the list of resources.
-
You can manually type in a search string to filter the list of resources.
-
You can choose from the drop-down of predefined filters to view only large resources, depth resources, unused resources, or resources that change in the frame. Selecting one of these will fill in the JavaScript string necessary for the requested filter, which is also useful as a basis to construct custom filters.
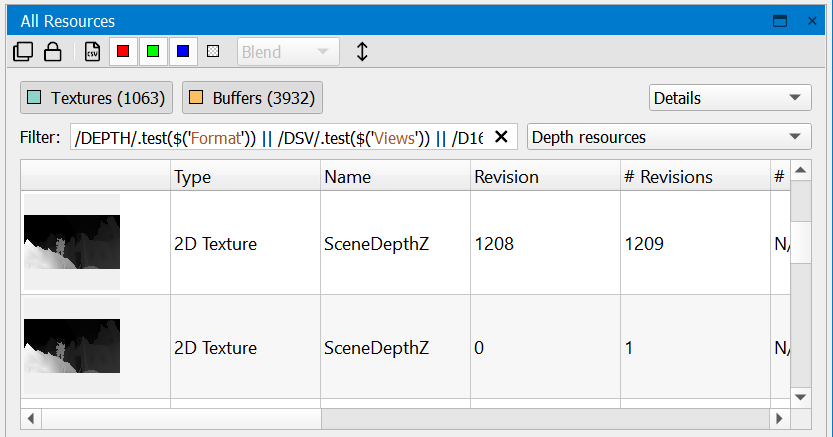
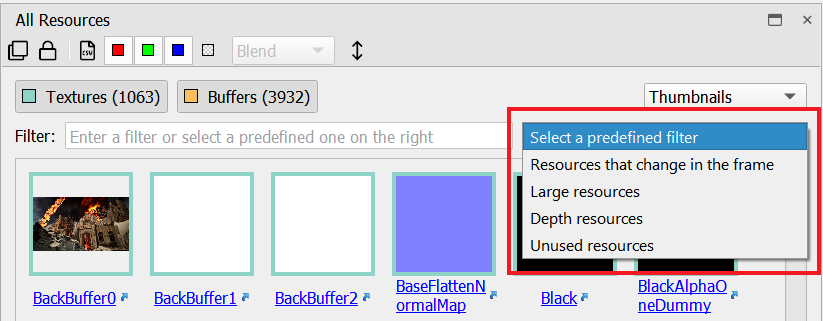
Application HUD
The Application HUD is a heads-up display which overlays directly on your application. You can use the HUD to capture a frame and subsequently scrub through its constituent draw calls on either the HUD or an attached host.
All actions that occur either in the HUD or on the host — such as capturing a frame or scrubbing to a specific draw call — are automatically synchronized between the HUD and the host, and thus you can switch between using the HUD and host UI seamlessly as needed.
The HUD has two (2) modes:
-
Running: Interact with your game or application normally, while the HUD shows an FPS counter. When you first start your application with Nsight Graphics, the HUD is in Running mode. This mode is most useful for viewing coarse GPU frame time in real-time while you run your application.
-
Frame Debugger: Once you have captured a frame, you can debug the frame directly in the Nsight Graphics HUD (as well as from the host). The HUD allows you to scrub through the constituent draw calls of a frame, to view render targets with panning and zooming, and to examine specific values in those render targets.
Running Mode
In this mode, your application can interact with the game or application normally, and the HUD shows frame-time overlaid on the scene. When you first start your application with Nsight Graphics, the HUD is in Running mode.
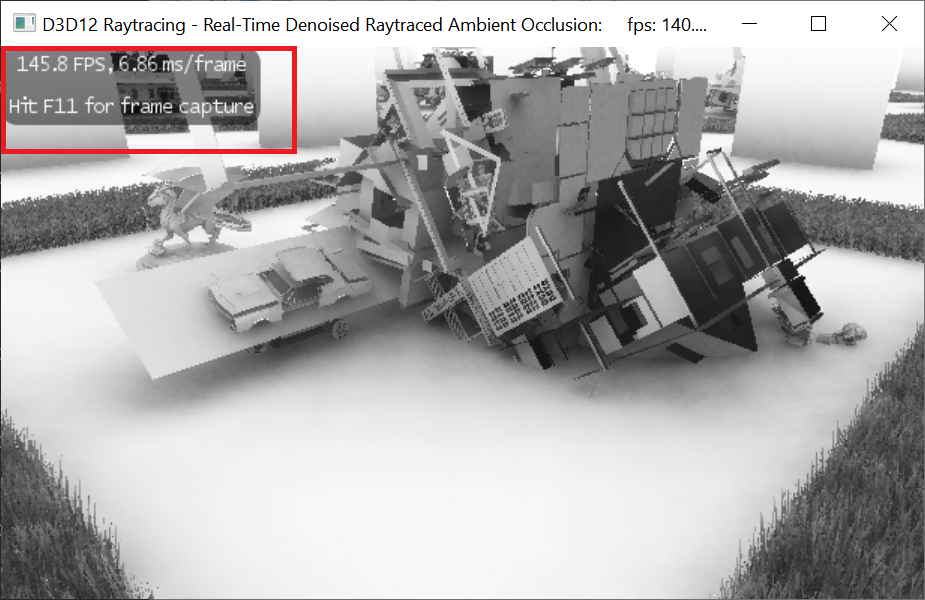
Frame Debugger Mode
There are two different methods to pause the application, which causes it to enter Frame Debugger mode.
-
Press Target application capture hotkey, as mentioned above; or
-
Go to the main toolbar in the Nsight Graphics UI and select Pause and Capture Frame.
Once you have captured a frame, you can debug the frame directly in the HUD. While you can also debug the frame on the host, the HUD allows you to scrub through the constituent draw calls of a frame, to view render targets with panning and zooming, and to examine specific values in those render targets.
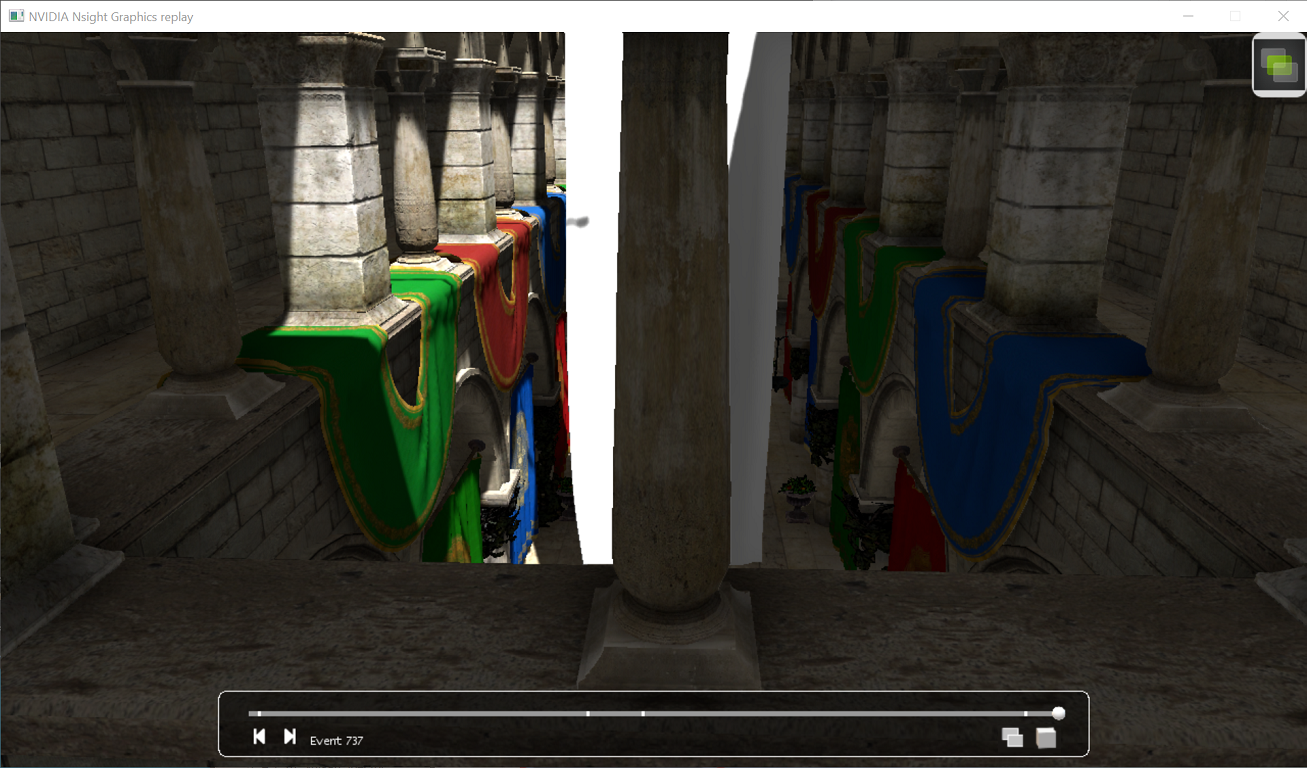
The HUD scrubber can be clicked to navigate between events. Additionally, the view has several controls to aid in your resource investigation.
| Hot Keys | Action |
|---|---|
|
Left-click + drag on the scrubber bar |
Navigate to a particular draw call in your frame. When the desired draw call is active, release the left mouse button. The geometry for the currently active draw call will be highlighted, as long as it is on screen. |
| Home | Navigate to the first event |
| End | Navigate to the last event |
| CTRL + Left | Navigate to the next event |
| CTRL + Right | Navigate to the previous event |
|
CTRL + Plus (+) |
Zoom in |
|
CTRL + Minus (-) |
Zoom out |
|
CTRL + Zero (0) |
Makes the current texture fit to screen. |
|
Left-click + drag on a render target |
Pans and zooms the currently displayed render target. Use the mouse wheel to zoom in to a particular portion of the render target. |
|
N |
Cycles between the currently available render targets, depth targets, and stencil targets. |
|
W |
Cycles between wireframe modes (off, red, animated). |
To switch the display to another active render target:
-
Click the Select Render Target button on the HUD toolbar.
-
A drop-down menu will appear, showing all valid choices for the current draw call. Select the desired render target.
-
Note that if a selected render target is not still active for a different draw call, the display will automatically switch to an active render target.
-
You can also toggle between available render targets using the Ctrl+N hotkey.
| HUD ICON | DEFINITION |
|---|---|
| Navigate to the next event. | |
|
Navigate to the previous event. |
|
|
Cycles between the currently available render targets, depth targets, and stencil targets. |
|
|
Cycles between wireframe modes (off, red, animated). |
API Inspector
The API inspector is a common view to all supported APIs that offers an exhaustive look at all of the state that is relevant to a particular event to which the capture analysis is scrubbed.
To access this view, go to Frame Debugger > API Inspector.
While the view is common, the state within it is particular to each API. See the section below that relates to your API of interest.
D3D11 API Inspector
The API Inspector view has an API-specific pipeline navigator that allows you to select a particular group of state within the GPU pipeline. From here, you can inspect the API state for each stage, including what textures and render targets are bound, or which shaders are in use in the related constants. Note that if a stage is not active (either there is nothing bound to that stage or it doesn’t apply for the current action) it will be greyed out, but you you can still click on it to inspect the state.
Pipeline Stages
The following table shows the stages that are available for inspection:
-
IA —The Input Assembler shows the layout of your vertex buffers and index buffers.
-
VS — Shows all of the shader resource views and constant buffers bound to the Vertex Shader stage, as well as links to the HLSL source code and other shader information.
-
HS — This shows all of the shader resource views and constant buffers bound to the Hull Shader stage, as well as links to the HLSL source code and other shader information.
-
DS — This shows all of the shader resource views and constant buffer bound to the Domain Shader stage, as well as links to the HLSL source code and other shader information.
-
GS — Shows all of the shader resource views and constant buffers bound to the Geometry Shader stage, as well as links to the HLSL source code and other shader information.
-
SO — Shows the resources bound for Stream Output.
-
RS — Shows the Rasterizer State parameters, including culling mode, scissor and viewport rectangles, etc.
-
PS — Shows all of the shader resource views, constant buffers, and render target views bound to the Pixel Shader stage, as well as links to the HLSL source code and other shader information.
-
OM — Shows the Output Merger parameters, including blending setup, depth, stencil, render target views, etc.
-
CS — This shows all of the shader resource and unordered access views and constant buffers bound to the Compute Shader stage, as well as links to the HLSL source code and other shader information.
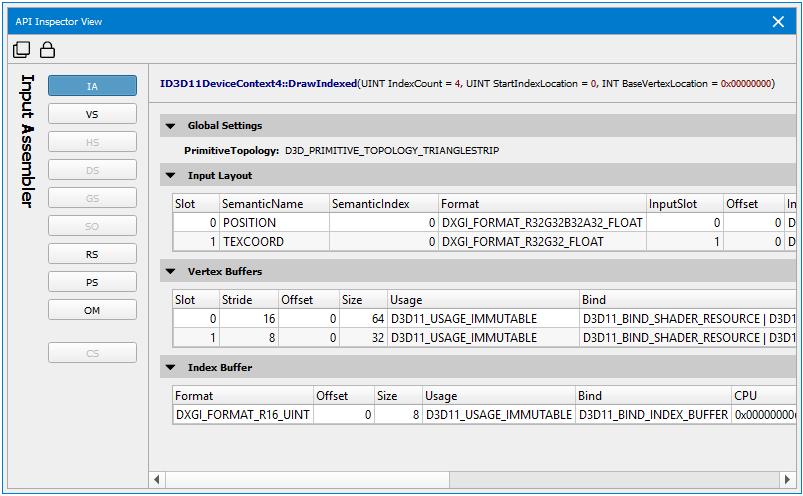
Shaders (VS, HS, DS, GS, PS, CS)
The various shader pages display all of the constant buffers, shader resource views, and input/output parameters, as well as links to the HLSL source code and other shader information.
In the constant buffer list, you can expand the buffer to see which HLSL variables are mapped to each entry, as well as the current values.
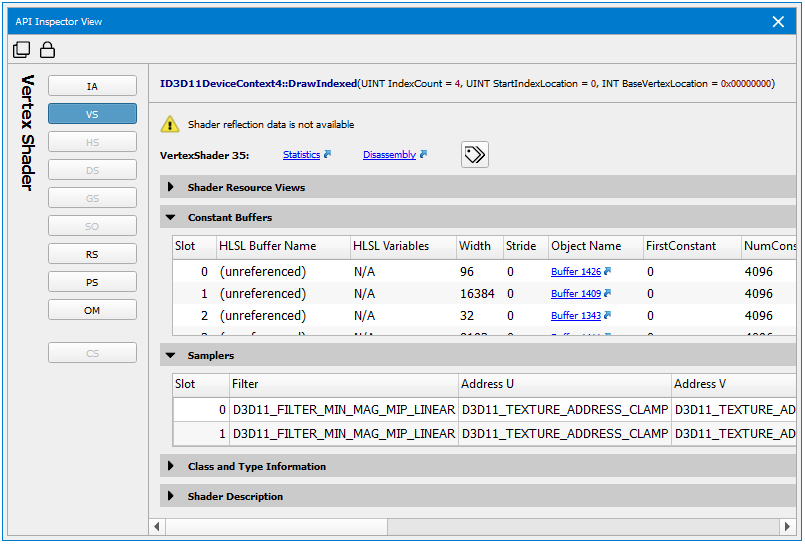
To enable resolution of HLSL variables, you must enable debug info when compiling the shader. See Shader Compilation for a discussion of the parameters required to prepare your shaders for optimal usage within Nsight Graphics.
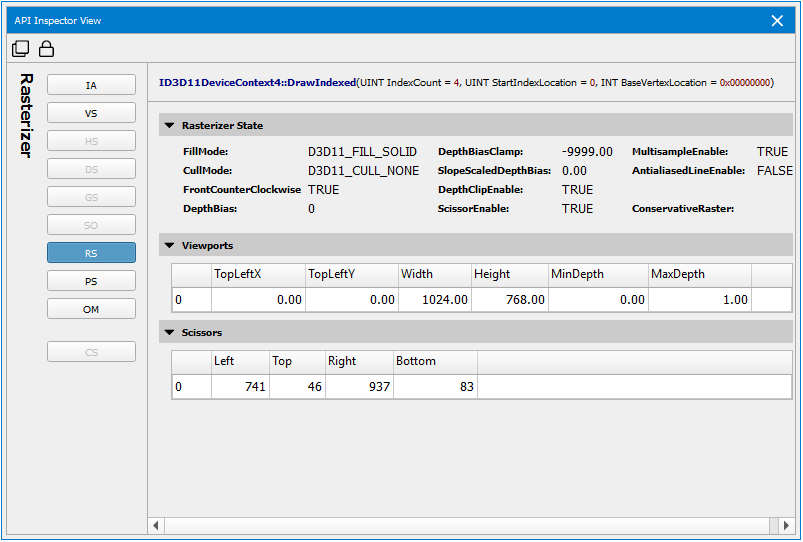
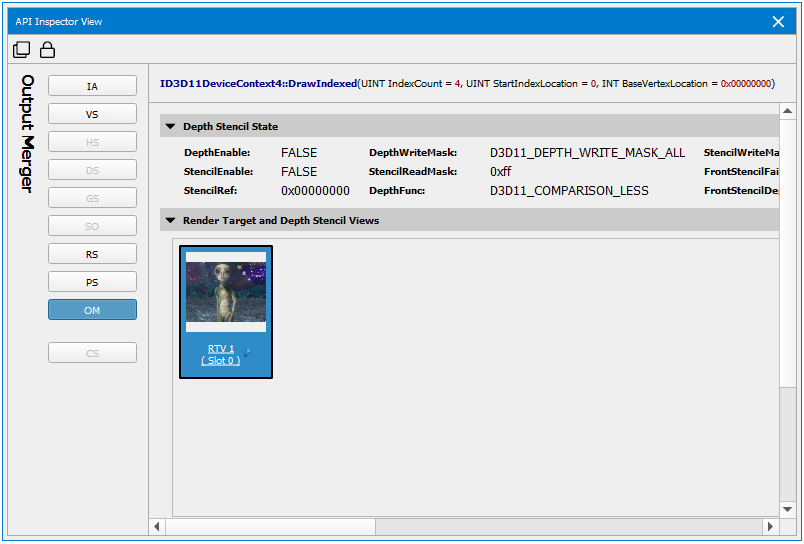
D3D12 API Inspector
The API Inspector view has an API-specific pipeline navigator that allows you to select a particular group of state within the GPU pipeline. From here, you can inspect the API state for each stage, including what textures and render targets are bound, or which shaders are in use in the related constants. Note that if a stage is not active (either there is nothing bound to that stage or it doesn’t apply for the current action) it will be greyed out, but you can still click on it to inspect the state.
Pipeline Stages
The following table shows the stages that are available for inspection:
-
IA — The Input Assembler shows the layout of your vertex buffers and index buffers.
-
VS — Shows all of the shader resource views and constant buffers bound to the Vertex Shader stage, as well as links to the HLSL source code and other shader information.
-
HS — This shows all of the shader resource views and constant buffers bound to the Hull Shader stage, as well as links to the HLSL source code and other shader information.
-
DS — This shows all of the shader resource views and constant buffer bound to the Domain Shader stage, as well as links to the HLSL source code and other shader information.
-
GS — Shows all of the shader resource views and constant buffers bound to the Geometry Shader stage, as well as links to the HLSL source code and other shader information.
-
SO — Shows the resources bound for Stream Output.
-
RS — Shows the Rasterizer State parameters, including culling mode, scissor and viewport rectangles, etc.
-
PS — Shows all of the shader resource views, constant buffers, and render target views bound to the Pixel Shader stage, as well as links to the HLSL source code and other shader information.
-
OM — Shows the Output Merger parameters, including blending setup, depth, stencil, render target views, etc.
-
CS — This shows all of the shader resource and unordered access views and constant buffers bound to the Compute Shader stage, as well as links to the HLSL source code and other shader information.
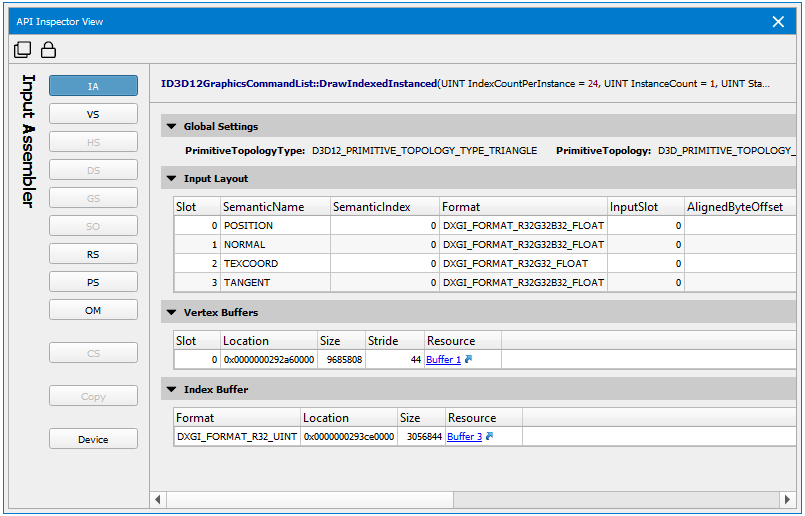
Shaders (VS, HS, DS, GS, PS, CS)
The various shader pages display all of the constant buffers, shader resource views, and input/output parameters, as well as links to the HLSL source code and other shader information.
In the constant buffer list, you can expand the buffer to see which HLSL variables are mapped to each entry, as well as the current values.
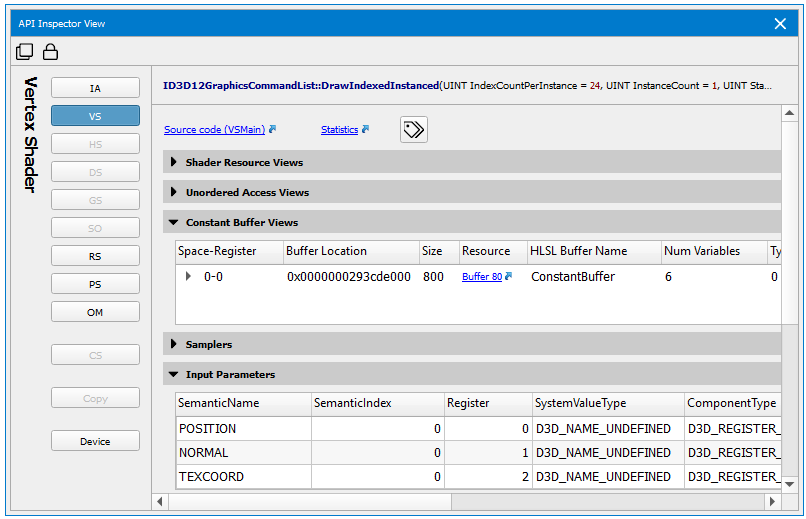
To enable resolution of HLSL variables, you must enable debug info when compiling the shader. See Shader Compilation for a discussion of the parameters required to prepare your shaders for optimal usage within Nsight Graphics.
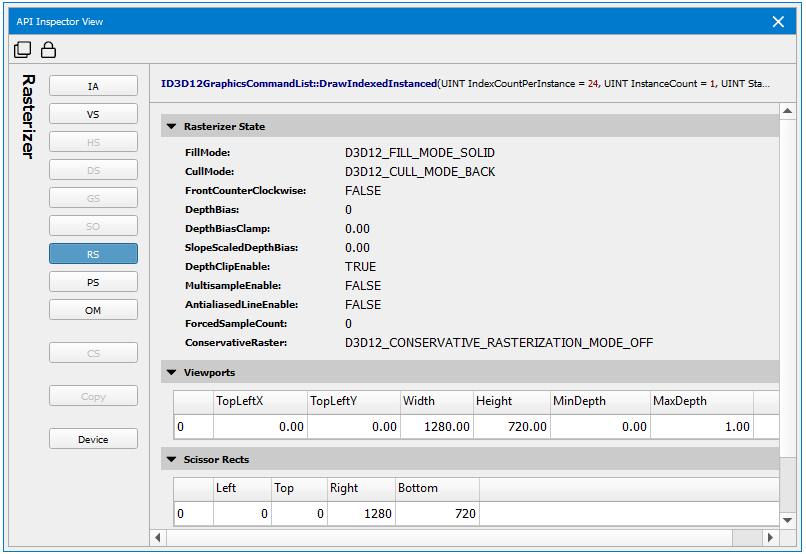
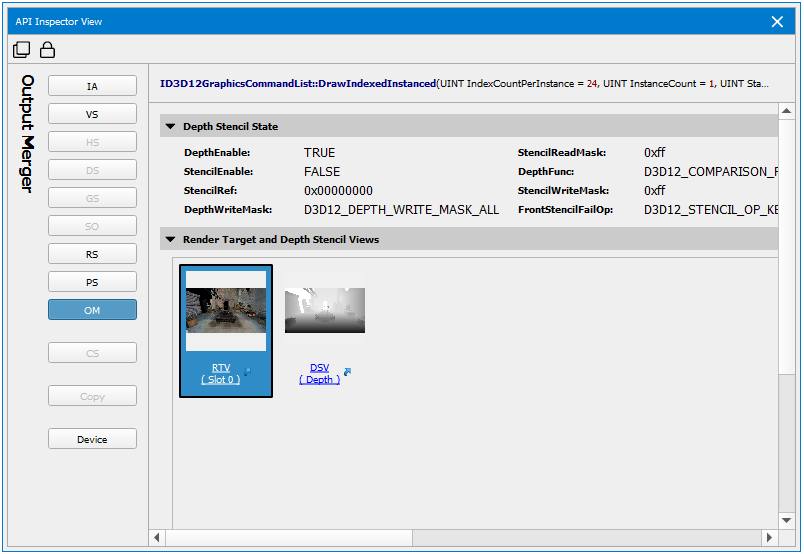
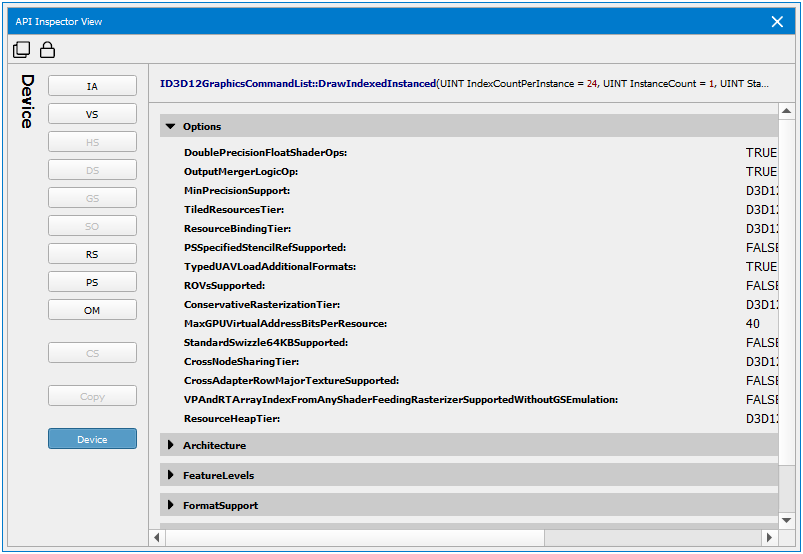
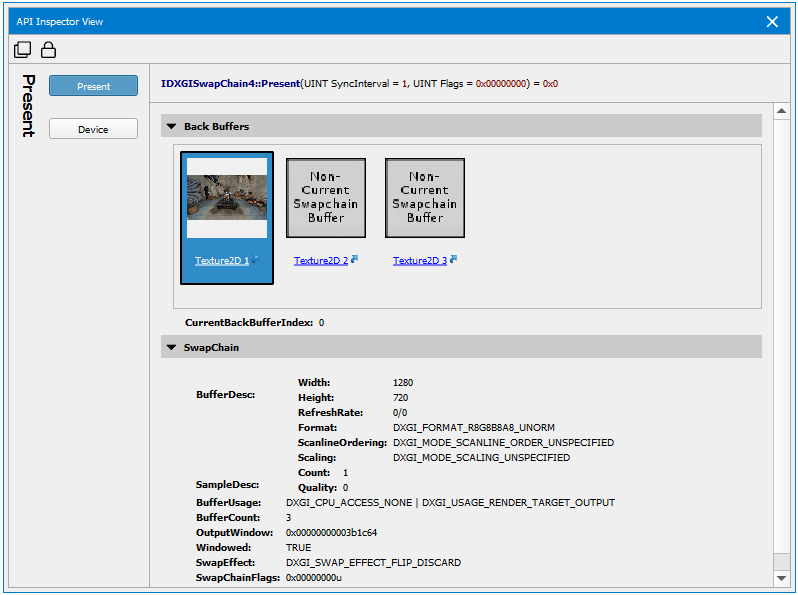
OpenGL API Inspector
When using the Frame Debugger feature of Nsight Graphics, you may wish to do a deep dive into the specific draw calls in order to analyze your application further. There are three different categories of API Inspector navigation.
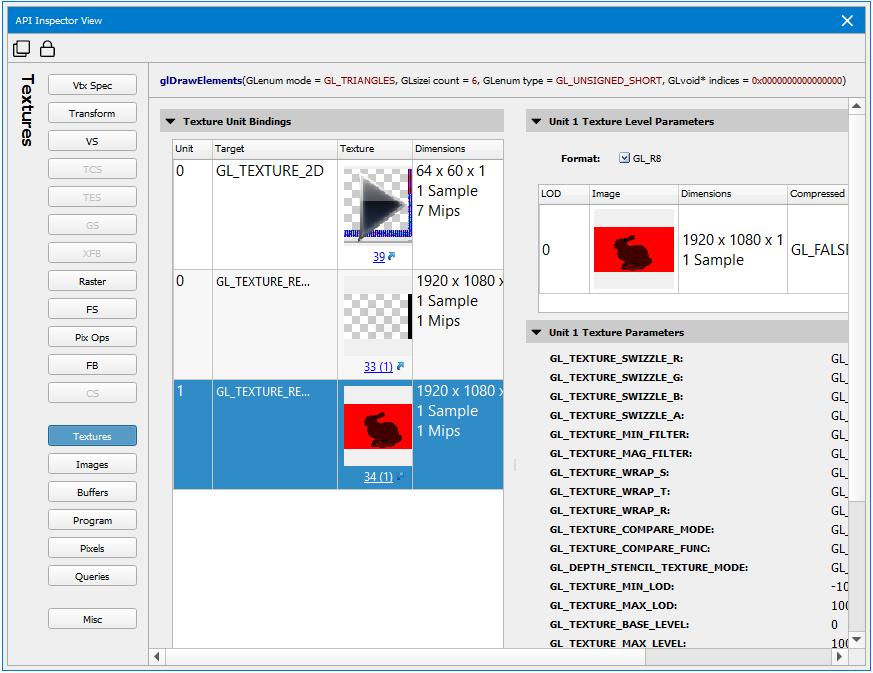
Pipeline Stages
The first category is laid out like a "virtual GPU pipeline." This pipeline section of the API Inspector consists of the following:
-
Vtx Spec (Vertex Specification) — State information associated with your vertex attributes, vertex array object state, element array buffer, and draw indirect buffer.
-
VS (Vertex Shader) — Vertex shader state, including attributes, samplers, uniforms, etc.
-
TCS (Tessellation Control Shader) — Tessellation control shader state, including attributes, samplers, uniforms, control state, etc.
-
TES (Tessellation Evaluation Shader) — Tessellation evaluation shader state, including attributes, samplers, uniforms, evaluation state, etc.
-
GS (Geometry Shader) — Geometry shader state, including attributes, samplers, uniforms, geometry state, etc.
-
XFB (Transform Feedback) — Transform feedback state, including object state and bound buffers.
-
Raster (Rasterizer) — Rasterizer state, including point, line, and polygon state, culling state, multisampling state, etc.
-
FS (Fragment Shader) — Fragment shader state, including attributes, samplers, uniforms, etc.
-
Pix Ops (Pixel Operations) — State information for pixel operations, including blend settings, depth and stencil state, etc.
-
FB (Framebuffer) — State of the currently drawn framebuffer, including the default framebuffer, read buffer, draw buffer, etc.
Object and Pixel State Inspectors
The object and pixel state inspectors section of the API Inspector consists of the following:
-
Textures — Details about all of the currently bound textures and samplers, including texture and sampler parameters.
-
Images — Details about all of the images currently bound to the image units.
-
Buffers — Details about all of the bound buffer objects, including size, usage, etc.
-
Program — Information about the currently bound program object and/or pipeline program pipeline object, including shaders, active uniforms, etc.
-
Pixels — Current settings for pixel pack and unpack state.
Miscellaneous
The miscellaneous screen contains additional information such as shader limits, implementation dependent values, transform feedback limits, and various minimum/maximum values.
Vulkan API Inspector
The API Inspector view has an API-specific pipeline navigator that allows you to select a particular group of state within the GPU pipeline. From here, you can inspect the API state for each stage, including what textures and render targets are bound, or which shaders are in use in the related constants. Note that if a stage is not active (either there is nothing bound to that stage or it doesn’t apply for the current action) it will be greyed out, but you you can still click on it to inspect the state.
Pipeline Stages
The following table shows the stages that are available for inspection:
-
Pipeline — Shows information about the currently bound pipeline object.
-
Render Pass — Shows information about the current render pass object.
-
FBO — Shows information related to the Frame Buffer Object that is associated with the current render pass.
-
IA — The Input Assembler shows the layout of your vertex buffers and index buffers.
-
Viewport — Shows the current viewport and scissor information.
-
VS — Shows all of the shader resource views and constant buffers bound to the Vertex Shader stage.
-
TCS — Shows all of the shader resources associated with the Tessellation Control Shader stage.
-
TES — Shows all of the shader resources associated with the Tessellation Evaluation Shader stage.
-
GS — Shows all of the shader resource views and constant buffers bound to the Geometry Shader stage.
-
SO — Shows the resources bound for Stream Output.
-
Raster — Shows the Rasterizer State parameters, including culling mode, scissor and viewport rectangles, etc.
-
FS — Shows all of the shader resources associated with the Fragment Shader stage.
-
Pix Ops — Shows the Pixel Operations parameters, including depth/stencil, multi-sample, and blending states.
-
Compute — This shows all of the shader resource and unordered access views and constant buffers bound to the Compute Shader stage.
-
Misc - Shows miscellaneous information associated with the instance, physical devices, and logical devices.
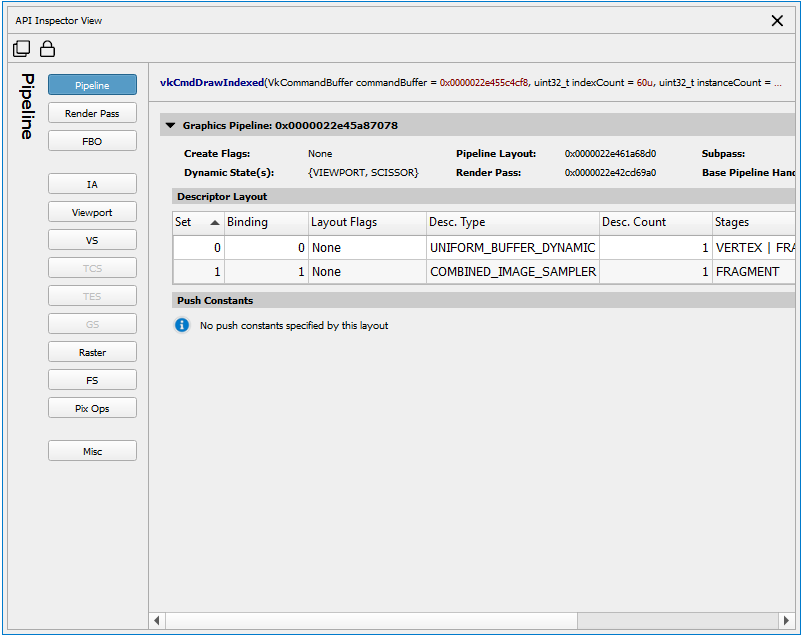
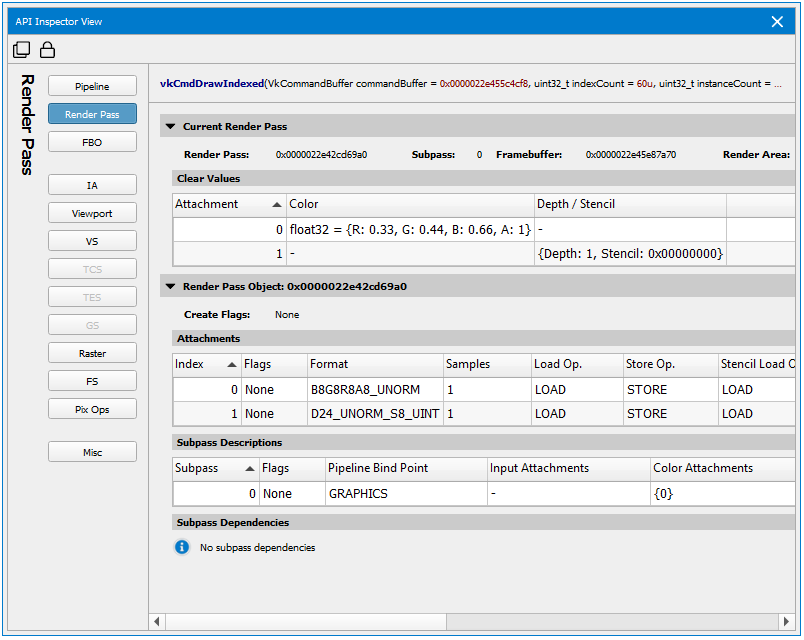
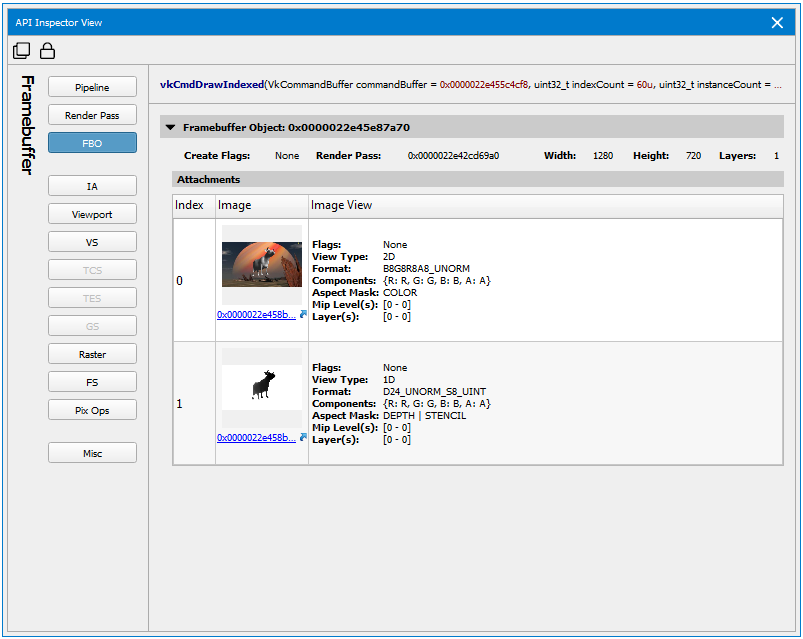
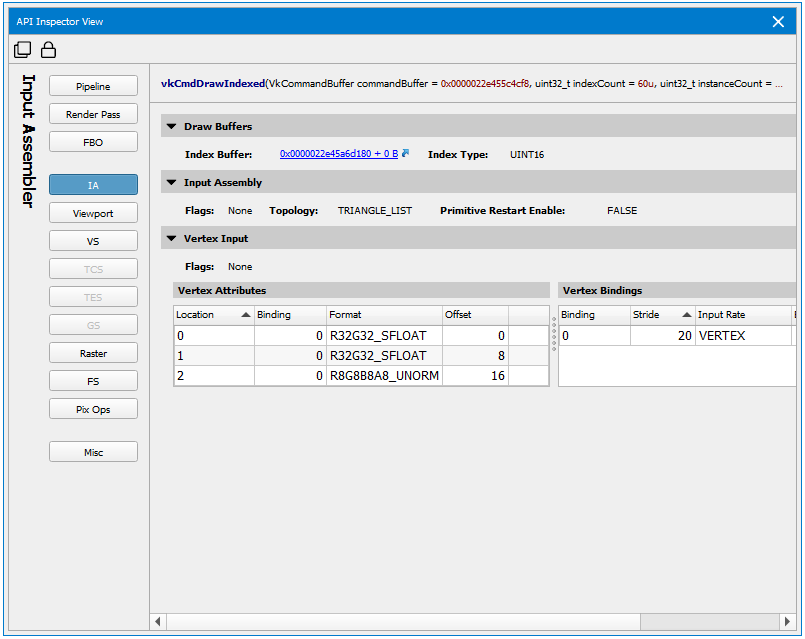
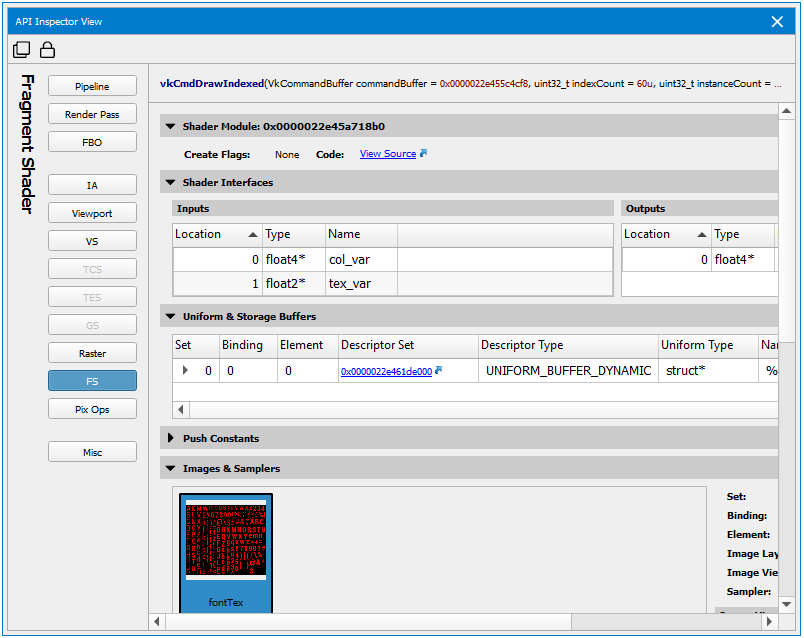
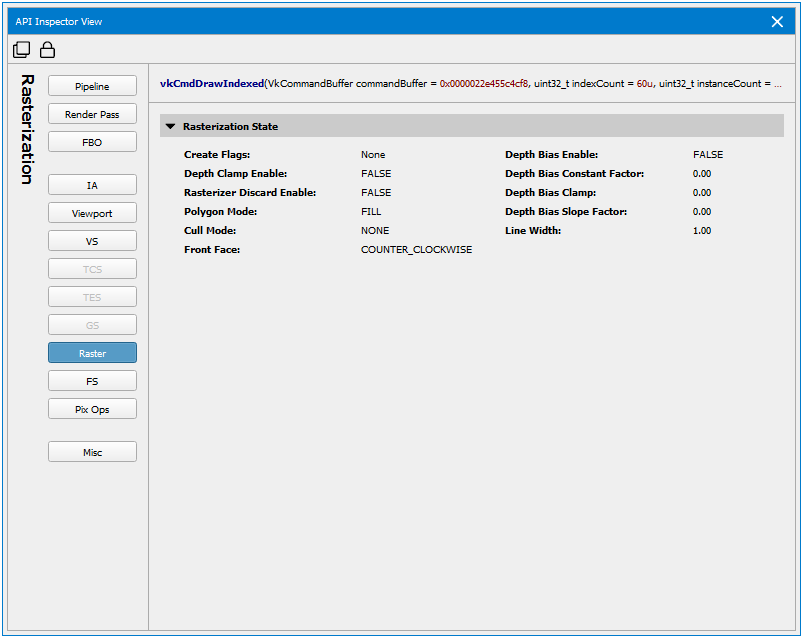
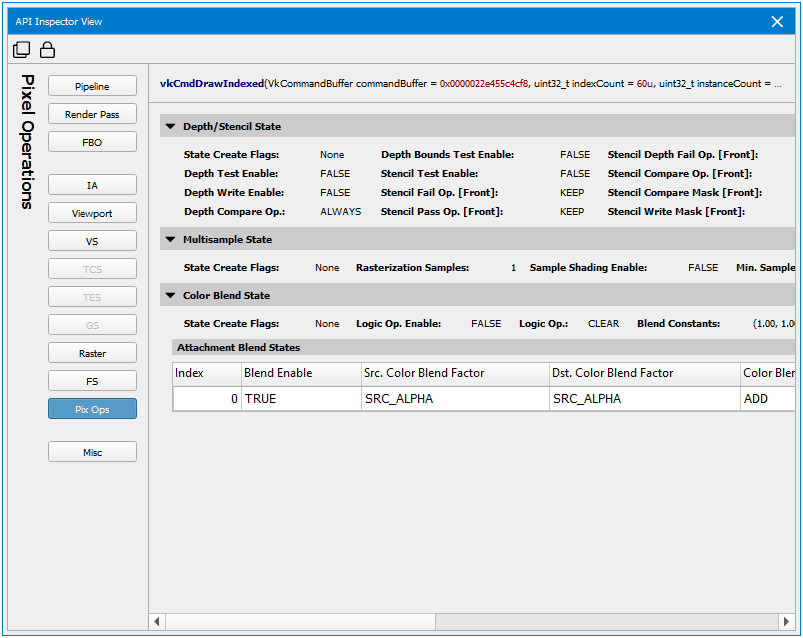
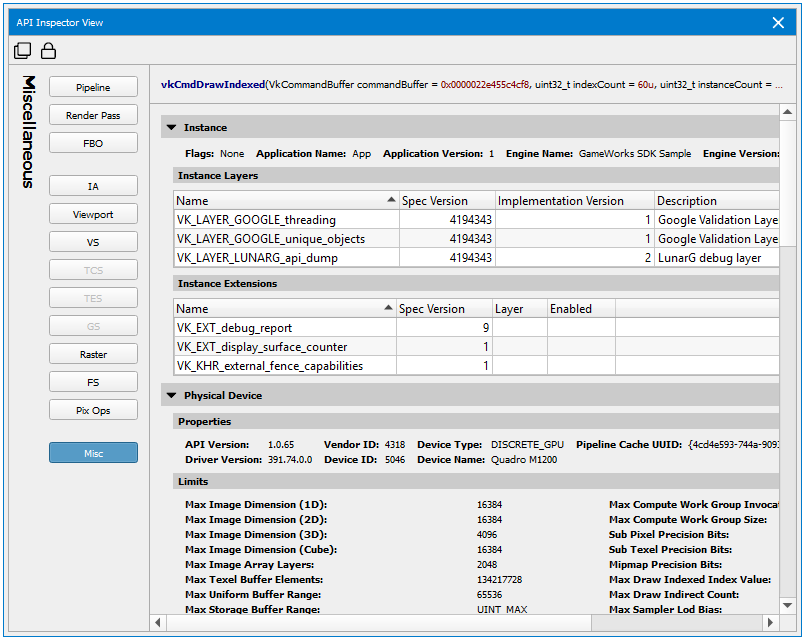
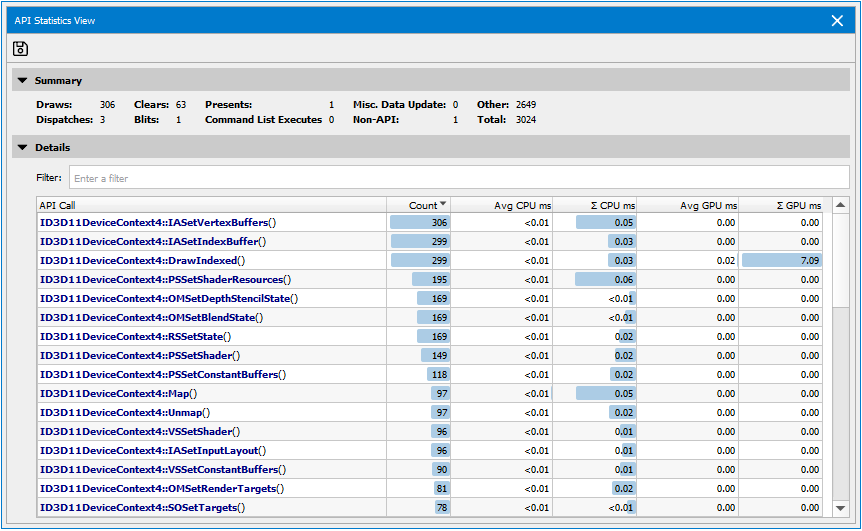
Batch Histogram View
The Batch Histogram view provides an intuitive way for the user to inspect the primitive's distribution across the draws. The draws can be configurably divided into buckets and allow for disabling or enabling. This can be useful for the user who want to know which draw is heavy and how it affects the render target.
To access this view, go to Frame Debugger > Batch Histogram.
Batch Histogram will display a histogram chart that contains divided buckets and can be configured by a few options.
-
Bucketing Mode — Determines how to divide the draws into buckets.
-
Logarithmic: Bucketing by logarithmic scale.
-
Linear: Bucketing by linear scale.
-
-
Bucketing Min/Max — Specifies the range that works for bucketing, the out-of-range events will be put into bookend buckets.
-
Bucket Count — Specifies the bucket count.
Click Buckets then the corresponding events show in the table view. You can disable or enable the events by clicking Disable All or Enable All, also can be achieved by the check-box or right-click on the table items. Besides, the linkers on the table is directed to corresponding event in Events List.
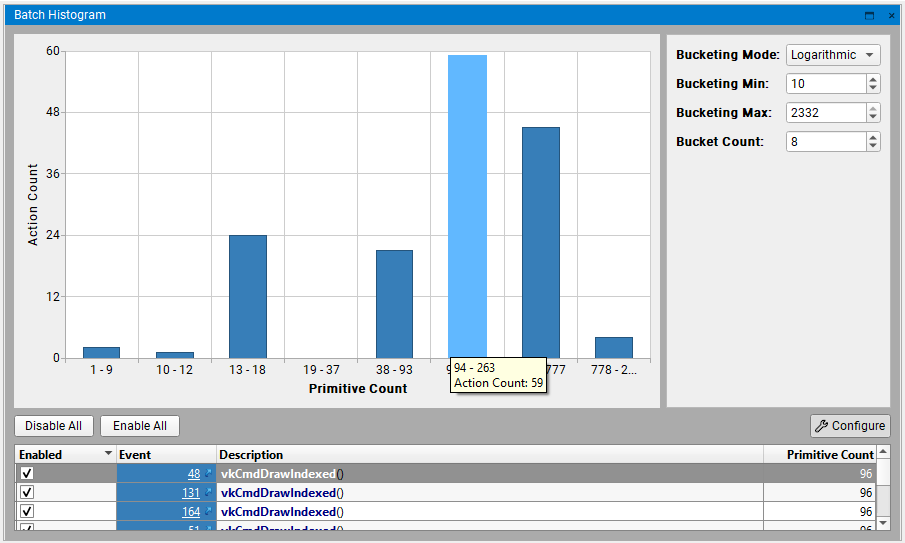
Current Target View
The Current Target view is used to show the currently bound output targets. This can be useful because it focuses in on the bound output resources, rather than having to search for them in the All Resources view.
To access this view, go to Frame Debugger > Current Target.
Current Target will display thumbnails along the left pane for all currently bound color, depth, and stencil targets. This view will change as you scrub from event to event. All of the thumbnails on the left can be selected to show a larger image on the right. You can also click the link below each to open the target in the Resource Viewer.
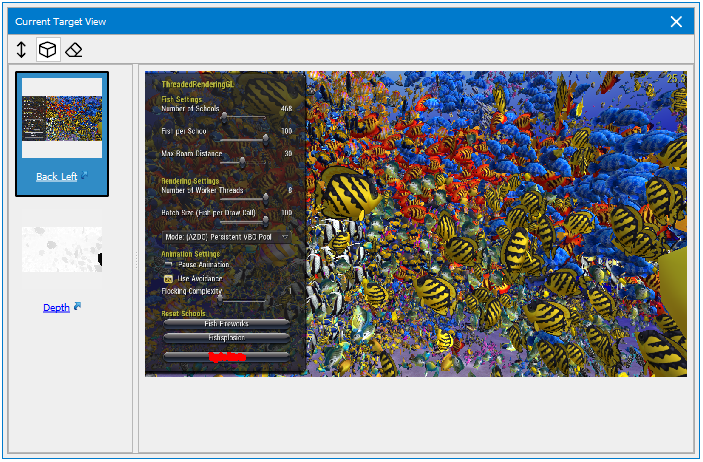
Event Viewer
The Events view shows all API calls in a captured frame. It also displays both CPU and GPU activity, as a measurement of how much each call "costs."
To access this view, go to Frame Debugger > Events.
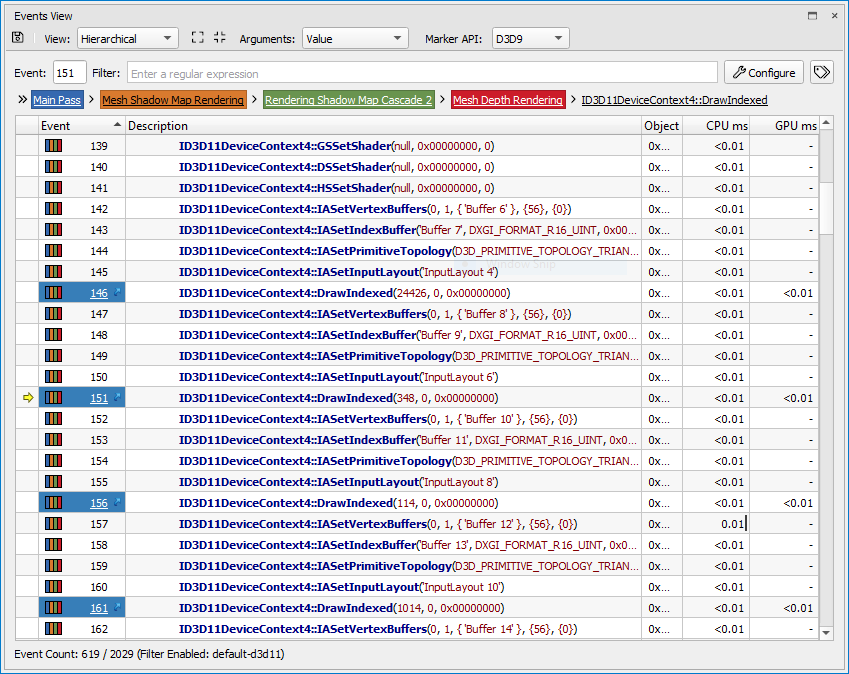
To add context to each API call, the thread ID and object/context that made that call are offered. Nsight also supports application-generated object and thread names in these columns; see Naming Objects and Threads for guidance on the supported methods for setting these names.
Clicking a hyperlink in the Events column will bring you to the API Inspector page for that draw call.
Right-clicking on an event or a push/pop range in the Events column will allow you to profile that specific event or range with the Range Profiler.
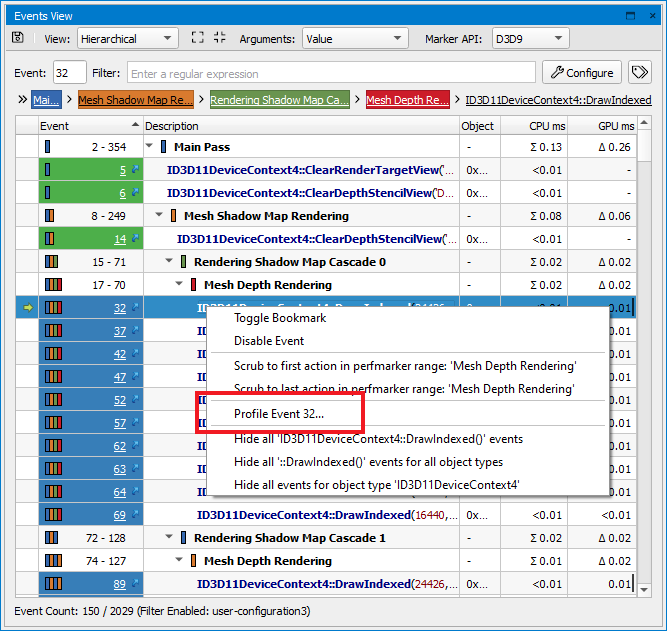
You can select whether to view the events in a hierarchical or flat view. If multiple performance marker types are used, you can select the correct one, as well as varying levels of verbosity for the call display (variable + value, value, or none). You can also sort the events by clicking on any of the available column headers.
The visibility of columns can be toggled by right-clicking on the table's header. By default some columns will be hidden if they offer no unique data (e.g. single thread) for the captured frame.
| Column | Description |
|---|---|
| (Indicator Column) | Points to the currently scrubbed event |
| (Booksmarks column) | When bookmarks are used, this column will have a visual indication of whether the row in question is bookmarked. When no bookmarks are used, this column is hidden. |
| Event | The event ID of the API call, operation, or comment for this event. On the left-hand-side, when perfmarkers are used, a perfmarker stack is visually indicated and the ID indicates the range of events contained within this hierarchy level. Hovering over this cell will show the full perfmarker hierarchy. When the event in question is an action, the right-hand-side will contain a link to open the event in the API Inspector. |
| Description | Describes the API call, operation, or comment. This column hierarchically lists the event hierarchy as controlled by the usage of Marker APIs. |
| Object | The API object (context, queue, resource, etc.) for which the event was operated on or by. |
| CPU ms | CPU timing for the event in question. When this is a perfmarker range, this indicates an aggregate summation. These timings are provided for reference, as they are not fully accurate due to the impact of capture operations on their timing. Note that tracing tools like Nsight Systems™ are targeted for higher resolution timing. |
| GPU ms | GPU timing for the event in question. Not all events will have GPU timings. For perfmarker ranges, a delta time is indicated, noting that this is an approximated aggregation of the timing of the events within it, not an absolute timing. |
| Thread | The thread that performed the API call, operation, or comment. |
| Tag | A list of meta-data tags that relate to the call in question. These typically indicate special characteristics of the call that are not evident in their API name or parameters. When no columns have tags, this column is hidden. |
| Issue | For APIs that support issue tracking (OpenGL), this column indicates whether a particular API call or operation has issues/warnings of interest. |
Filtering Events
The events view can be filtered with both a quick filtering expression as well as a detailed configuration dialog.
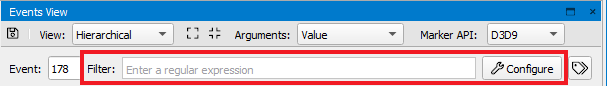
The filter input box offers a quick, regex-based match against events to find events of interest. Once entered, the view is automatically updated to match against the specified filter.
The Configure button brings up a dialog for more advanced, as well as persistent, filtering of the events in the view.
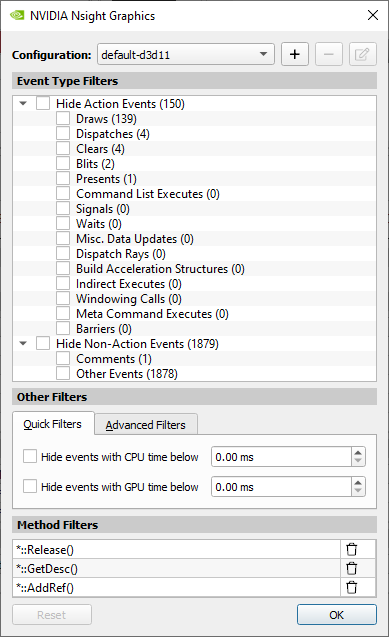
Changes within this dialog will take immediate effect. There are three major classes of filters:
- Event Type Filters - these filters allow filtering to happen on the classification of the event. For example, you may want to hide all non-action events to quickly filter to just draws, clears, and other actions.
- Other Filters - these filters allow matching against events with a particular characteristics. Additionally, the Advanced Filters tab allows for javascript-based filtering on particular columns.
- Method Filters - these filters hide methods that match against method names or object types. To add method filters, right click on an event that you wish to hide and select one of the hiding capabilities within the view.
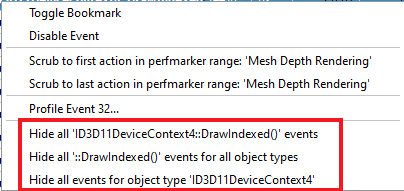
Filter Persistence
Filters set by the filter configuration dialog will persist from session to session. Additionally, if multiple filter configurations are desired, you may save different named versions and recall them quickly by name.
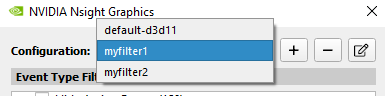
Filters entered into the main filter-input box are not persisted, as these filters are meant for quick filtering of the event data.
Regex Syntax
For entries that support regex syntax, the syntax is implemented with a perl-compatible regular expression language. Here are some examples of common tasks and the expressions that achieve them:
JavaScript Syntax
The Advanced Filters configuration dialog supports JavaScript syntax. This enables complex evaluation of filtering expressions. The basic approach for JavaScript expressions is to match a particular column of data against an expression. Columns are "accessed" via a $('ColumnName') expression. For example, a column titled "Description" is accessed via $('Description'). From there, you can perform mathematical, logical, and text-matching expressions. See some examples below to demonstrate the power and usage of these expressions:
| Task | Expression |
|---|---|
|
Match against the description column for draw |
/::Draw/.test($('Description')) |
|
Find events with non-zero GPU time |
$('GPU ms') > 0 |
|
Find odd events |
($('Event') % 2) == 1 |
|
Find non-draw events with non-zero GPU time |
/::Draw/.test($('Description')) != 1 && $('GPU ms') > 0 |
Bookmarking
While filtering, it is often desired to keep the context of certain items while you find others. To prevent an event from being filtered, Right Click the event and select Toggle Bookmark.
Alternatively, you can Double Click or use Ctrl + B to bookmark the currently selected event. To navigate between bookmarks, use Alt + Up and Alt + Down.
If you wish to see the filtered results on the scrubber, you can select the tag button to the right of the filter toolbar, and a new row will appear in the Scrubber that displays your filtered events, allowing you to navigate those events in isolation.
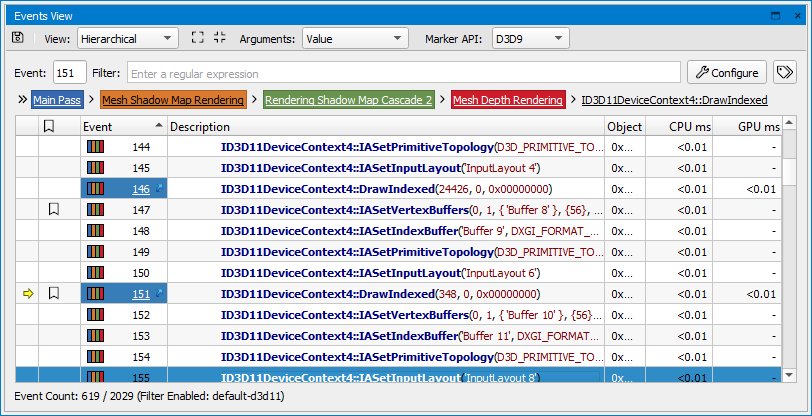
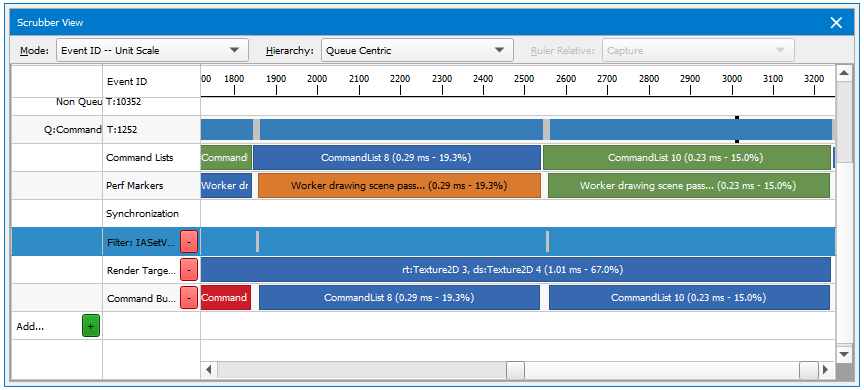
Perf Markers
On the Events page, you can use the hierarchical view to see a tree view of performance markers. The items listed in the drop-downs correspond with the nested child perf markers on the Scrubber.
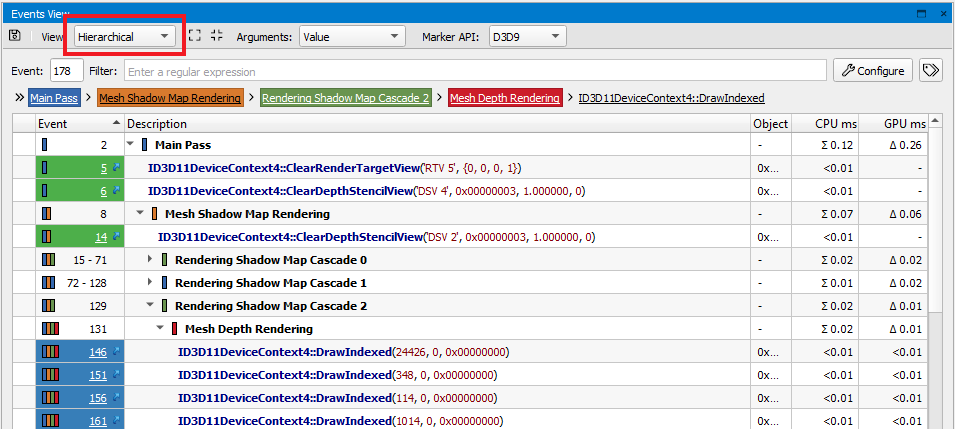
If you use the flat view on the Events page, the perf marker won't be nested, but you can hover your mouse over the color-coded field in the far left column, which allows you to view the details about that perf marker.
When an application uses multiple kinds of perf markers, the Marker API allows selecting the API to use for the display. This situation may arise if the application uses a middleware, for example, or mixes components with different marker strategies.
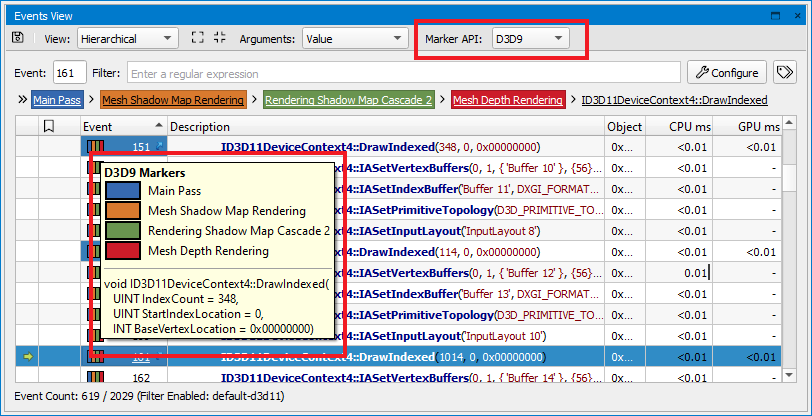
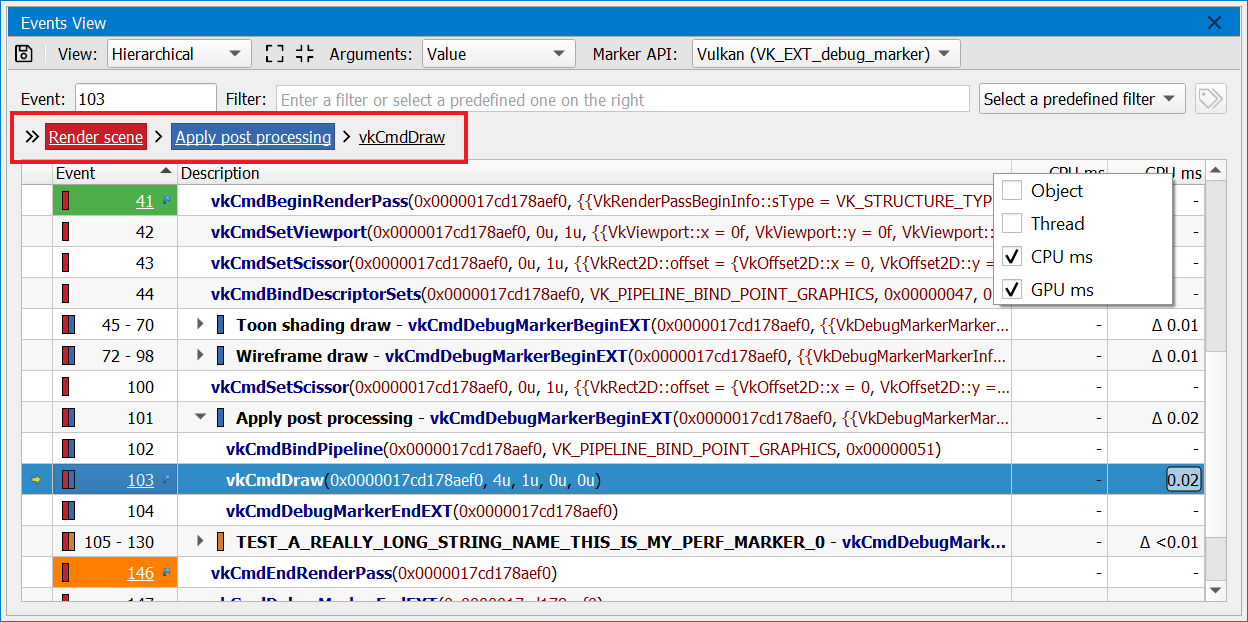
Event Details
The Event Details view shows all parameters for the current event in a hierarchical tree structure that allows for searching.
To access this view, go to Frame Debugger > Event Details.
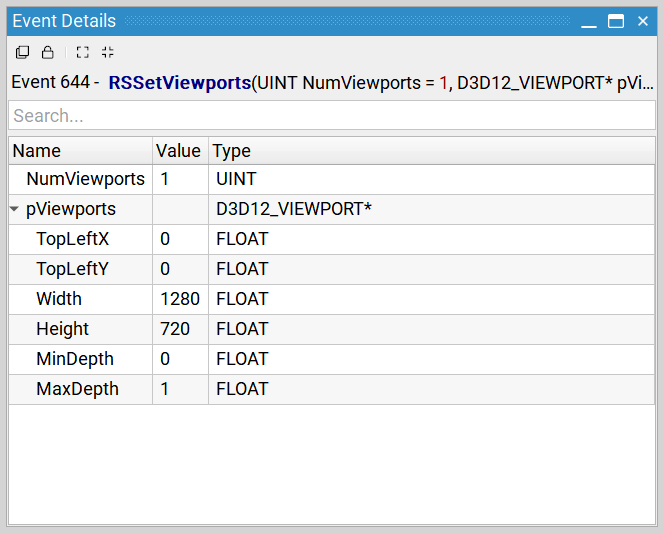
Because this window shows parameters for the current event, it will change as you navigate the scene. If you wish to keep the parameters for comparison against another call, the view supports Clone and Lock capabilities.
Geometry View
The Geometry view takes the state of the Direct3D, OpenGL, or Vulkan machine, along with the parameters for the current draw call, and shows pre-transformed geometry.
To access this View, go to Frame Debugger > Geometry.
There are two views into this data: a graphical view and a memory view.
Graphical Tab
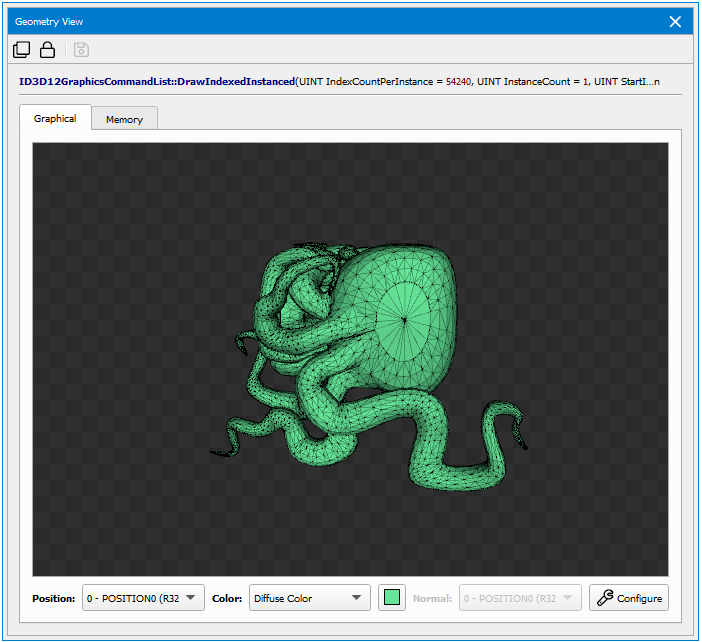
Attribute Options
-
Position — Specifies the vertex attribute to use for positional geometry data.
-
Color — Specifies how to color the geometry. If Diffuse Color is selected, the selected diffuse color swatch will be used for coloring. If a vertex attribute is selected, the selected attribute will be used for per-vertex coloring.
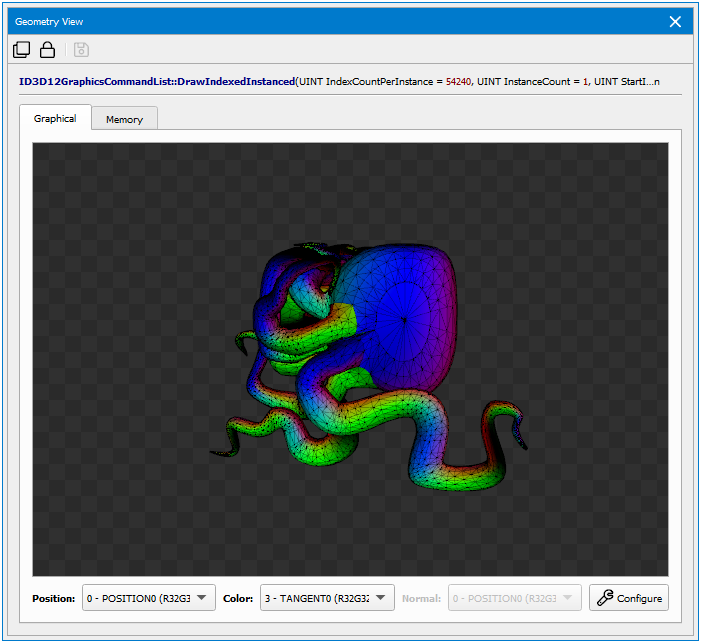
-
Normal — Specifies the per-vertex normal. This selection applies when using a shade mode that specifies Normal Attribute or when rendering normal vectors.
Rendering Options
Clicking Configure in the bottom right corner of the Geometry View will open up the rendering options menu.
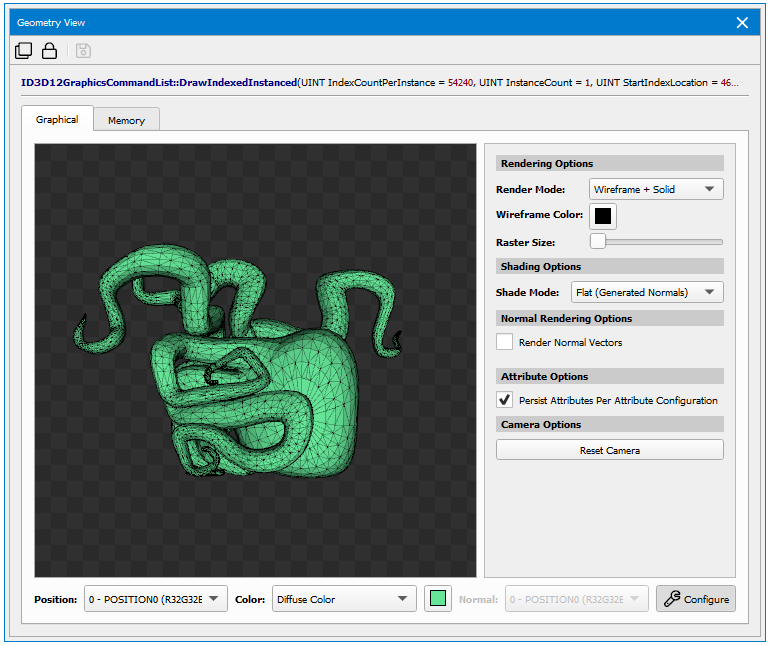
-
Reset Camera — Resets the camera to its default orientation. By default, the viewer bounds all geometry with a bounding sphere for optimal orientation.
-
Render Mode — Determines how to render and raster geometry.
-
Solid: renders filled geometry.
-
Points: renders a vertex point cloud.
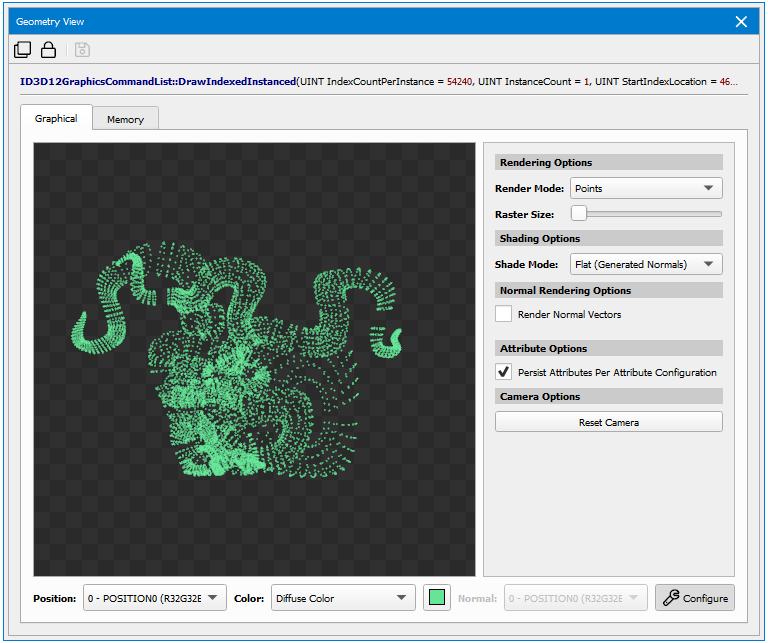
-
Wireframe: renders a wireframe of the geometry.
-
Wireframe + Solid: renders filled geometry with a wireframe on top of it.
-
-
Shade Mode — Specifies the lighting mode of the rendered image.
-
Selected Color Attribute: Shades with the specified color attribute
-
Flat Shading Using Generated Normals: Renders the geometry using flat shading with calculated normals
-
Flat Sharing Using Normal Attribute: Renders the geometry using flat shading with the specified Normal Attribute.
-
Smooth Shading Using Normal Attribute: Renders the geometry using smooth shading with the specified Normal Attribute.
-
-
Render Normal Vectors — Renders the specified normal attribute as a vector pointing from each vertex. The vector may be colored by the Normal Color selection and may be scaled by the Normal Scale selection.
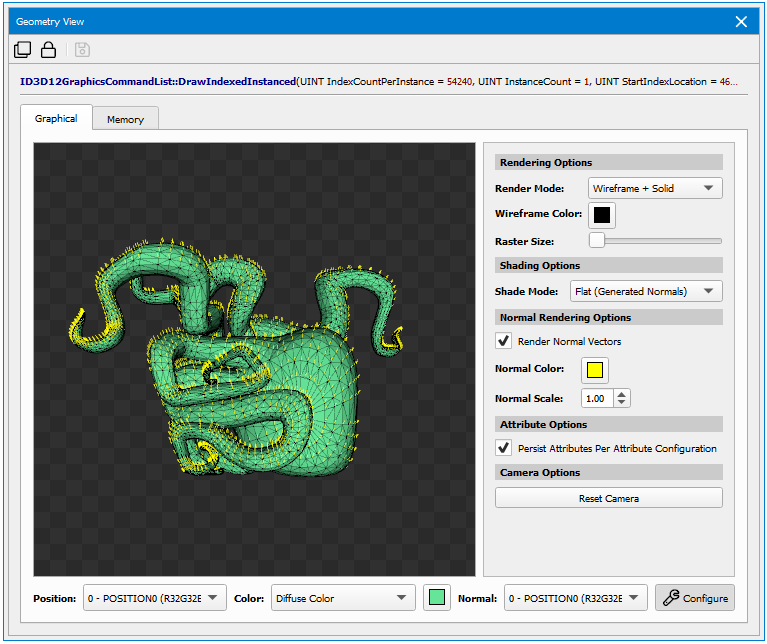
Memory Tab
The Memory tab of the Geometry View shows the contents of the vertex buffer, as interpreted by the current vertex or input attribute specification. This view is useful for seeing the raw data of your draw call. An additional capability of this view is that it highlights invalid or corrupt vertices to streamline finding problematic data.
There are two modes of display for the geometry data:
-
Index Buffer Order shows the vertices as indexed by the current index buffer and current draw call.
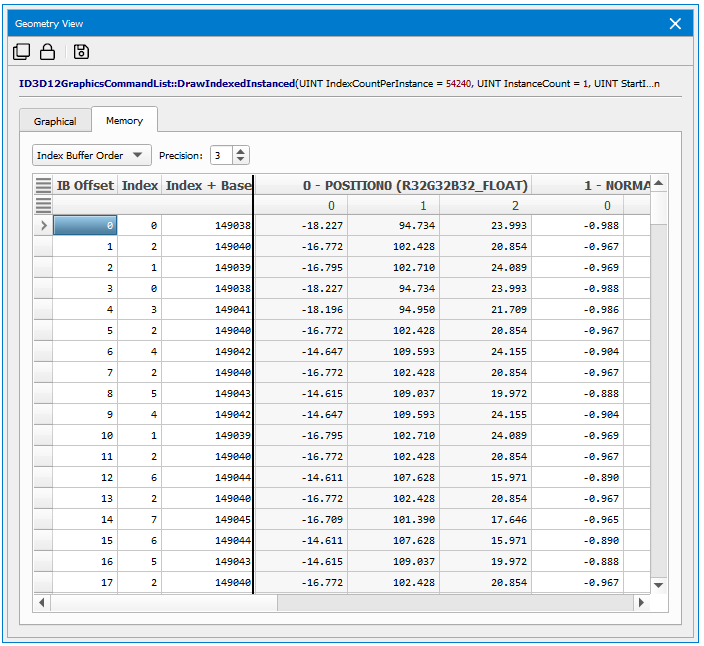
-
Vertex Buffer Order shows the vertices as linearly laid out from the start of the vertex buffer and draw call specification.
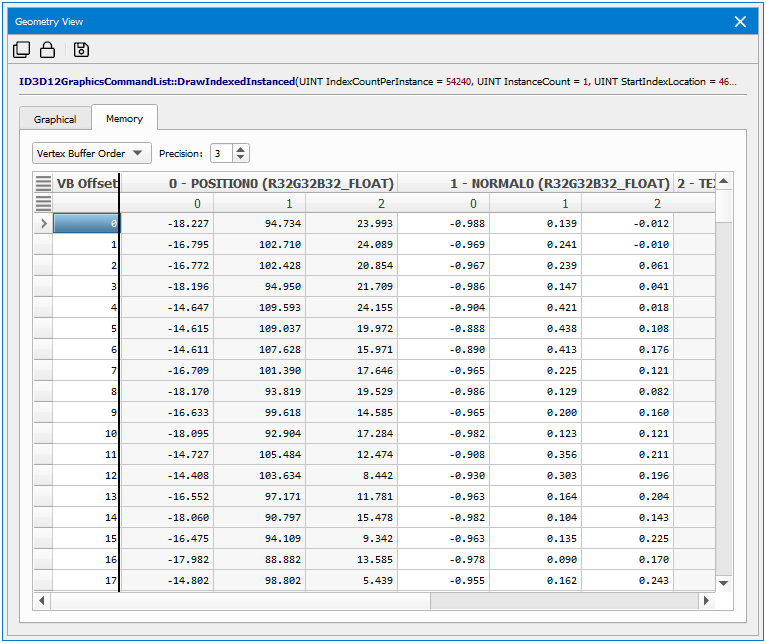
Range Profiler
The Range Profiler is a powerful tool that can help you determine how various portions of your frame utilize the GPU, and give you direction to optimize the rendering of your application. Once you have captured a frame, the Range Profiler displays your frame broken down into a collection of ranges, or groups of contiguous actions. For each range, you can see the GPU execution time, as well as detailed GPU hardware statistics across all of the units in the GPU. The Range Profiler also includes unmatched data mining capabilities that allow you to group calls in the frame into ranges based on various criteria that you choose.
To access this view, go to Frame Debugger > Range Profiler.
Note that the legacy Range Profiler, that is not user configurable, is still available. From the same menu, simply select Range Profiler (Legacy). This will be removed in a future release.
The Range Profiler initially appears with the Range Selector at the top, followed by 5 default sections below that: Range Info, Pipeline Overview, SM Section, Memory, and User Metrics.
Range Selector
The Range Selector provides an overview of the various rendering activities or passes in the scene. You can see how long each portion of the frame takes, and compare the length or cost of the ranges on the timeline. When it first opens, the Range Selector will show ranges based on the performance markers you have instrumented your application with. The tool supports various APIs for instrumentation, including the NVIDIA NVTX library, Khronos' KHR_debug, or any other range definition API supported by your graphics API of choice. While performance markers are the best way to specify ranges and are utilized throughout the entire Nsight Graphics, UI, there are other facilities for creating ranges on the fly. The Range Selector Clicking the Add... button will open a dialog that allows you to select what type of range you want to add.
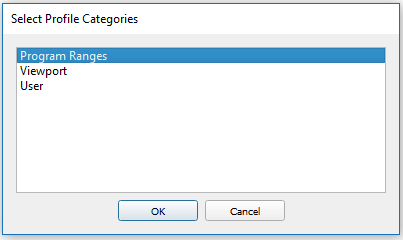
-
Program ranges — Actions that use the same shader program.
-
Viewport ranges — Actions that render to the same viewport rectangle.
-
User ranges — A range defined by you on the fly. Use SHIFT + left-click and drag the scrubber on the created "User" row to create a new range. This can be helpful to drill into a section of the scene, or to compare different frame sections that don’t already have ranges defined for it.
When you click on a range on the Scrubber portion, the other sections of the Range Profiler View will automatically update with that selected range's information. You can also click on a single action in the Scrubber to profile only that action.
Sections
The Range Profiler comes with 5 default sections: Range Info, Pipeline Overview, SM Section, Memory, and User Metrics Section. The section headers have a small triangle to the left of the name that allows you to collapse or open each one. The sections have a different look when collapsed vs open, mainly giving high level information when collapsed, and fuller data when opened. Some of these sections also have combo boxes on the right side of the section header that allows you to choose the different visualizations available for displaying the data. Finally, there are tooltips enabled on the metrics, which can give further details on what is being measured.
Range Info
The Range Info section gives you basic information about the selected range, split up with the draw calls on the left-hand side, and the compute dispatches on the right-hand side. For the draw calls, there is the number of calls in the range as well as the number of primitives and pixels rendered, both total and average per draw call. On the compute side, there is similarly the number of calls, as well as thread and instruction counts, both total and average.
When you open up the section, there is a table that has many of the metrics on the collapsed view, and adds some additional metrics for primitive counts, z-culling, etc.
Pipeline Overview
The Pipeline Overview section gives an overview of how the selected ranges utilized the GPU. It does this by calculating a througput or Speed of Light (or SOL) for each unit in the pipeline.
Speed of Light (SOL): This metric gives an idea of how close the workload came to the maximum throughput of one of the sub-units of the GPU unit in question. The idea is that, for the given amount of time the workload was in the GPU, there is a maximum amount of work that could be done in that unit. These values can include attributes fetched, fragments rasterized, pixels blended, etc. Any value less than 100% indicates that the unit did not process the maximum amount of work possible.
When you open the Pipeline Overview section, you are presented with a visual representation of the GPU pipeline, and color bars indicating the SOL or throughput for each unit represented. You can use the combo box on the right side of the header to display a table of metrics for every action in the currently selected range.
SM Section
When collapsed, the SM Section has 2 main columns of data. On the left is a list of metrics about how utilized the SM (shader) units are in the GPU. SM Active tells you how many cycles the SM active and working during the measurement timeframe. SM Active Min/Max Delta gives an idea of the variance of work across all of the shader units in the GPU. If this value is low, this indicates that the workload is running only on a few SMs, either because of screen locality for pixel work or possibly that a compute dispatch was so small that it only occupied a small portion of the shader unit. The SM Throughput for Active Cycles indicates the same value as the throughput or SOL value in the Pipeline Overview, but only measures it when the shader unit is active. Finally, the SM Occupancy value gives you a percentage of how full the shader unit was with warps. Occupancy is key to hide latency, and things like register count and local memory usage in shaders can limit the number of warps. When there is not a warp eligible to issue an instruction, the SM is not able to do any work.
Related to the occupancy value, the right hand side shows typical instruction stall reasons, including long scoreboard (when the shader was waiting on a texture access), barrier (when the shader was waiting for other warps to get to a given instruction), etc.
When you open the SM Section using the top left triangle, you will see a table that includes SM statistics on the left, including thread mix based on shader type, and all of the warp stall reasons on the right.
Memory
The Memory section displays information about the L2 cache and Frame Buffer or memory unit. Each interface has a maximum throughput for a given amount of time. The memory section shows the percentage of the subsystem interfaces utilized for the current range.
When you open the section using the upper left triangle, you will see a diagram of the memory subsystem and the percentage indicating the amount of bandwidth our throughput each unit/interconnect utilized in the sampling experiment.
User Metrics Section
The User Metrics Section gives the user the opportunity to explore all of the metrics that are available in the Range Profiler. It is initially collapsed, but when you click the upper left triangle, 2 tables will appear. The left hand table lists the metrics with their name and a short description, as well as a check box to enable that metric for measurement. You can search for metrics of interest by using the filter box above the metric list. This will filter the metrics to a subset that matches the text you specify, which can be a GPU unit name, part of a metric value, etc.
When you select a metric, you will see a new entry appear in the right hand side table. Initially, you will likely see "…" appear for the value, which indicates that the tool is running the necessary experiments to retrieve the value. Once that is complete, the value will fill in.
Above the metric value table is a Transpose button. You can use this to transpose the table from column to row major and back.
Configuring The Range Profiler
The Range Profiler is user configurable via editing .section text files or .py python scripts.
By default, Nsight Graphics™ ships with 4 .section files and 1 .py file. The .section files are able to display metrics only. The .py files can do everything the .section files can do (albeit with different syntax), and can also define rules. More on that below.
Each section can have a collapsed or Header view, and an expanded or Body view. The default sections, in order of display, contain the following information:
| Section | Header | Body |
|---|---|---|
|
RangeInfo.py |
Table of draw & dispatch values |
Table of more detailed values |
|
PipelineOverview.section |
Table of values for SOL, etc. |
Pipeline Diagram |
|
Shaders.section |
Table of shader details |
Table of more detailed values |
|
SMSection.section |
Table of high-level metrics and common stall reasons |
Table with more SM details and all stall reasons |
|
MemorySection.section |
Table of cache hit rates, etc. |
Memory Diagram |
|
UserMetrics.section |
Empty |
User Metrics tables |
The view can be modified on the fly by clicking the wrench icon in the toolbar. This will bring up a dialog that allows you to enable/disable the available list of metrics on the top, as well as specify what directories to load section files from and enable/disable the paths on the bottom.
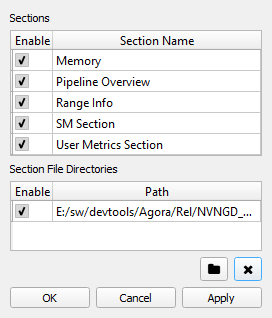
If you click Apply, the view will reload with your new choices, but the dialog will remain open for further editing. If you click OK, the view will similarly be updated, but the dialog will also be closed. Finally, Cancel will close the dialog and discard any changes that were not applied.
If you make edits to the .section or .py files and save them, the view will automatically detect the file change(s) and reload the view. When loading or reloading the sections, if there is an error detected, a new section will appear at the top of the view that contains any errors:
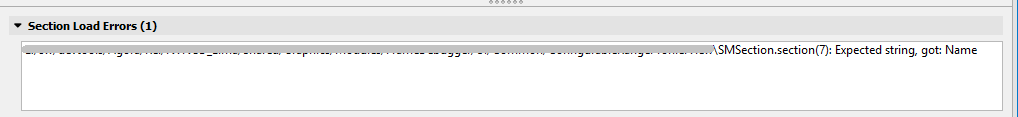
The section files have a simple syntax:
Identifier: "Name"
DisplayName: "Name"
Order: 100
Header {
    Metrics {
        Label: "L2 SOL"
        Name: "lts__throughput.avg.pct_of_peak_sustained_elapsed"
    }
Body {
    Items {
        Table {
            Label: ""
            Rows: 1
            Columns: 2
            Metrics {
                Label: "SM Active"
                Name: "sm__active_rate"
            }

            Metrics {
                Label: "SM Warp Can't Issue Allocation"
                Name: "smsp__warps_cant_issue_allocation_stall_per_warp_active.pct"
            }
        }
    }
}
The Identifier field is used as a global identifier for the section file. The DisplayName is what you will see displayed in the header for the UI. You can keep both of these the same, or use different names if desired. The next field is the Order. This is used to specify the display order of the sections in the view with lower numbers coming first and higher numbers coming last.
Next is the Header portion. This is what you will see displayed when the section is in "collapsed" mode. You can put any number of Metric entries in this portion, and it will display the values for the Metric specified by Name with a user-friendly Label.
Finally, there is the Body section. This is what will be displayed when the section is opened by clicking the triangle on the left-hand side of the section header. There are some default bodies, including "Table," "BarChart," "HistogramChart," and "LineChart." All of these take lists of metrics, very similar to the header section, and will display the metrics in various tables and charts. The SMSection.section is an example of a table that displays a list of metrics. There are 2 special body types, GfxPipelineDiagram, and GfxMemoryDiagram, that will display specialized diagrams of the GPU pipeline and require a mapping from the Label to the metric used for determining the value to display. If you wish to use them in your own section files, we suggest you copy them as is from their corresponding section files. Also, there is an additional special body type, GfxUserMetrics. This does not take a list of metrics, but instead displays two tables, one on the left that has all of the metric names and checkboxes to enable/disable displaying the values in the right-hand table.
The RangeInfo.py script is an example of specifying a section via Python. The syntax is a bit more complex, but the script allows you to also specify rules that will be evaluated that can be helpful for pointing out interesting metric values. At the top of the RangeInfo.py file, you will see classes for Metric, SectionTable, BodyTableItem, etc. — basically everything that is before the "class RangeInfo" portion. These are all helper classes used by the main class. In the RangeInfo, you will see a Header class, which is used to define what metrics will be displayed in the header portion of the UI, similar to the .section files. This takes a list of metric and label pairs.
Below the Header is the Body class. This is similar to the Body in the .section file and is used to put whatever type of body you would like to display. In the RangeInfo.py file, you will see a BodyItemTable that specifies the name of the table ("" or blank in this case), the number of columns (2), and a collection of metrics to display in the table.
Finally, you will see more control code to initialize the class in the script, including the header and body portions, and load the section. Below that portion is a number of accessory functions to retrieve elements like the name and identifier of the section (similar to the .section file), and the "apply" function. This portion is used to define a rule. The top portion is more boiler plate code to gain access to the data for the currently selected range. Then, the rule samples two values: drawCount and dispatchCount. From there, it defines two rules. First, if the draw count exceeds 500, it will display a MsgType_MSG_WARNING saying there are a large number of draw calls. Then, as another example, if the drawCount is greater than the dispatchCount, it will say more draw calls than dispatches, and vice versa if the dispatchCount exceeds the drawCount.
Known Issues
- After a few edits, the file watch functionality seems to disconnect. You can close and reopen the view to force a refresh of the sections.
- The sections can only display simple metrics as enumerated by the LOP library that supplies the data. We have implemented some specialized metrics to get values like the Tex Hit Rate. We are looking to expose this capability for "compound metrics" in a future version.
- The sizing of various portions of the dialog are either fixed or do not re-size cleanly. We will improve that in a future release.
- The current set of rules is very rudimentary. We are actively developing the rule set and will be adding to those in future releases.
Resource Viewer
The Resource Viewer allows you to see all of the available resources in the scene. This view is brought up by clicking resource links in any frame debugging view.
The Resource Viewer is opened through links from resource thumbnails or entries in many Nsight views, for example from the API Inspector or All Resources View.
Once opened, there are two tabs available:
-
Graphical
-
Memory
Graphical Tab
The Graphical tab allows you to inspect the resource, pan using the left mouse button to click and drag, zoom using the mouse wheel, and inspect pixel values. Also, this is where you can save the resource to disk. If supported on your GPU and API, this is also where you can initiate a Pixel History session to get all of the contributing fragments for a given pixel.
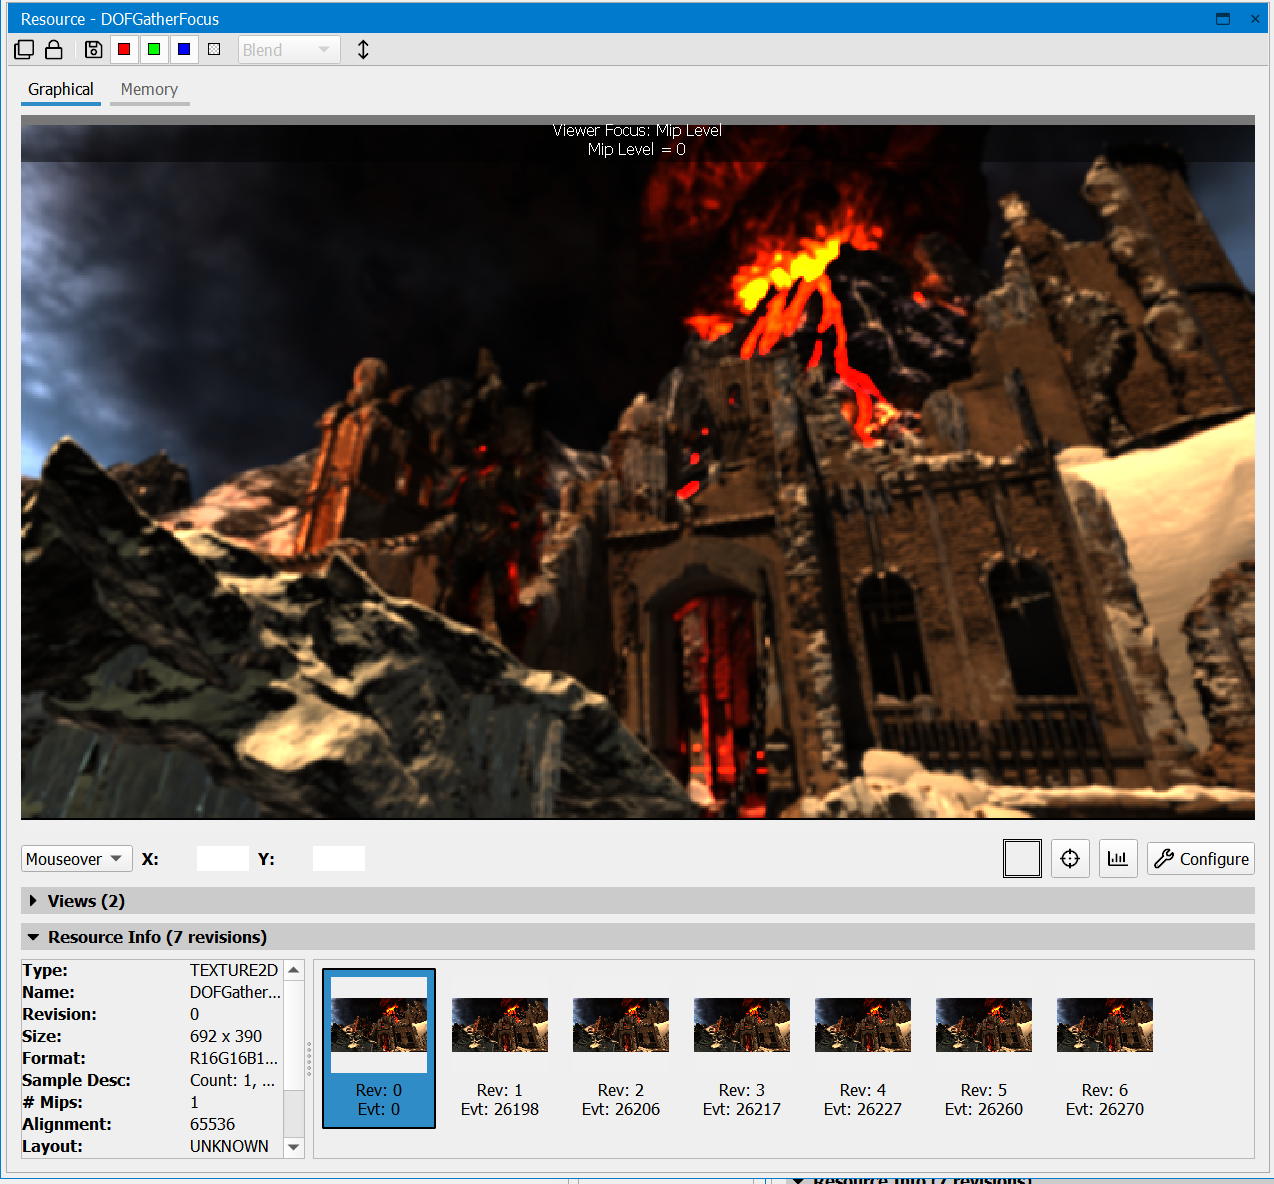
When you have selected a buffer from the left pane, the Show Histogram button will be available on the right side of the Graphical tab, which allows for remapping the color channels for the resource being viewed.
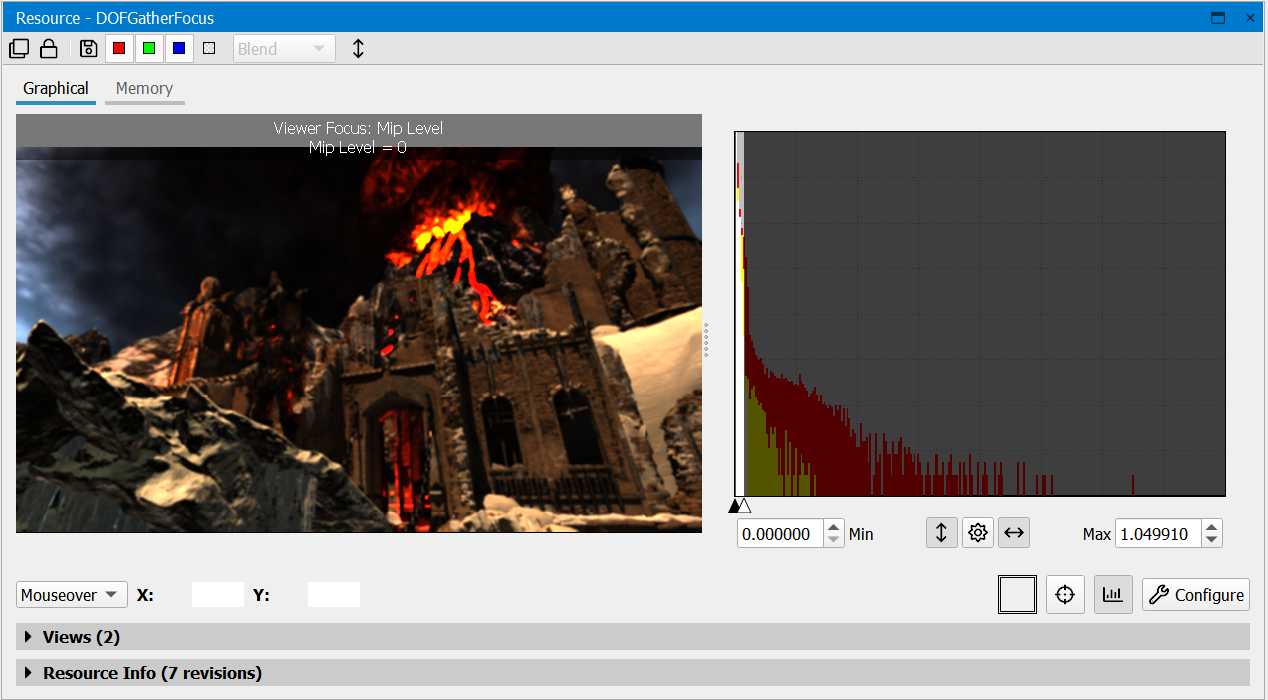
To modify the histogram view, the following options are available:
-
You can set the minimum and maximum cutoff values via the sliders under the histograms, or by typing in values in the Minimum and Maximum boxes.
-
You can change the scale by using the Log button.
-
The Luminance button allows you to visualize luminance instead of color values.
-
The Normalize button can preset the minimum and maximum values to the extents of the data in the resource.
Memory Tab
The Memory tab shows a dump of the resource data.
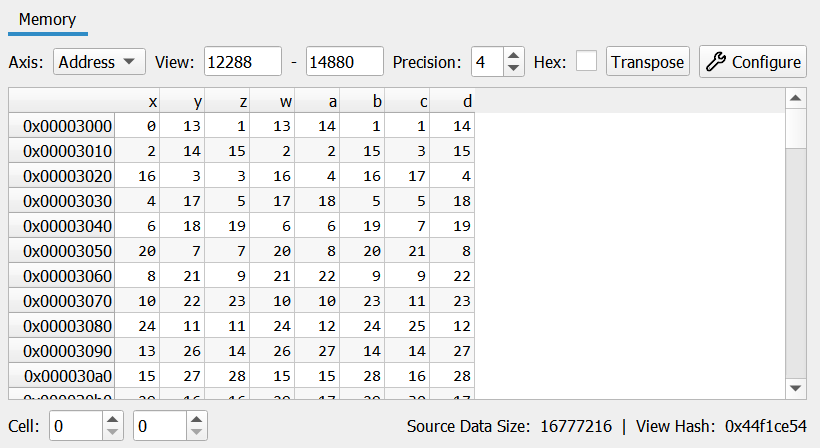
You can use multiple options to configure how this memory is displayed:
-
The Axis drop-down changes between address (memory offset) and index (array element) views.
-
The Offset entry limits the view to an offset within the given resource.
-
The Extent entry limits the view to a maximum extent within the given resource.
-
The Precision spin box controls the number of decimal places to show for floating point entries.
-
The Hex Display toggles between decimal (base-10) and hex (base-8) display formats.
-
Hash shows a hash value representative of the given memory resource within the current offset and extent. This is useful for comparing memory objects or sub-regions.
-
The Transpose button swaps the rows and columns of the data representation.
-
The Configure button opens the Structured Memory Configuration dialog.
Additional Capabilities
There are a number of additional capabilities in this view. At the top of the viewer, you'll find a toolbar:
-
Clone — makes a copy of the current view, so that you can open another instance.
-
Lock — freezes the current view so that changing the current event does not update this view. This is helpful when trying to compare the state or a resource at two different actions.
-
Save — saves the captured resources to disk.
-
Red, Green, and Blue — toggles on and off specific colors.
-
Alpha — enables alpha visualization. In the neighboring drop-down, you can select one of the following two options:
-
Blend — blends the alpha with a checkerboard background.
-
Grayscale — alpha values are displayed as grayscale.
-
-
Flip Image — inverts the image of the resource displayed.
Pixel History
Pixel history enables the automatic detection of the draw, clear, and data-update events that contributed to the change in a pixel's value. In addition, pixel history can identify the fragments that failed to modify a particular texture target, allowing you to understand why a draw might be failing, such as whether you may have misconfigured API state in setting up your pipeline.
To run a pixel history test, click the
![]() button and select a pixel to run the experiment on. The Pixel History view will come up
with a loading bar and present the results once they are complete.
button and select a pixel to run the experiment on. The Pixel History view will come up
with a loading bar and present the results once they are complete.
Structured Memory Configuration
The Structured Memory Configuration dialog allows the user to specify a data layout to interpret the raw data backing the selected resource. For example, a texture may be represented by its colors channels or a uniform buffer may be represented by the various types packed within that buffer.
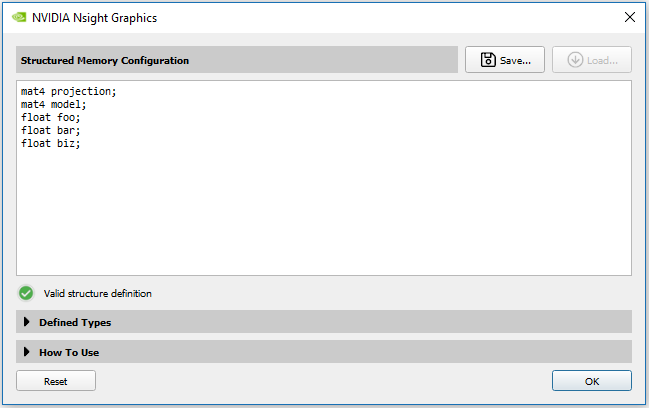
Typing in a valid structure definition will automatically update the viewer to respect the configuration.
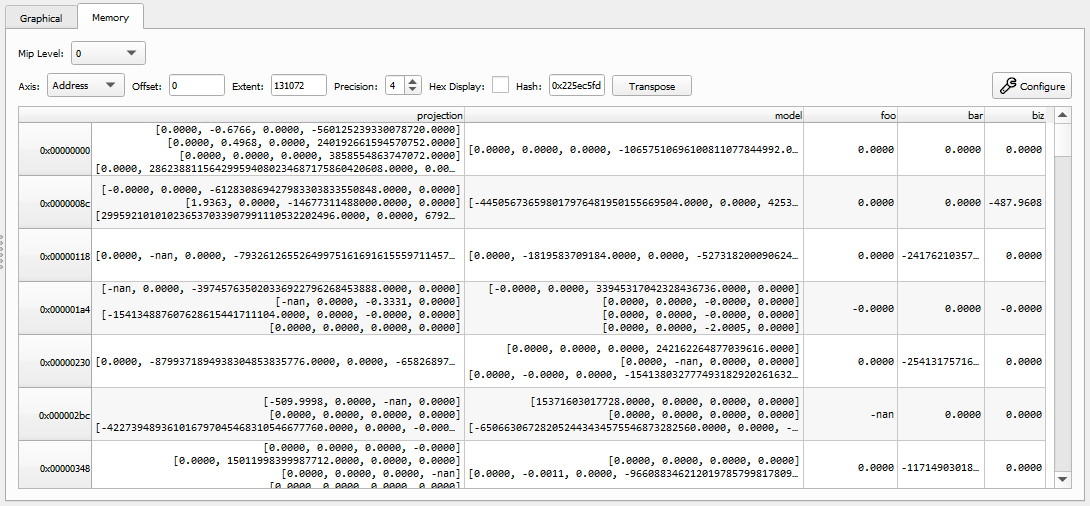
New columns can be created using a simple C-like syntax.
int;      // creates a column with an anonymous int
int x;    // creates a second column with an int named x
float y;  // creates a third column with a float named y
Where additional user types can be defined like the following:
struct MyType{ int x; float y;};
struct MyOtherType{ MyType z; double u; };
Many common sized, unsized, and normalized types are permitted as valid types. Vector and matrix types are provided in a similar syntax to HLSL and GLSL. The full list of supported types can be browsed and searched by clicking on the expandable "Defined Types" sub-section of the configuration dialog.
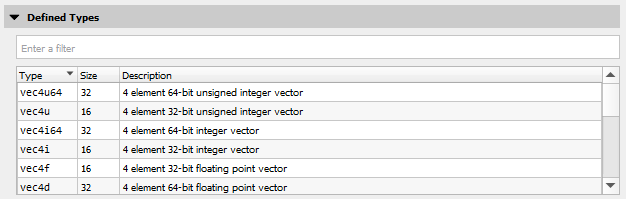
As some additional notes on the parser:
-
Full C/C++ grammar is not supported.
-
Single line comments are accepted; c-style block comments (/* */) are not.
-
Macros are not currently supported.
-
Alignments are not considered; all types are considered packed.
-
To add explicit padding, use padN where N is a multiple of 8.
-
Members can be selectively hidden as well, which can be useful for narrowing your data.
When clicking on a texture resource, the configuration is automatically populated to interpret the channels of that format.

Similarly, buffers are defaulted to a generic byte configuration. A user can typically interpret this buffer data by examining the specific use case. For example, the layout of a vertex buffer can be seen in the Input Assembler section of the API Inspector view, or a uniform buffer can be interpreted by looking at the data layout specified within the shader source.
To persist a configuration, you can click on the Save... button to assign a name to this configuration.
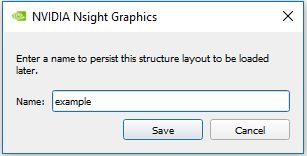
Later, you can restore this configuration by clicking on the Load... button.
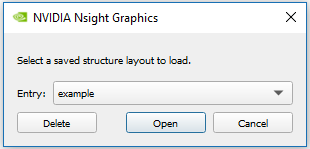
Scrubber
The Nsight Graphics Frame Debugger has two parts. One part appears as the Frame Debugger window on the host. The other part appears as a Heads-Up Display (HUD) on the target application.
To access this view, go to Frame Debugger > Scrubber.
The part of the Frame Debugger that appears as a HUD on the target machine is comprised of the following:
-
HUD Toolbar — controls the frame capture, along with a number of other options (help, etc.).
-
Frame Scrubber — indicates the current draw event. There is a scrubber view in the Frame Debugger on the host, as well as a frame scrubber on the HUD. The frame scrubber controls stay in synch with each other, meaning that when you move the controls on one, it affects the other. For example, if you move the frame scrubber on the HUD to highlight a new draw event, the scrubber on the Frame Debugger moves in synch to do likewise.

Understanding the Frame Scrubber
For the sake of discussion when it comes to graphics debugging, it helps to note some common terminology.
-
An event is a single call to the API. It could be a triangle draw call, or backbuffer clear, or a less obvious call, like configuring buffers. A snapshot is a sequence of events.
-
An action is a subset of the event types. It can be one of the following: (1) Draw Call, (2) Clear, or (3) Dispatch. Actions are interesting since they explicitly change data which may result in visual changes.
|
Note: |
NOTE for Direct3D frame debugging: The Direct3D runtime documentation states that, "the return values of AddRef & Release may be unstable and should not be relied upon." The Nsight Graphics Frame Debugger will also take additional references on objects so any code that relies on an exact reference count at a particular time may fail. In general, users should not expect an exact reference count to be returned from the Direct3D runtime. For more information, see Microsoft's Rules for Managing Reference Counts. |
When you debug your graphics project, the Scrubber window shows the perf markers you implemented. When working with user-defined markers, the Scrubber window will use the color and label that you defined for the perf marker.
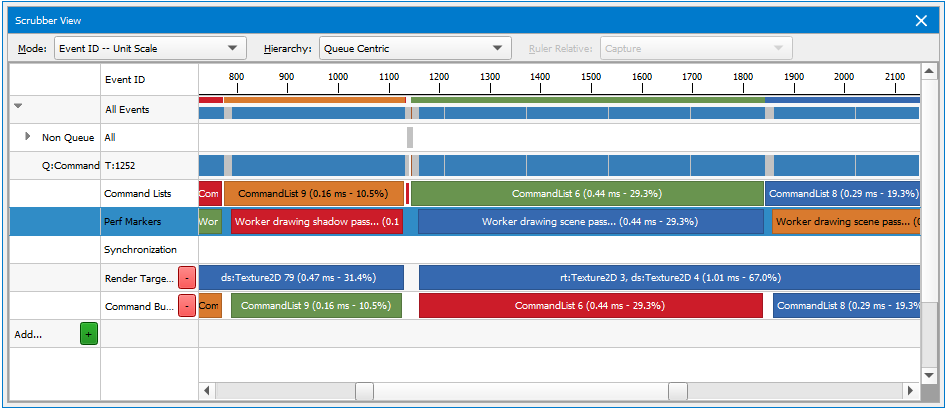
On the Scrubber, you can select one performance marker and it will automatically create a range of all of the draw calls that occurred within that time frame. Clicking on it again will cause the scrubber to automatically zoom to that range of events. You can zoom in on a nested/child marker the same way.
To zoom out, click the parent performance marker, or use CTRL + mouse wheel.
Performance markers are also displayed on the HUD, color-coded the same way that they are on the Scrubber. However, on the HUD, the information is condensed, and you must hover your mouse over the selected performance marker to get its details.
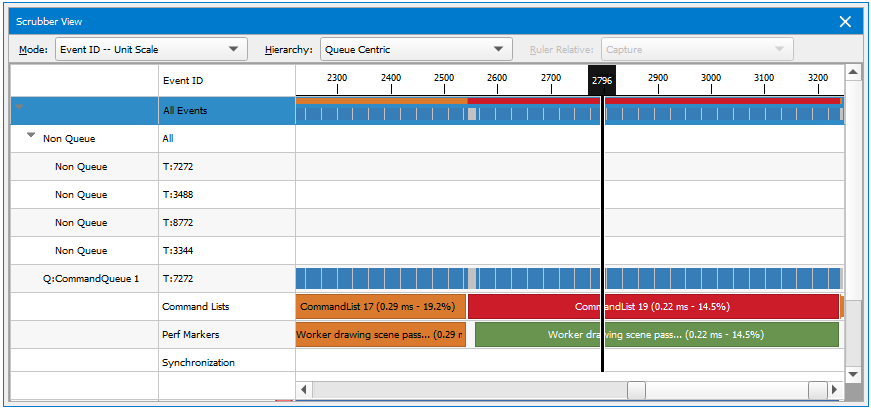
The default view will show the events in your application, in addition to any performance markers you have defined. Clicking the Add... button will open a dialog that allows you to select what type of range you want to add.
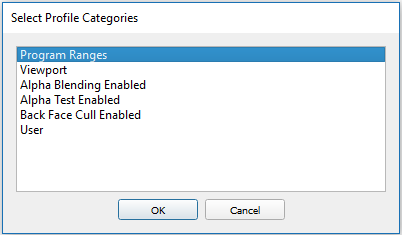
-
Program Ranges — Actions that use the same shader program.
-
Viewport — Actions that render to the same viewport rectangle.
-
Alpha Blending Enabled — Actions that have alpha blending enabled.
-
Alpha Test Enabled — Actions that have alpha test enabled.
-
Back Face Cull Enabled — Actions that have back face cull enabled.
-
User — A range defined by you on the fly. Use SHIFT + left-click and drag the scrubber on the created "User" row to create a new range.
Right-clicking on a specific action in the Scrubber will allow you to open the API Inspector for that action, change your view settings, or initiate a profile session with the Range Profiler.
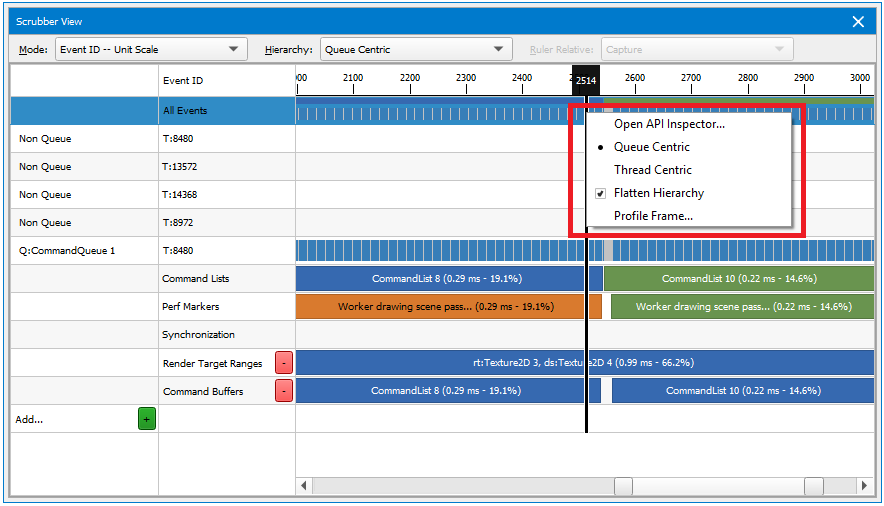
Scrubber View Options
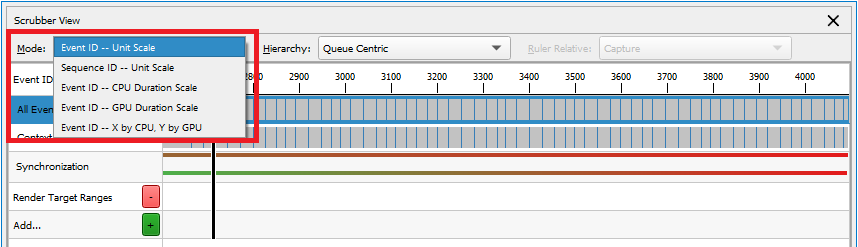
From the Mode drop-down menu, choose one of the following:
-
Event ID -- Unit Scale is the default view, which simply shows the actions and events on the timeline.
-
Sequence ID -- Unit Scale shows the sequence of events on the timeline.
-
Event ID -- GPU Time Scale displays the GPU activity and how much each event or action cost the GPU.
-
Event ID -- CPU Time Scale displays the CPU activity and how much each event or action cost the CPU.
-
Event ID -- X by CPU, Y by GPU displays the CPU time scale on a horizontal X-axis, and the GPU time scale on a vertical Y-axis.
Depending on which mode you select, you can also select whether you want to view the ruler relative to the capture, viewport, or cursor.
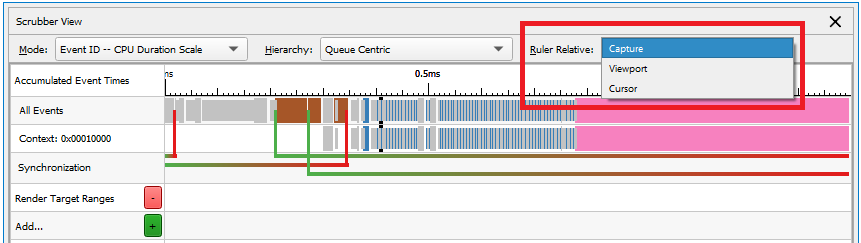
From the Hierarchy drop-down, Queue Centric sorts the events by queue, while Thread Centric sorts the events by the thread.
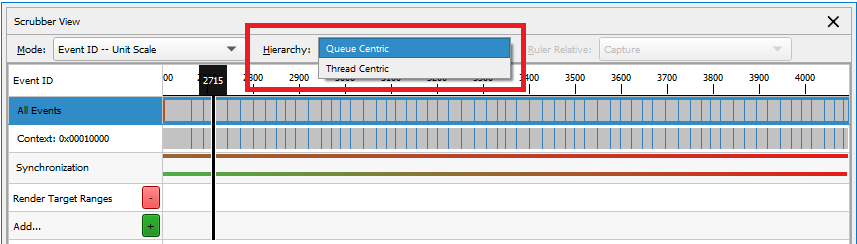
Using Hotkeys to Scrub Through a Frame
When the scrubber has focus, you can use the following hotkeys to move the scrubber cursor from one event to another.
| Navigation | |
|---|---|
|
CTRL + Home |
Go to the first event. |
|
CTRL + End |
Go the last event. |
|
CTRL + Left Arrow |
Go to the previous event. |
|
CTRL + Right Arrow |
Go to the next event. |
|
Up Arrow |
Expand the current event group (HUD only). |
|
Down Arrow |
Collapse the current event group (HUD only). |
|
F2 |
Current event: show less information (HUD only). |
|
F3 |
Current event: show more information (HUD only). |
|
Zooming and Panning |
|
|
CTRL + Scroll mouse wheel up, or CTRL + NumPadPlus |
Zoom in X-axis |
|
CTRL + Scroll mouse wheel down, or CTRL + NumPadMinus |
Zoom out X-axis |
|
CTRL + 0 |
Reset zoom |
|
CTRL + SHIFT + Scroll mouse wheel up |
Increase row height (all rows) |
|
CTRL + SHIFT + Scroll mouse wheel down |
Decrease row height (all rows) |
|
CTRL + Left mouse click and drag |
Pan |
|
ALT + mouse move |
View zoom window |
|
Cursor and Selection |
|
|
Left mouse click on desired cursor location |
Set cursor(Places cursor at closest point to the start of a range.) |
|
Left mouse click on desired row |
Select row (The selected row is highlighted in orange.) |
|
SHIFT + Left mouse click and drag |
Make range selection |
|
Left mouse click on selection |
Zoom to range |
|
Left double-click on event action, or Right-click menu, Open API Inspector |
Open API Inspector |
|
Right-click menu, Run Range Profiler |
Run Range Profiler |
|
CTRL + A |
Select all events |
For the purpose of moving the scrubber cursor, the following are considered action events:
-
Draw methods
-
Clear methods
-
Dispatch methods
-
Present methods
For example, if you are looking for the next draw method that was called, you can press the CTRL + RIGHT ARROW on the keyboard to skip over events that are not typically of interest, and only stop on events that are considered action events.
Shader Profiler
The Shader Profiler is a tool for analyzing the performance of SM-limited workloads. It helps you, as a developer, identify the reasons that your shader is stalling and thus lowering performance. With the data that the shader profiler provides, you can investigate, at both a high- and low-level, how to get more performance out of your shaders. The Shader Profiler is currently in preview for the D3D12 API.
To access this view, go to Frame Debugger > Shader Profiler.
You can alternatively perform shader profiling through targeted actions through several controls within the UI:
- From the Range Profiler, in the Shaders section, after profiling a range
- From the Linked Programs View, when right-clicking a shader.
- From the API Inspector, when navigating shader pipeline state
- From the Event List View, when right-clicking an event or range
Sections
The Shader profiler has the following tabbed sections:
- Summary: this section shows a top-level summary of information about the profiling run. It is the place from which you can understand how your shaders within the profiled range performed.
- Source: this section reports a per-line breakdown of the performance of your shaders. It includes several visualization modes, including high-level source reports as well as side-by-side high-level source to lower-level correlation.
- Session Info: reports information on the profiling session including the events that were profiled, how many passes were required, information about the application that was sampled, and what convergence was seen of the profiling session.
Summary Tab
The summary tab shows a top-level summary of information about the profiling run. It contains the following sections:
- Function Summary: this section provides a hierarchical breakdown of the shaders used by the range that was profiled. It is the primary jumping-off point for understanding how your shaders performed.
- Hot Spots: this section reports the source-lines for which the Top Stalls are discovered. It is context-sensitive to the selection in the Function Summary.
- Events: this section reports the events for which the Top Stalls are discovered, sorted by GPU time. It is context-sensitive to the selection in the Function Summary.
Function Summary
This section provides a hierarchical breakdown of the shaders used by the range that was profiled. It is the primary jumping-off point for understanding how your shaders performed.
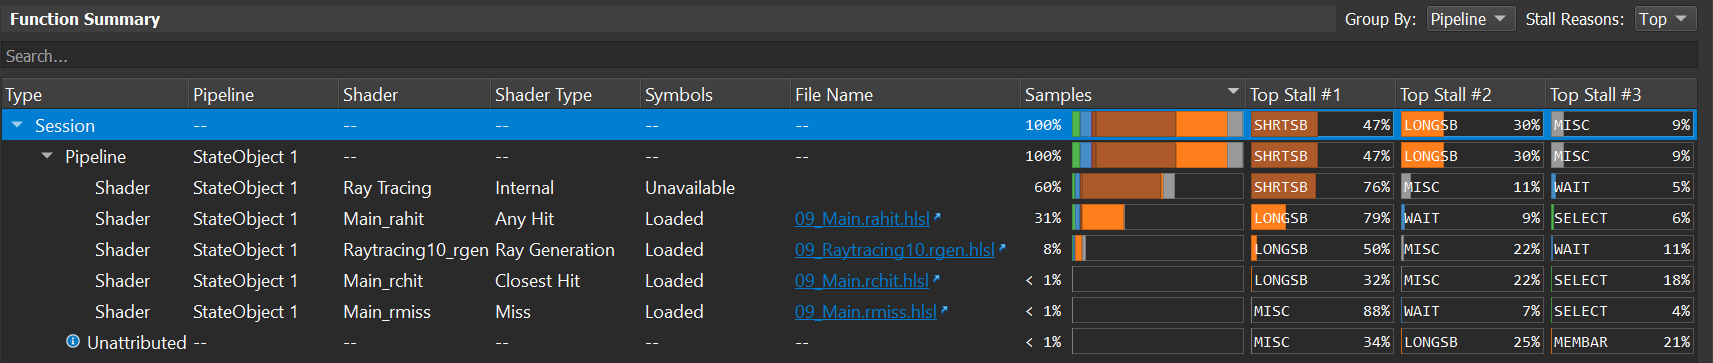
This section presents a table of all of the shaders within a range alongside how each performed. At the root, there is a 'Session' element that represents all samples for the entire range. Below it, the shaders will be grouped depending on the Group By setting of the view. Grouping by Shader will flatten the tree; grouping by Pipeline will hierarchically layout all samples according to the pipeline to which they belong.
The left-hand side of the information panel presents information by which you can classify each shader.
- Type: indicates the kind of hierarchy for elements below
- Pipeline: the pipeline to which this shader belongs
- Shader: the name of the shader for which results were collected
- Shader Type: the kind of shader being profiled; Vertex, Pixel, Ray tracing, etc.
- Symbols: reports the success or failure of reading debug and correlation information for the shader that was profiled. Hover over this cell for a tooltip that reports detailed information about the operation, including the files in which debug information was read.
- File Name: the file from which this shader was generated.
The right-hand-side presents the performance of the row in question. The sampling breakdown will be reported depending on the choice of the Stall Reasons control: when Top is selected, the top stalls for each row will be reported; when All is selected, all samples will be shown, regardless of their relative contribution to the total sample count.
- Samples: reports the total summation of samples collected for this row.
- Top Stall #1: reports the stall reason with the highest incidence for the row in question
- Top Stall #2: reports the stall reason with the 2nd highest incidence for the row in question
- Top Stall #3: reports the stall reason with the 3rd highest incidence for the row in question
See Stall Reasons for a full listing and description of stall reasons.
When sampling, some samples may be reported as Unattributed. Samples in this row either failed correlation, or represent internal operation of the GPU that this sampler does not report. These samples can generally be ignored, except in the case where the results are of a high quantity, in which case we recommend you save this report this issue to communicate this issue to the Nsight Graphics team.
Hot Spots
This section reports the source-lines for which the Top Stalls are discovered. Lines within this table can be double-clicked to navigate to the source line in question within the Source section. The display can also be toggled between High-Level and Intermediate/Lower level by changing the Type selection.
- Item: the shader to which this line belongs.
- File: the file and line from which this hot spot comes.
- Source: the source for the particular hot spot
- Samples: reports the total summation of samples collected for this row.
- Top Stall #1: reports the stall reason with the highest incidence for the row in question
- Top Stall #2: reports the stall reason with the 2nd highest incidence for the row in question
- Top Stall #3: reports the stall reason with the 3rd highest incidence for the row in question
Events
This section reports the events for which the Top Stalls are discovered, sorted by GPU time. It is context-sensitive to the selection in the Function Summary. Within each event row is a link to an event that relates to the selection. This allows you to make associations between selected shaders and the resources, state, and commands that utilized the shader in question.
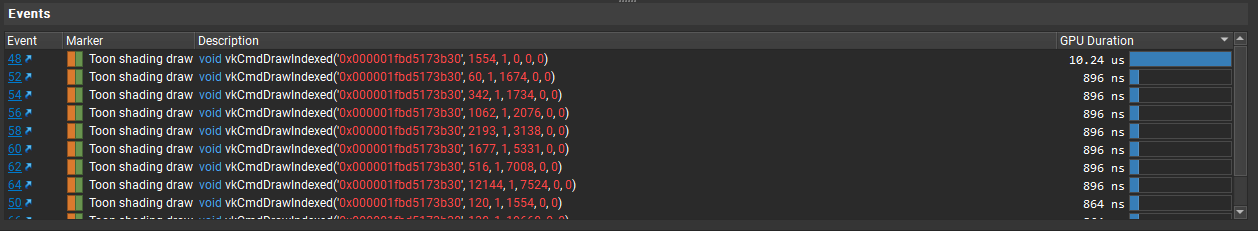
Source Tab
This section reports a per-line breakdown of the performance of your shaders. It includes several visualization modes, including high-level source reports as well as side-by-side high-level source to lower-level correlation.
There are a few top-level controls that control which shader is viewed and how that shader is viewed.
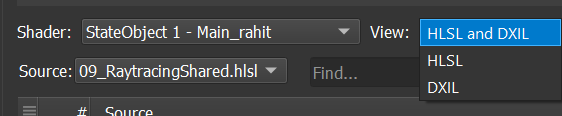
Shader: select the shader that you would like to view.
View: change the source display to show high-level language, a lower-level language, or, alternatively, high-level language alongside a lower-level language.
Source: because shaders can be compiled from a main file and several includes, this selector allows you to select which particular source file you wish to investigate.
Once a shader and view is selected, you can use one of several navigation tools to navigate within the shader source.

- Find: enter a text string to find. This is useful for finding variables, methods, or register names.
-
 : navigate to the row with the highest value in the
corresponding stall reason column
: navigate to the row with the highest value in the
corresponding stall reason column
-
 : navigate to the row with the next higher value in
the corresponding stall reason column
: navigate to the row with the next higher value in
the corresponding stall reason column
-
 : navigate to the row with the next lower value in
the corresponding stall reason column
: navigate to the row with the next lower value in
the corresponding stall reason column
-
 : navigate to the row with the lowest value in the
corresponding stall reason column
: navigate to the row with the lowest value in the
corresponding stall reason column
For many uses cases, you will likely want to start by navigating to the highest value, and from there navigate progressively high values until you have planned your next action.
In addition to using the navigation buttons above, you may use the scrollbar with embedded heatmap to identify areas within the source file that will be of interest given a high sample count.
To copy lines, select the lines in question and use the system shortcut to copy to the clipboard. Multiple successive lines can be selected with shift+click; individual lines can be selected with ctrl+click.
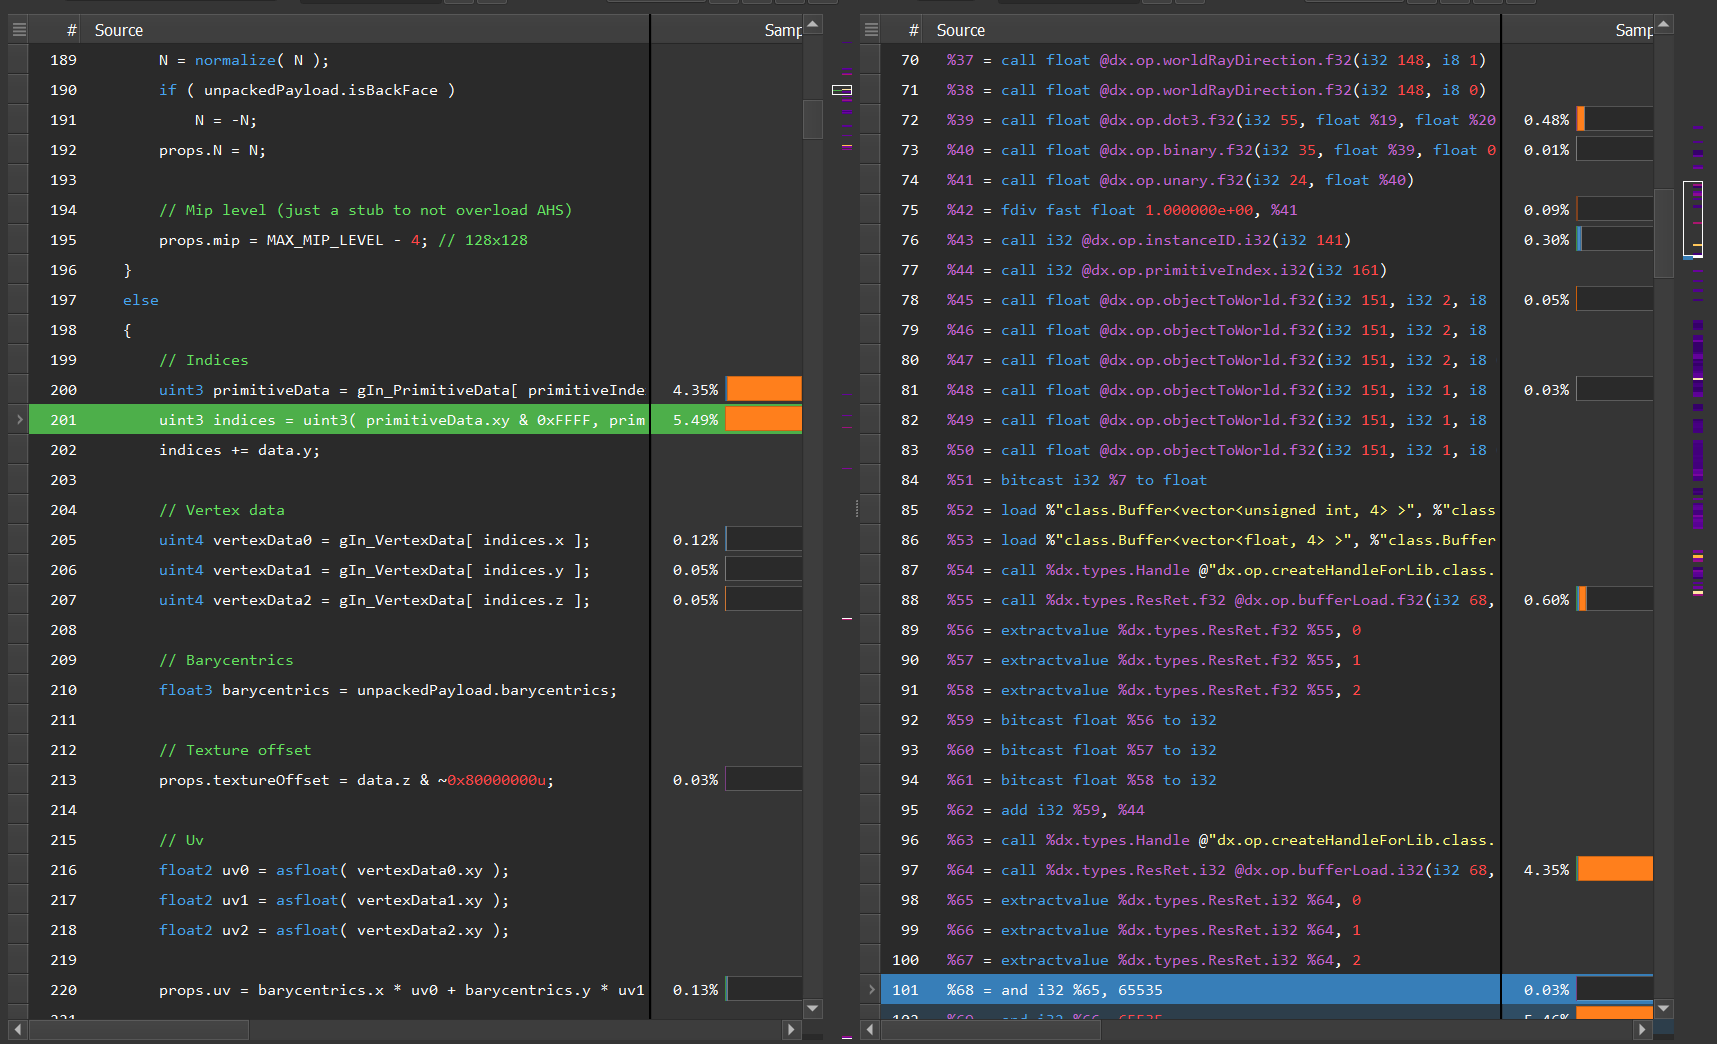
Session Info
This section reports information on the profiling session including the events that were profiled, how many passes were required, and what convergence was seen of the profiling session.
Collection Statistics indicate information about the collection proceeded and how the collection converged.
- Pass Count: the number of passes for which samples were collected.
- Total Samples: The total number of samples collected in this session.
- Error (min): Standard error of the mean of % samples for a given stall type. This is used to gain confidence that enough passes have been performed. This value is the minimum error seen.
- Error (max): Like Error (min), yet this reports the maximum error seen.
- Error (average): Like Error (min), yet this reports the average error seen.
The Configuration section reports key information about the session so that you can know from which application and configuration the session was collected. This section can be important to reference if you collect many reports from different ranges and application configurations.
The Events section lists all of the API events that were sampled within this range.
Linked Programs View
The Linked Programs View lists all of the shaders in your application.
To access this view, go to Frame Debugger > Linked Programs.
-
If the shader (or its parent program or pipeline object) hasn’t been used by the application yet, it will show up with the
 symbol in the Status
column.
symbol in the Status
column.
-
If the shader has been used, selected statistics will be presented for that shader.
For programs or pipeline objects, you can view the individual shaders by pressing the ► button to the left of the program/pipeline name. When expanded, you can select the link to open a text view of the shader source (when available).
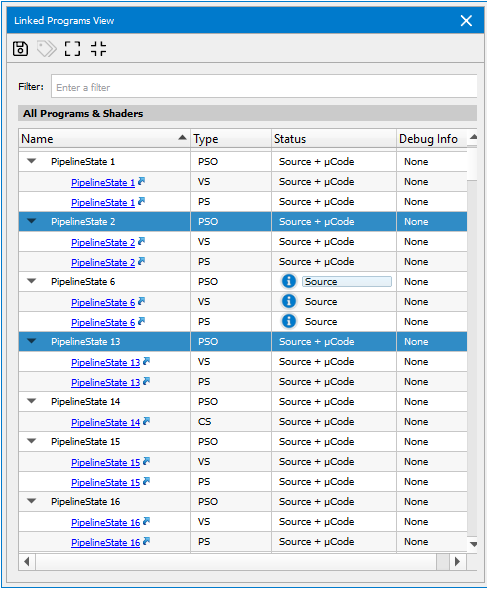
Name
This is the name of the shader. This name is either generated internally, or can be assigned by the user per API.
Type
The type of the shader: Vertex, Pixel, Compute, etc.
Status
This column displays the current status of the shader. The status includes Source or Binary, to denote whether or not source code is available for this shader. Also, if the µCode text is included, this means that we have driver level binary code that is necessary for gathering shader performance metrics.
The
The
symbol means that shader performance metrics are currently being computed.
Context
Indicates to which of the application's contexts this shader is owned. Shown on multi-context OpenGL applications, only.
Regs
This column gives the number of registers used by the program. Register count impacts occupancy/threads in flight. This may be not available for all shaders.
# Barrier
Indicates the number of barriers used by the shader. Shown on compute shaders only.
|
Note: |
Shader µCode, and thus shader performance metrics are only supported for Direct3D 11, Direct3D 12, and OpenGL. Vulkan support will be added in a future release. |
Acceleration Structure View
The Acceleration Structure View shows the geometry that has been specified in build commands when running an application that uses ray tracing APIs. If the application does not use these APIs, the view will not be available.
In Ray tracing APIs, such as DXR and NVIDIA Vulkan Ray Tracing, an acceleration structure is a data structure that describes the full-scene geometry that will be traced when performing the ray tracing operation. This data structure is described in detail in the following links: https://developer.nvidia.com/rtx/raytracing/dxr/DX12-Raytracing-tutorial-Part-1 and https://developer.nvidia.com/rtx/raytracing/vkray
This data structure is purpose-built to allow for translation to application-specific data structures that perform well on modern GPUs. While constructing this data structure, the developer has the responsibility of constructing the structure correctly and using flags to identify the functional and performance characteristics within it. Needless to say, this can be an error-prone operation.
Nsight Graphics Acceleration Structure Viewer allows you to view the structures you are creating, navigate through them, and see the flags that you are using. Additionally, you can filter and colorize the structure to highlight, at a bird’s eye view, different kinds of geometry.
The Acceleration Structure View is opened through links from resource thumbnails or entries in many Nsight views, for example from the API Inspector or All Resources View. For example, the Acceleration Structure Viewer can be opened from the API Inspector View when scrubbed to a build event trace rays call. When scrubbed to these events, the view will present a list of the active structures with a link to open each.
The view is multi-paned -- it shows a hierarchical view of the acceleration structure on the left, a graphical view of the structure in the middle, and controls and options on the right. With the hierarchy of the Acceleration Structure view, the top-level acceleration structure (TLAS), bottom-level acceleration structures (BLAS), child instances, child geometries, and memory sizes are presented. When a particular item is selected, the name, flags, and other meta-data for this entry are listed in a section on the bottom left-hand side. Each item within the tree has a check box that allows the rendering of the selected geometry or hierarchy to be disabled. Double-clicking on an item will jump to the item in the rendering view and automatically adjust the camera speed to be relative to the size of the selected object.
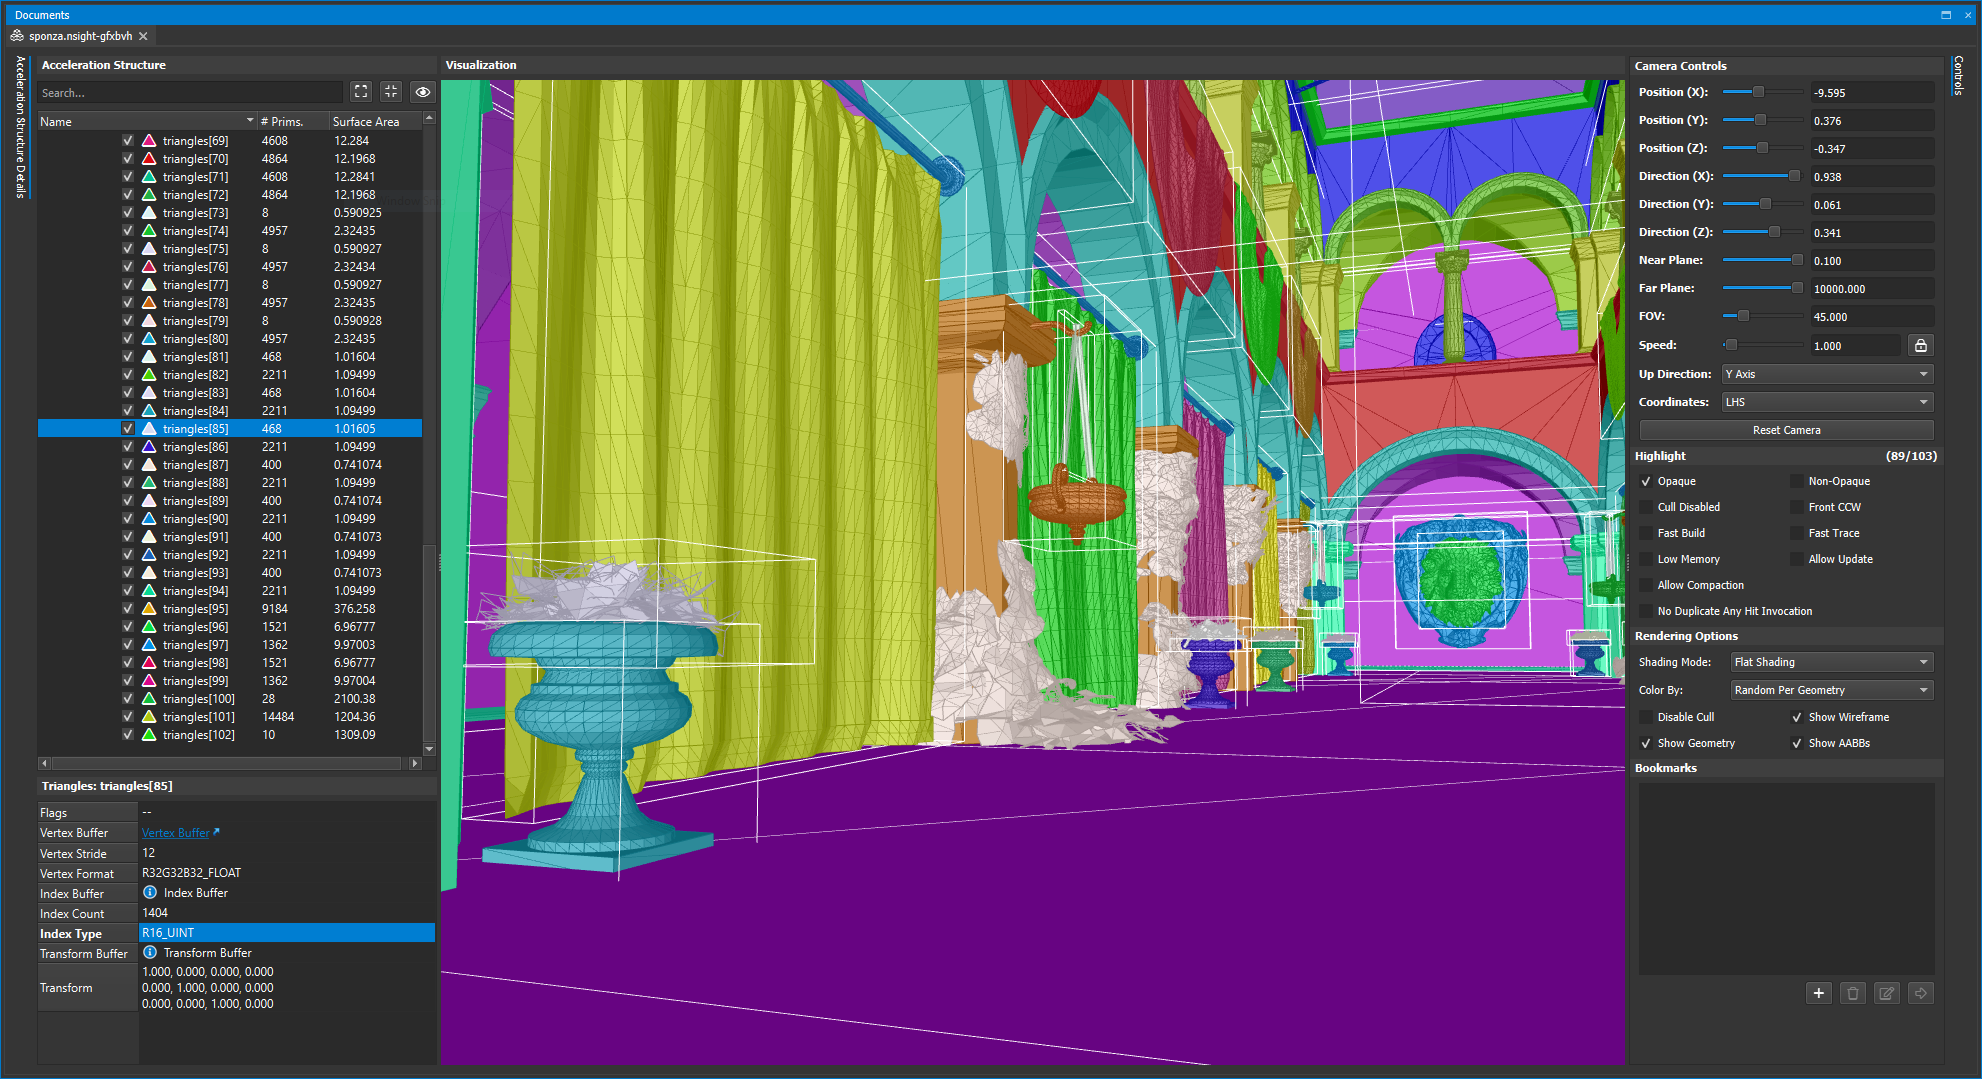
| Column | Description |
|---|---|
| Name | An identifier for each row in the hierarchy. Click on the check box next to the name to show or hide the selected geometry or hierarchy. Double-click on this entry to jump to the item in the rendering view. |
| # Prims | The number of primitives that make up this geometry. |
| Surface Area | A calculation of the total surface area for the AABB that bounds the particular entry. |
| Size | A calculation of the memory usage for this particular level. Hover over this entry to see a tooltip that includes a roll-up calculation of the aggregate memory usage of this hierarchical level and children below it. |
Navigation
The Acceleration Structure View supports navigation which mirrors the controls for many popular tools. To the right of the rendering pane, information on the camera position and direction are presented. Each of these controls is editable to navigate the scene. The keyboard and mouse bindings for naviation are as follows:
-
WASD — Move the camera forward, backward, left, or right
-
Arrow Keys — Move the camera forward, backward, left, or right
-
E/Q — Move the camera up/down
-
Shift/Ctrl — Move the camera faster/slower
-
Mousewheel — Zoom in/out
-
LMB + Drag — Move the camera forward or backward and rotate left or right
-
RMB + Drag — Rotate the camera
-
MMB + Drag — Track the camera (Move up, down, left, right)
-
LMB + RMB + Drag — Track the camera (Move up, down, left, right)
-
ALT + LMB + Drag — Rotate the camera around the selected geometry
-
ALT + RMB + Drag — Zoom in/out
-
Double-Click or F — Focus the camera on the selected geometry
Based on the coordinate system of the input geometry, you may need to change the Up Direction setting to Z-Axis or the Coordinates setting to RHS. To reset the camera to its original location, click Reset Camera.
There are also a selection of Camera Controls for fast and precise navigation. To save a position, use the bookmarks controls. Each node within the acceleration structure hierarchy can also be double-clicked to quickly navigate to that location.
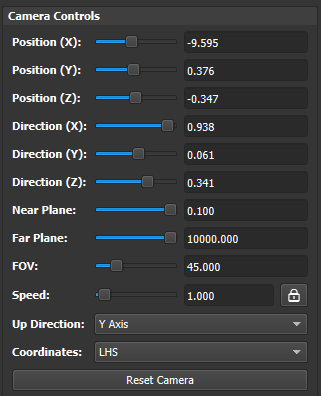
Filtering and Highlight
The acceleration structure view supports geometry filtering as well as highlighting of data matching particular characteristics. The checkboxes next to each geometry allow individual toggling between full rendering, wireframe rendering, and no rendering. Combining this capability with search allows for you to identify the geometry of interest (by name when the application has named its resources) and display just that geometry.
Geometry instances can also be selected by clicking on them in the main graphical view. Additionally, right clicking in the main graphical view gives options to hide/show all geometry, hide the selected geometry, or hide all but the selected geometry.
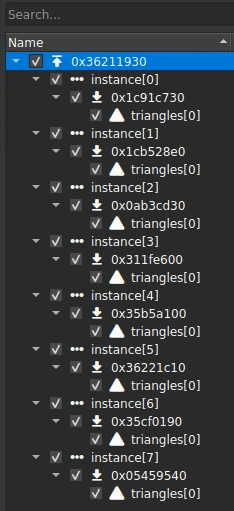
Beyond filtering, the view also supports highlight-based identification of geometry specified with particular flags. Checking each Highlight option will identify those resources matching that flag, colorizing for easy identification. Clicking an entry in this section will dim all geometry that does not meet the filter criteria allowing items that do match the filter to standout. Selecting multiple filters requires the passing geometry to meet all selected filters (e.g., AND logic). Additionally, the heading text will be updated to reflect the number of items that meet this filter criteria.
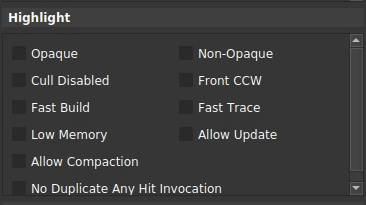
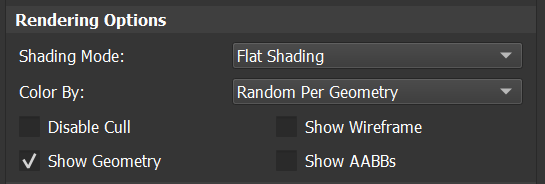
Export
Exporting the view, by clicking on the Save (disk) icon in the upper left of the view toolbar, allows for persisting the data you have collected beyond the immediate analysis session. This capability is particularly valuable for comparing different revisions of your geometry or sharing with others. Bookmarks are persisted as well. An example use case is identify sub-optimal geometry, bookmarking it, and passing this document to a level designer or artist for correction.
VR Inspector View
The VR Inspector view allows you to inspect how your application is using VR APIs. It will be available when an application is captured with a supported API. Supported APIs include Oculus (LibOVR) and OpenVR.
To access this view, go to Frame Debugger > VR Inspector.
Once opened, this view is context-specific to the VR API in use. See the sections below for a discussion on each API.
Oculus (LibOVR)
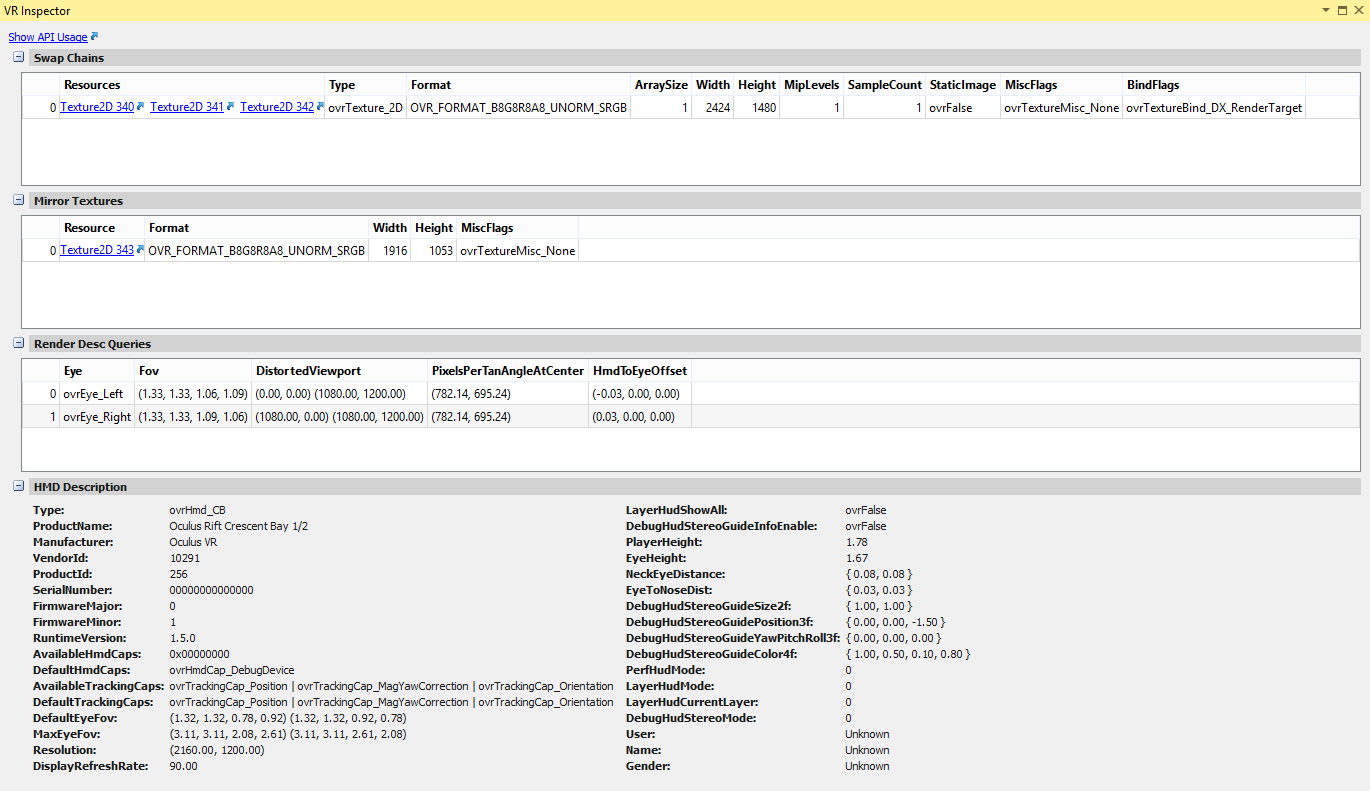
With the Oculus API, the sections of the VR Inspector view include the following:
-
Swap Chains — Lists all swap chains and their associated texture resources and description fields, with links to the Resource Viewer for inspection.
-
Mirror Textures — Lists all mirror textures and description fields with Resource Viewer links for the associated texture(s).
-
Render Desc Queries — Shows all of the calls to ovr_GetRenderDesc, along with the parameters, to confirm that the proper eyes, FOV values, etc. are correct.
-
HMD Description — Gives details on the actual HMD device connected to the machine and all of the limits for that device.
OpenVR
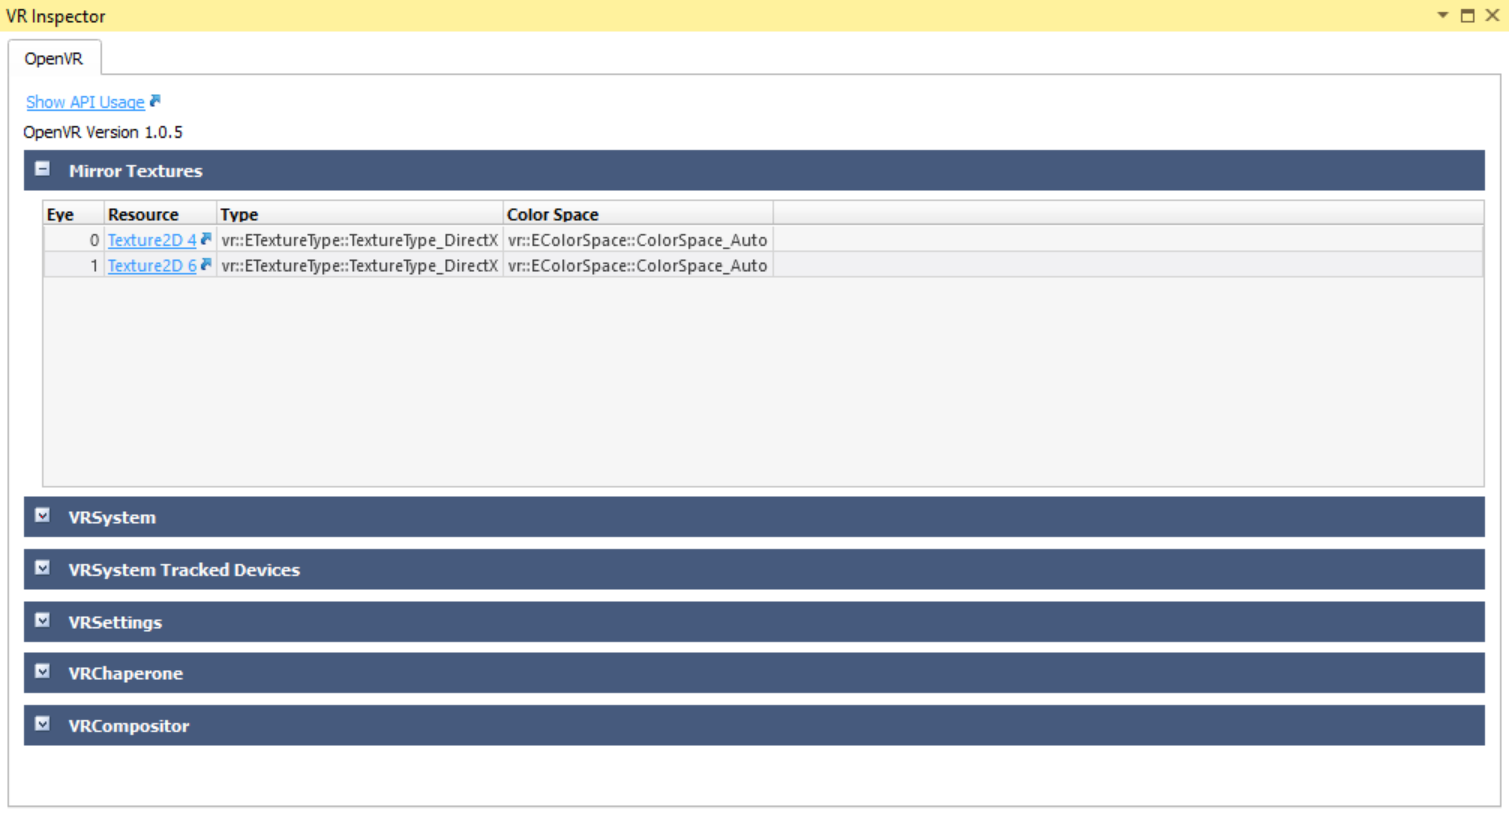
When using OpenVR, you will see the following in the VR Inspector view:
-
Show API Usage — Brings up the Events List view filtered by OpenVR calls.
-
OpenVR Version — In the top left, under Show API Usage, the minimally compatible version of OpenVR you are using will be displayed. This may be lower than the version your application has targeted, due to the fact that it may not be using any features of later API versions.
-
Mirror Textures — Lists all mirror textures and description fields with Resource Viewer links for the associated texture(s).
The following sections return interface dependent information:
-
VRSystem — displays the render target size
-
VRSystem Tracked Devices — displays information for each tracked device currently connected
-
VRSettings — displays all of the VRSettings properties
-
VRChaperone — displays the play area information
-
VRCompositor — displays rendering and compositing statistics
D3D12 Specific Views
D3D12 Descriptor Heaps
The Descriptor Heaps view displays all of the descriptor heaps bound for the current event.
To access this view, go to Frame Debugger > Descriptor Heaps.
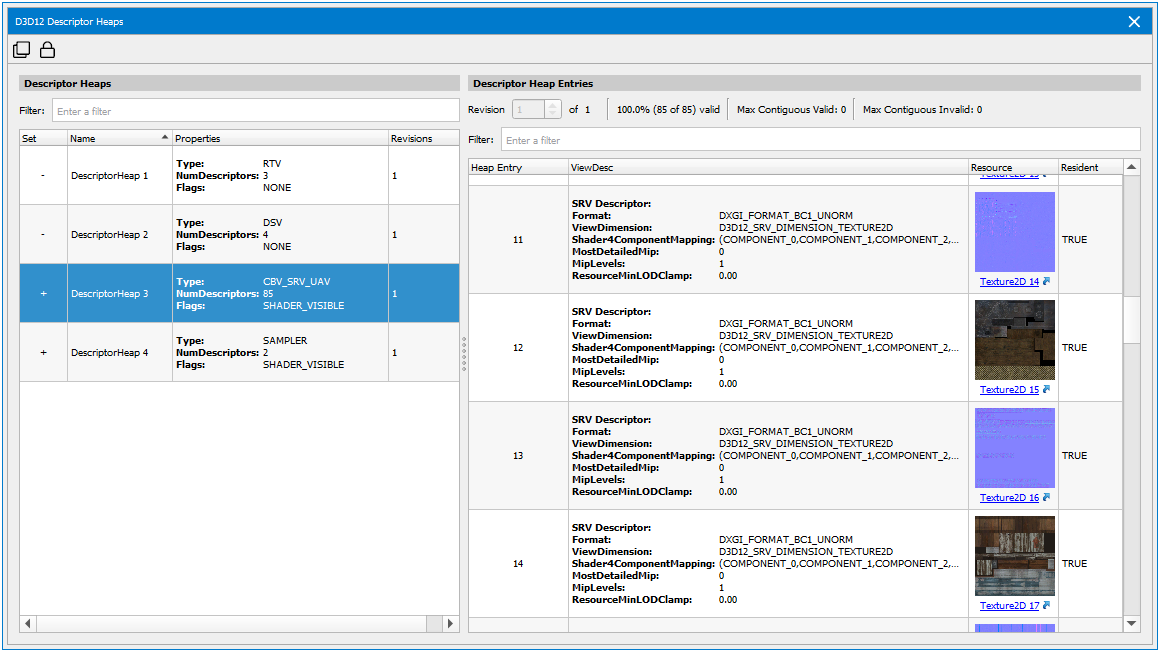
On the left are the descriptor heaps available, and on the right you can view the properties of each descriptor heap. Along the top of the details pane, you can see how populated the descriptor heap is, as well as the maximum contiguous valid and invalid ranges. These properties can help you dive into each descriptor heap, and use it as a diagnostic tool to find any potential bugs in your application.
Note that if you click the hyperlink in the Resources column, it will bring up the Resource Viewer.
D3D12 Heaps View
The Heaps view provides a list of all heaps created by the application, along with detailed information about the resources contained in each heap.
To access this view, go to Frame Debugger > Heaps.
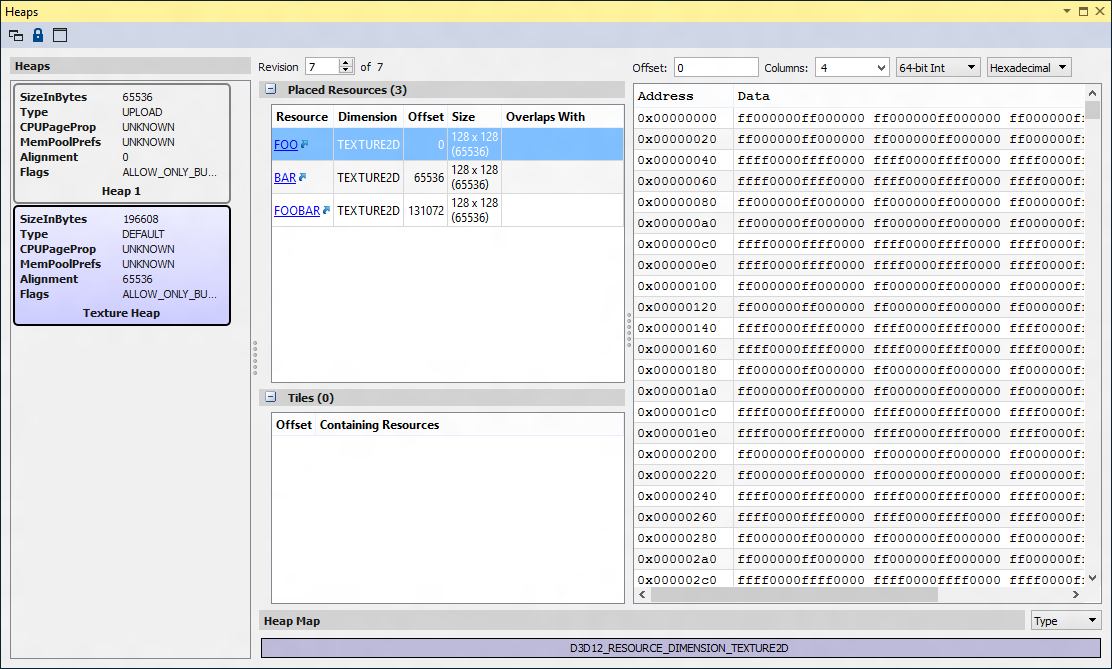
When you select a heap from the left pane, you will see all one of two types of entries: Placed Resources or Tiles. Clicking the hyperlink in the Placed Resources box will take you to the Resources Graphical tab.
Tiles are used to populate sections of a tiled resource.
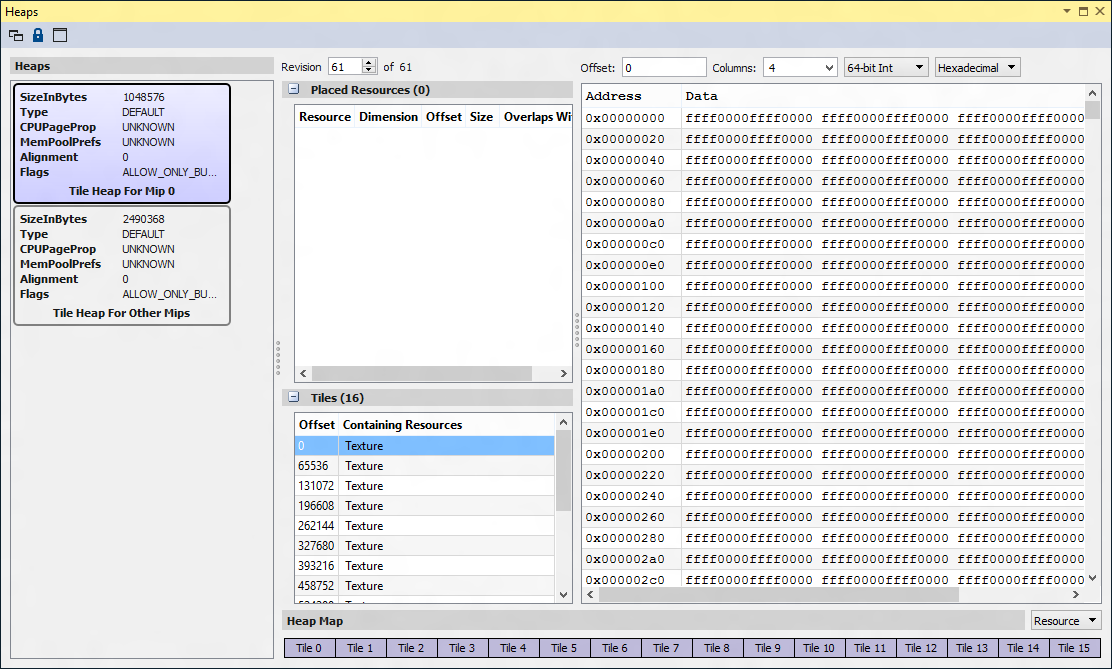
The right side of the Heaps view displays the memory data associated with the selected resource, which can also be seen on the Memory tab of the All Resources view.
Heap Map
The Heap Map shows a high-level layout of how the heap is currently being used. You can view the usage either by Type (for example, Buffer, Texture2D, etc.) or by the name of the Resource.
Type:

Resource:

The Heap Map shows any overlapping regions within the heap.
D3D12 Root Parameters
The Root Parameters view displays all of the root parameters bound for the current event. This allows you to quickly change the state of what you're sampling from, constants, and other descriptors at a lightweight, faster rate than past APIs.
To access this view, go to Frame Debugger > Root Parameters.
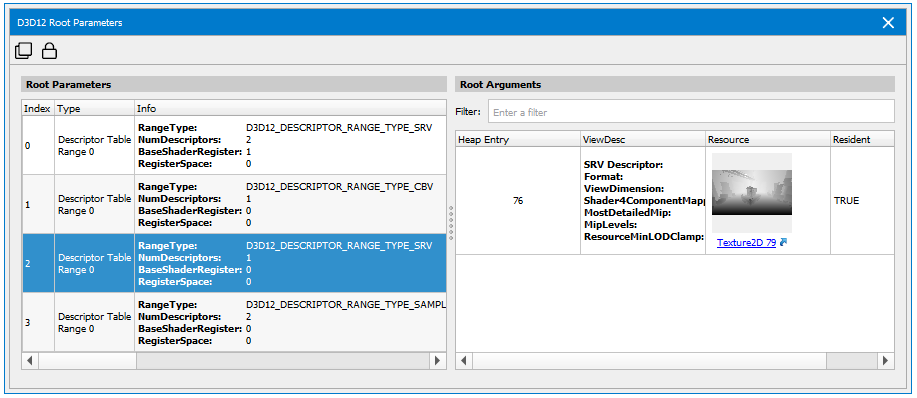
The root signature displays the structure definition of what's bound at that moment. Root parameters fill in that structure with the values you're sampling from and the constants you're using.
When you select a root parameter on the left, the root arguments for that parameter are displayed on the right. This shows residency information, any invalid descriptors are displayed in red. Using root parameters as a diagnostic tool can help prevent a GPU fault.
Note that if you click the hyperlink in the Resources column, it will bring up the Resource Viewer.
Vulkan Specific Views
Vulkan Descriptor Sets View
The Descriptor Set view displays all of the descriptor sets currently allocated and bound by the application at the current event.
To access this view, go to Frame Debugger > Descriptor Sets.
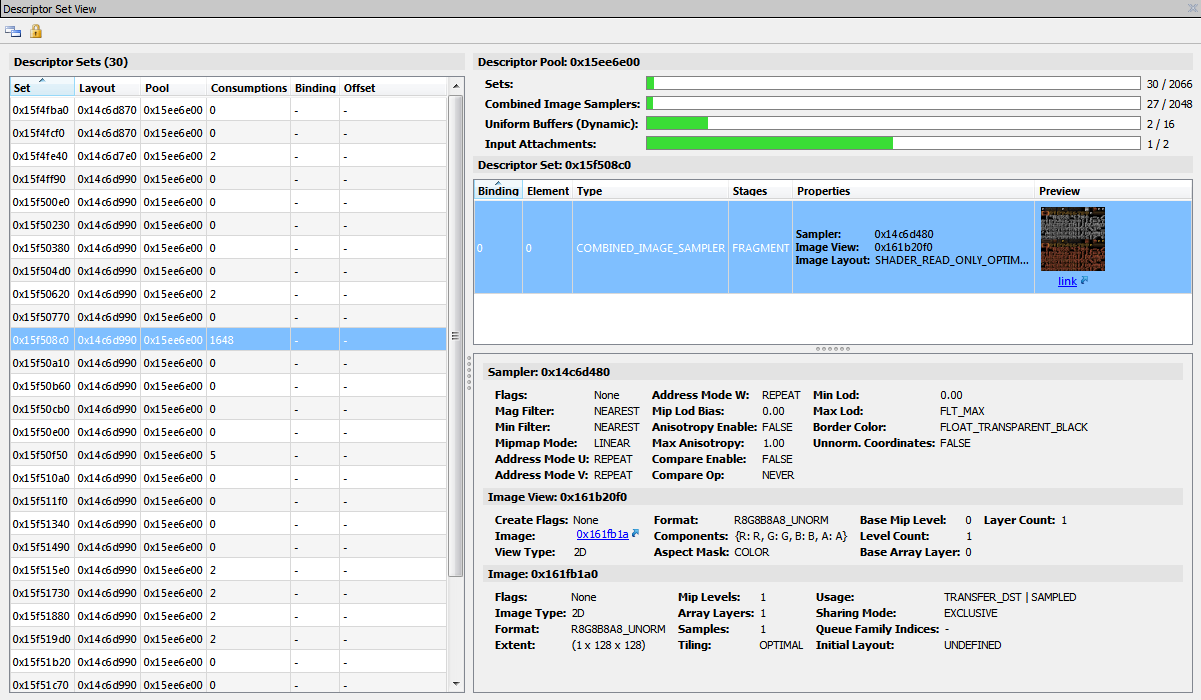
The left pane displays a selectable list of descriptor sets along with their layout, pool, consumption counts, and dynamics offsets.
When a set is selected, the right pane will display the resources currently associated with this descriptor set, as well as information related to the pool from which this descriptor set was allocated. In addition, clicking on a resource within the descriptor set will display more detailed information about that specific resource.
Note that if you click the hyperlink in the Preview column, it will bring up the Resource Viewer associated with this image or buffer.
Vulkan Device Memory View
The Device Memory view provides a list of all device memory allocated by the application, along with detailed information about the resources contained in each memory region.
To access this view, go to Frame Debugger > Device Memory.
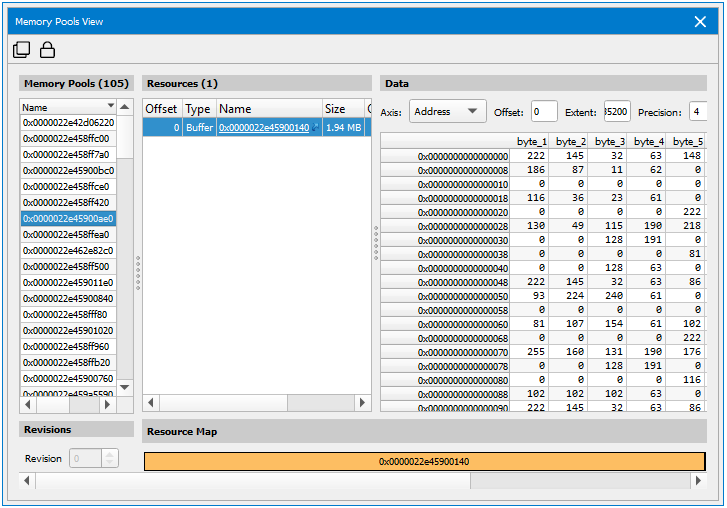
The left-most pane contains information about all device memory objects currently allocated. Once a device memory object is selected, the contained resources will be listed in the middle pane, along with the resource layout map in the bottom left, and contained data on the right.
Vulkan Memory Pools
The Memory Pools view provides a list of all device memory allocated by the application, along with detailed information about the resources contained in each memory region.
To access this view, go to Frame Debugger > Memory Pools.
The left-most pane contains information about all device memory objects currently allocated. Once a device memory object is selected, the contained resources will be listed in the middle pane, along with the resource layout map in the bottom left, and contained data on the right.
Vulkan Texture and Sampler Pools
The Texture and Sampler Pools View provides a visualization of these different pool types. This can be useful for determining if a particular set of resources are in the resource pools they are expected to be in. The left-hand side allows you to select the pool you're interested in, based on type. Included in the list are appropriate parameters about how the pool was created. On the right side is a list of the resource descriptors, some information about the resource itself, and a thumbnail preview. There is a link below the thumbnail that allows you to open that resource in the Resource Viewer for deeper inspection.
To access this view, go to Frame Debugger > Texture and Sampler Pools.
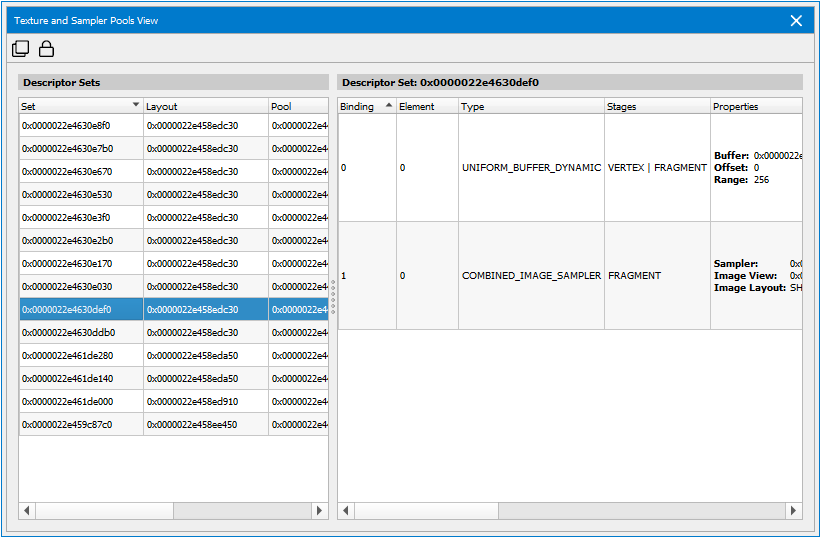
Generate C++ Capture UI
Compiling and launching C++ captures
The additional features of an ngfx-cppcap file include:
-
Screenshot of the capture taken from the original application
-
Information about the captured application and its original system
-
Statistics about the captured API stream
-
Utilities to build the C++ capture without opening the generated Visual Studio project
-
User comments that are persisted within this file.
GPU Trace UI
GPU Trace profiles live applications. Once a capture is complete, the data is saved in a capture file and can be analyzed offline on any computer where NVIDIA Nsight Graphics is installed, without the need to have the specific GPU installed or the profiled application running.
The GPU Trace window is comprised of 5 sections:
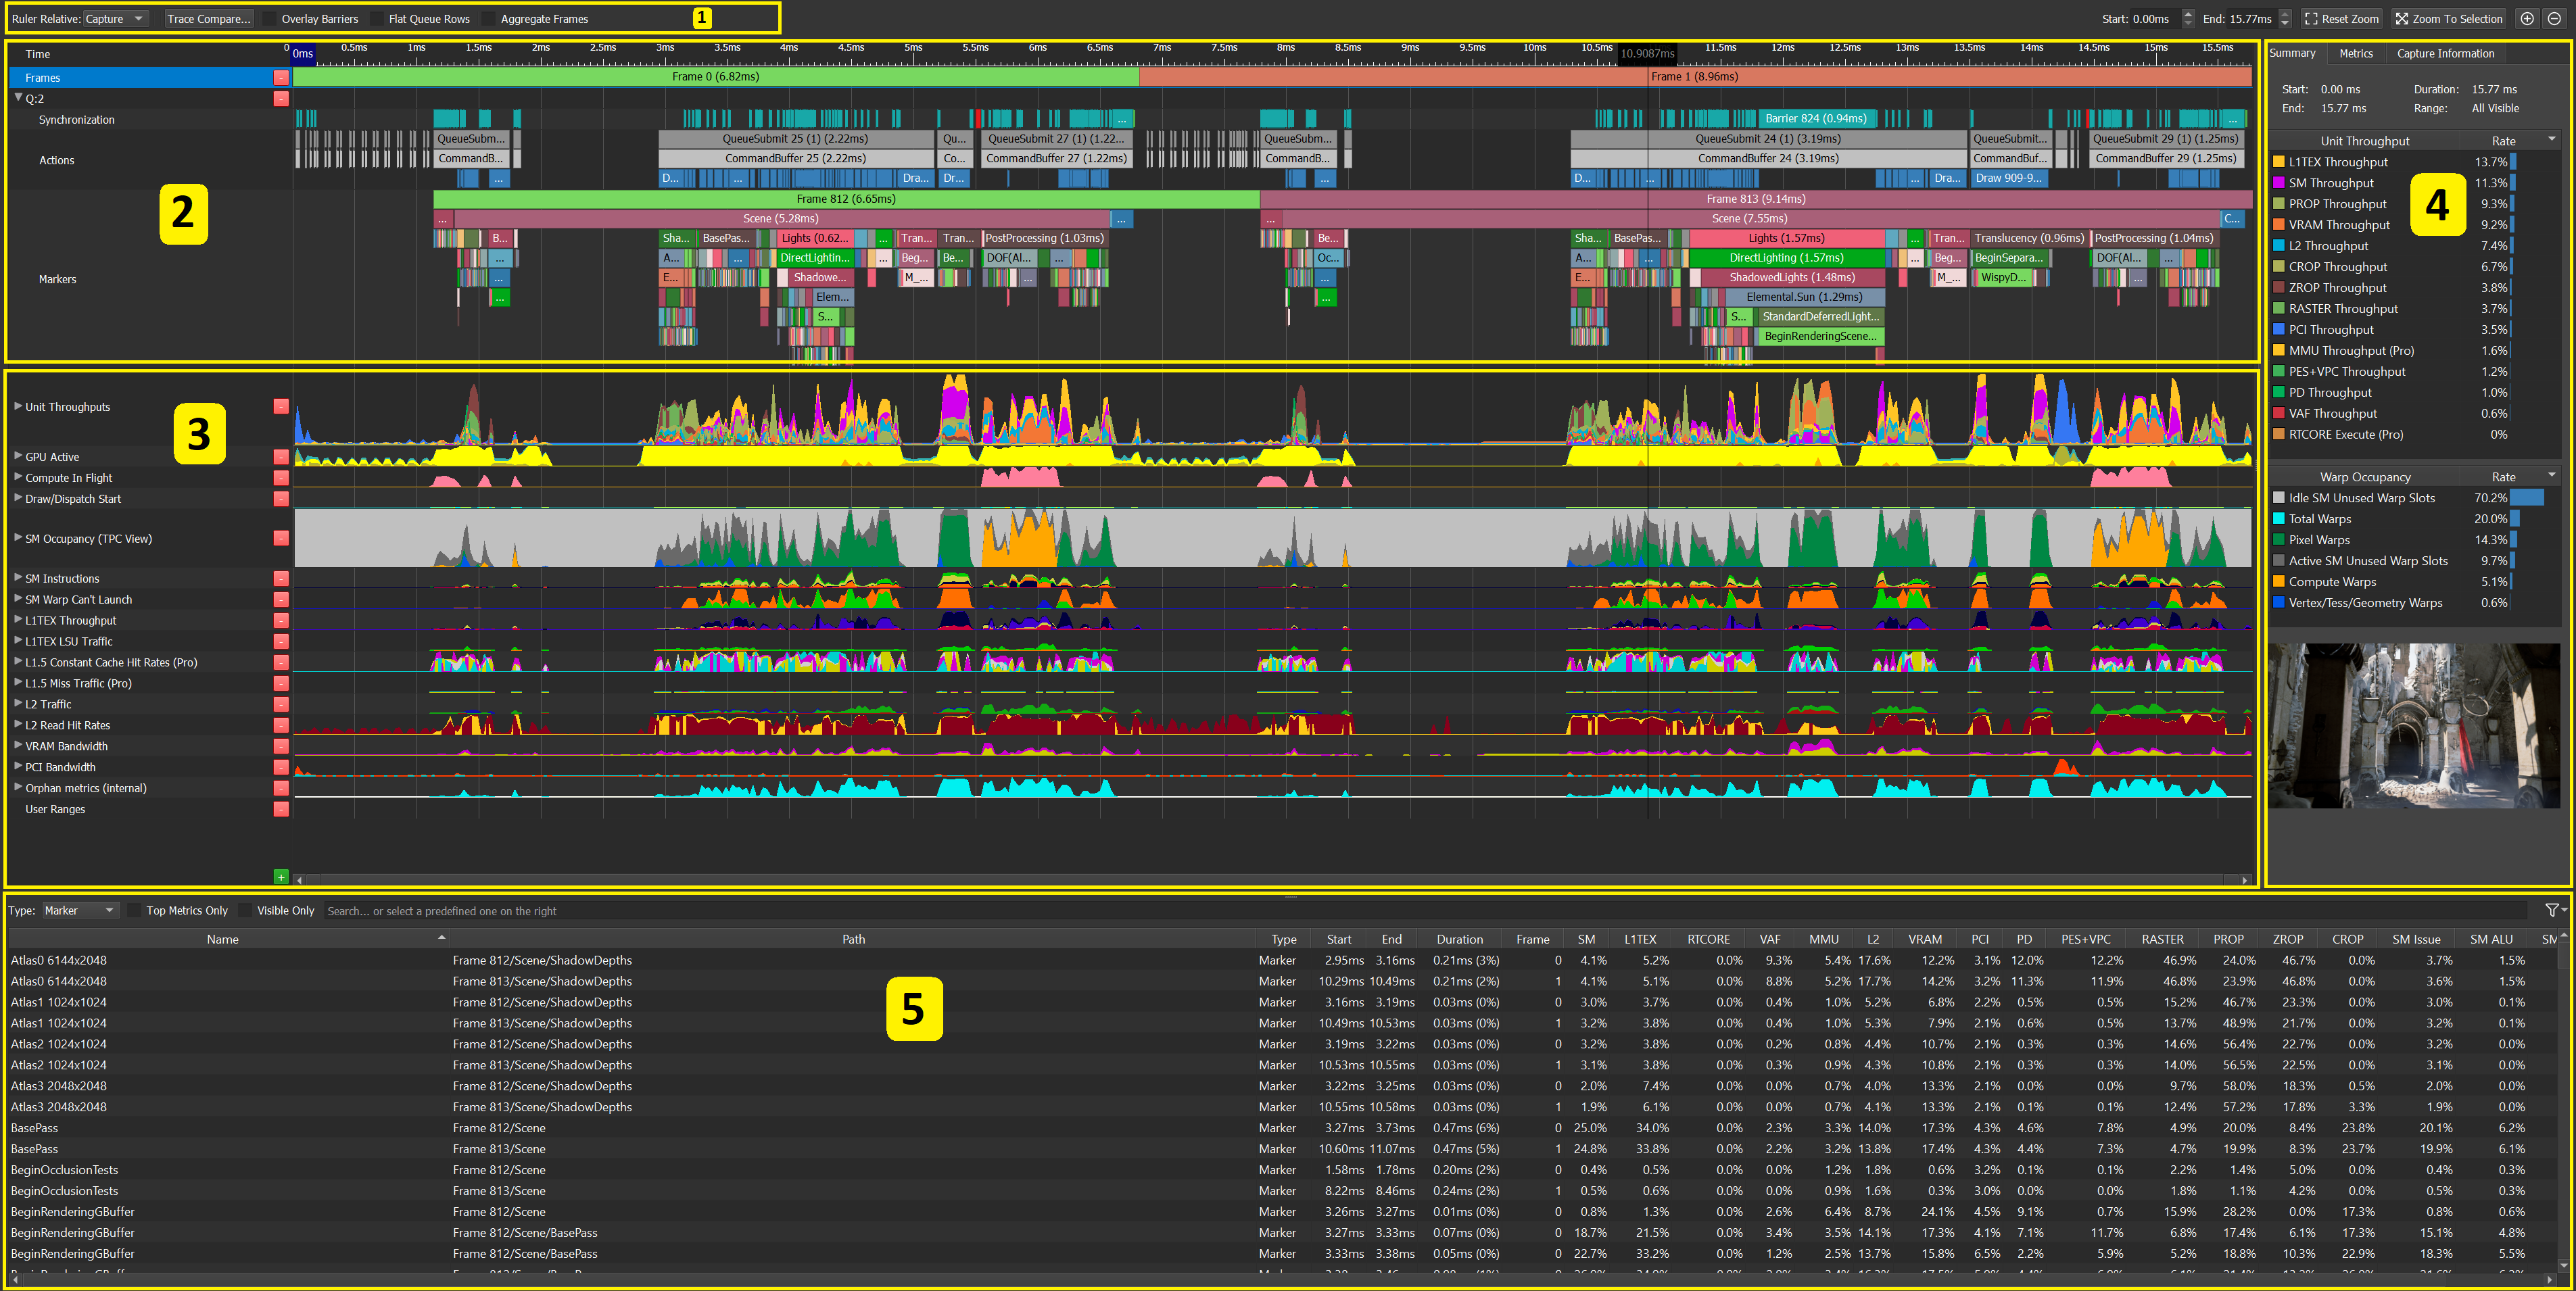
Capture Toolbar
At the top left of the scrubber view, there are 5 buttons that extend the scrubber's capabilities:

-
Ruler Relative: Controls the zero point of the ruler. This can be:
-
Capture: Zero is when the capture begins.
-
Viewport: In this mode, if you select a range and expand it, the beginning of the selected range will be the zero point of the ruler.
-
Cursor: Zero is where the mouse is.
-
-
Trace Compare: See Trace Compare.
-
Overlay Barriers: See Resource Barriers.
-
Flat Queue Rows: In modern graphics API, actions, commands and markers can be executed on different queues. GPU Trace captures these events according to the queue they were executed on, and shows it by default according to this hierarchy. For better granularity, it is possible to toggle this view from hierarchy to flat mode. The flat mode can be used when the user will want to chose to remove some of the rows and / or rearrange the rows order. One specific case would be when the user would like to rearrange the synchronization rows in a way that the signal and wait rows will be one above the other:
Hierarchy Rows Mode:
Flat Rows Mode:
-
Aggregate Frames: This option is enabled only when the capture contains multiple frames, and turning it on activates aggregate mode. In this mode:
- The scrubber shows only the first frame.
- The ranges table shows only marker data.
- The metric values shown in the GPU Trace (in the ranges table, metrics tab and scrubber tooltip) are values averaged across all the frames (hovering over the values shows a tooltip displaying the original values used to compute the average).
- Values which have significant variation between the frames are shown in gray. The threshold for determining this is available in the settings.
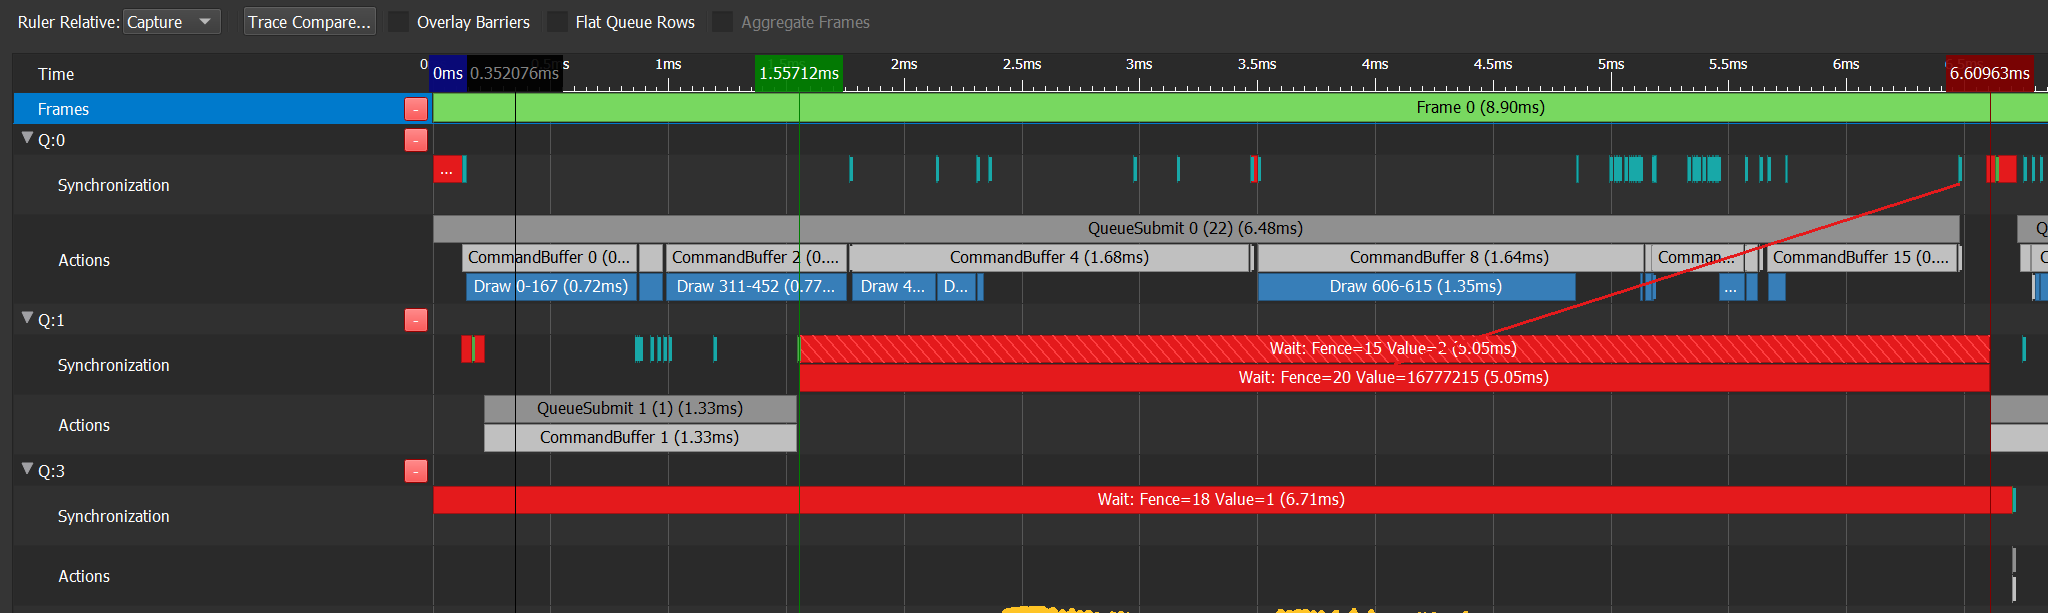
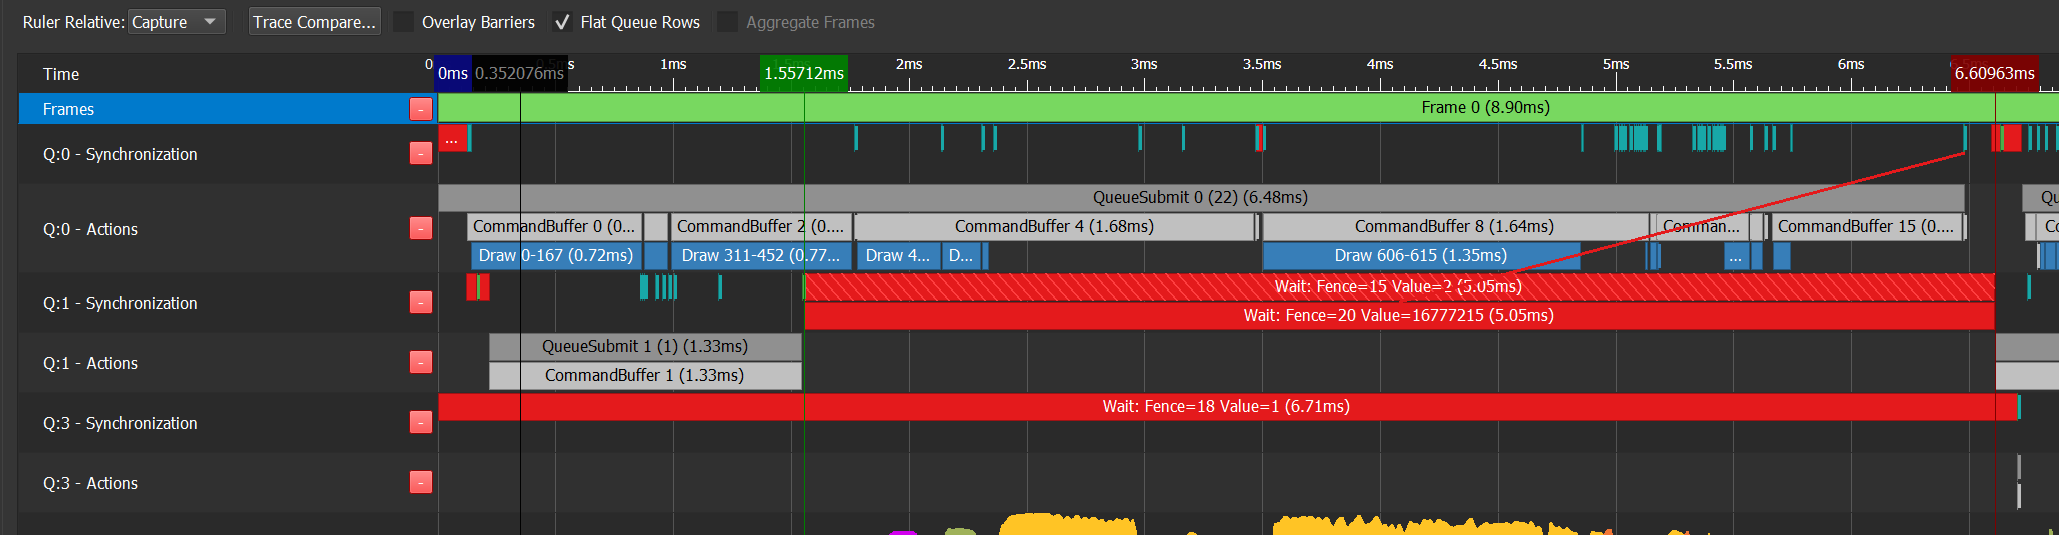
At the top right of the scrubber view, there are buttons controlling the zoom level. These buttons may assist in navigating the scrubber to the desired view.

-
Start / End: Marks down the exact time for your start and end selection.
-
Reset Zoom: Will reset the scrubber zoom for the entire capture.
-
Zoom to Selection: Will zoom to the selected range. For multiple markers selection: Select multiple markers using mouse left-click + CTRL.
Scrubber: Frames Data and Per-Queue Events

Per-Queue Events
NVIDIA GPUs contain multiple independent engines that provide specialized functionality. These engines (e.g. graphics, compute and copy) can execute work in parallel, and work can be submitted to them in separate queues.
In the GPU Trace scrubber, you can observe actions and events that occurred throughout the frame execution, according to the queue they were submitted on. The per-queue part of the scrubber presents events, user markers, and actions.
Queue Synchronization Objects
Since work can be submitted in separate queues, graphics APIs support synchronization of work between queues. GPU Trace capture unveils when Wait and Signal commands are being executed with relevance to the queue. Once such a synchronization object bar is selected, a line connecting to the relevant event will be drawn. This makes it easy to understand when a wait event was triggered, when a signal event released it, and how much time a queue was in a 'waiting' state.
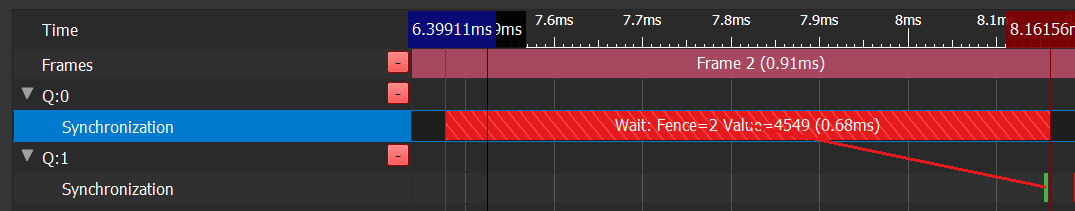
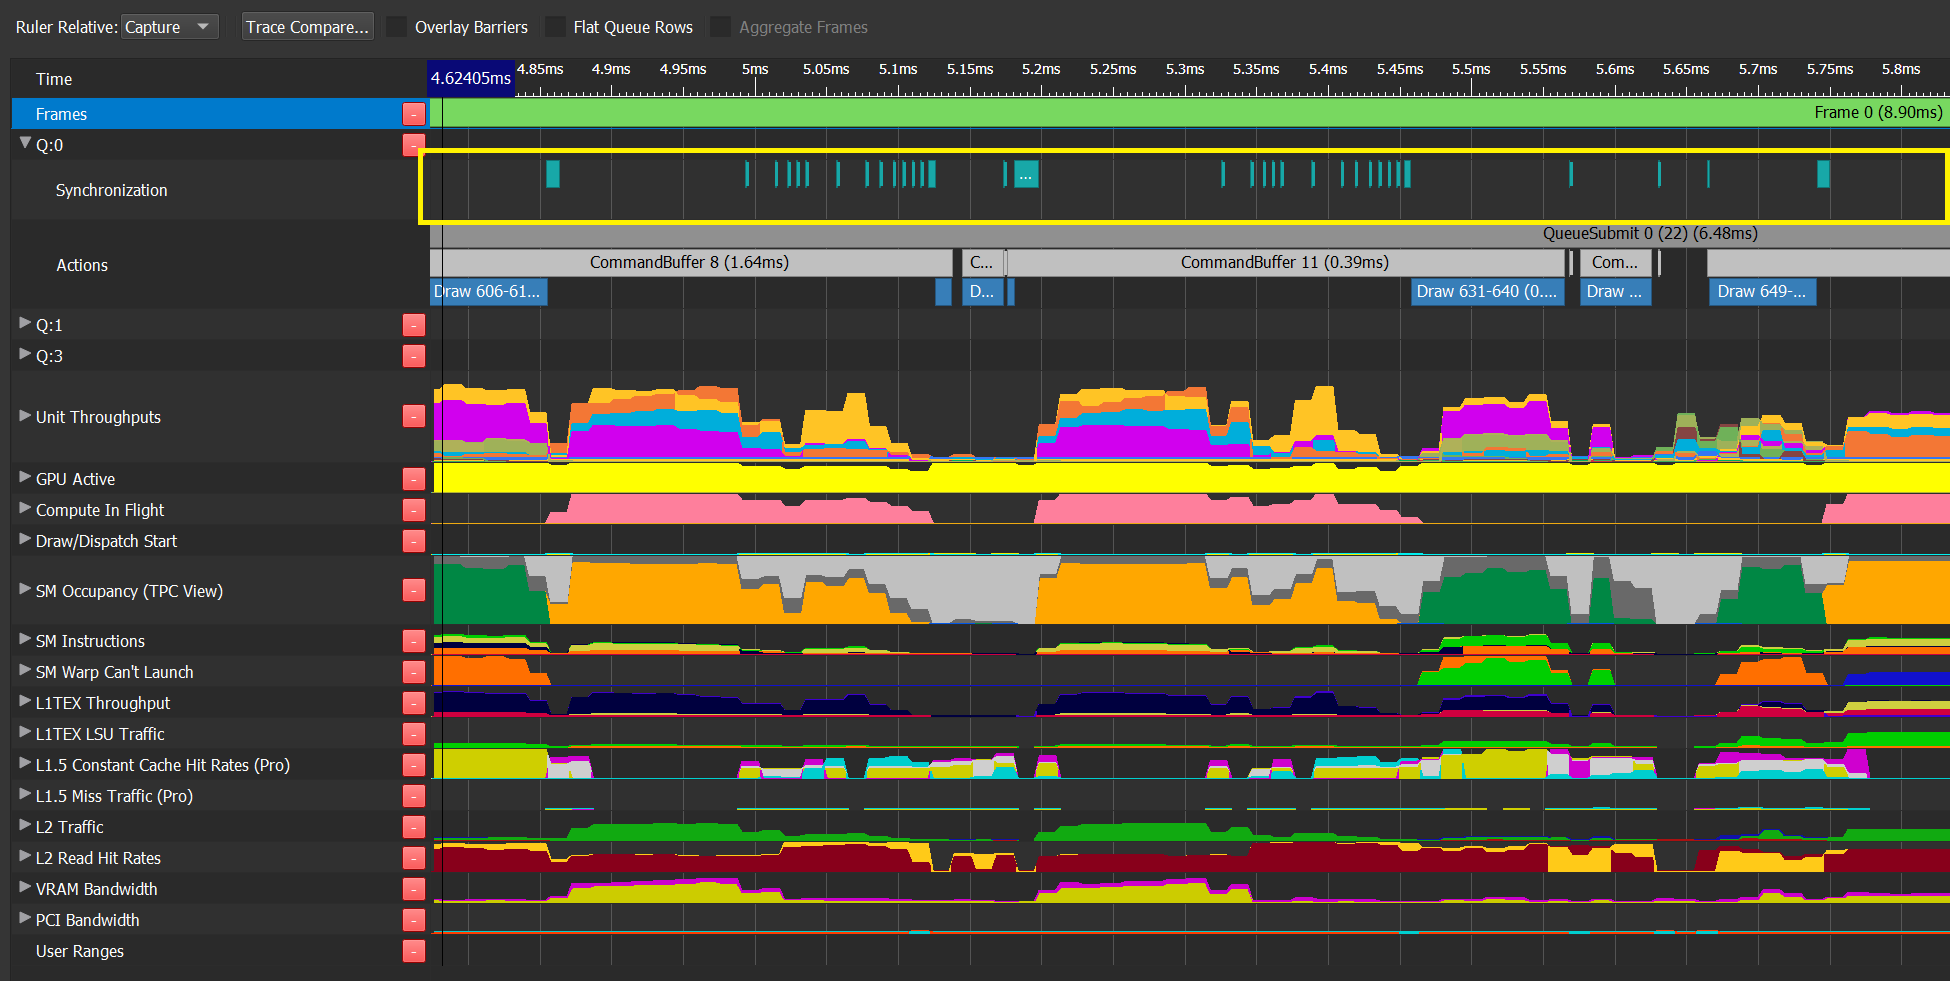
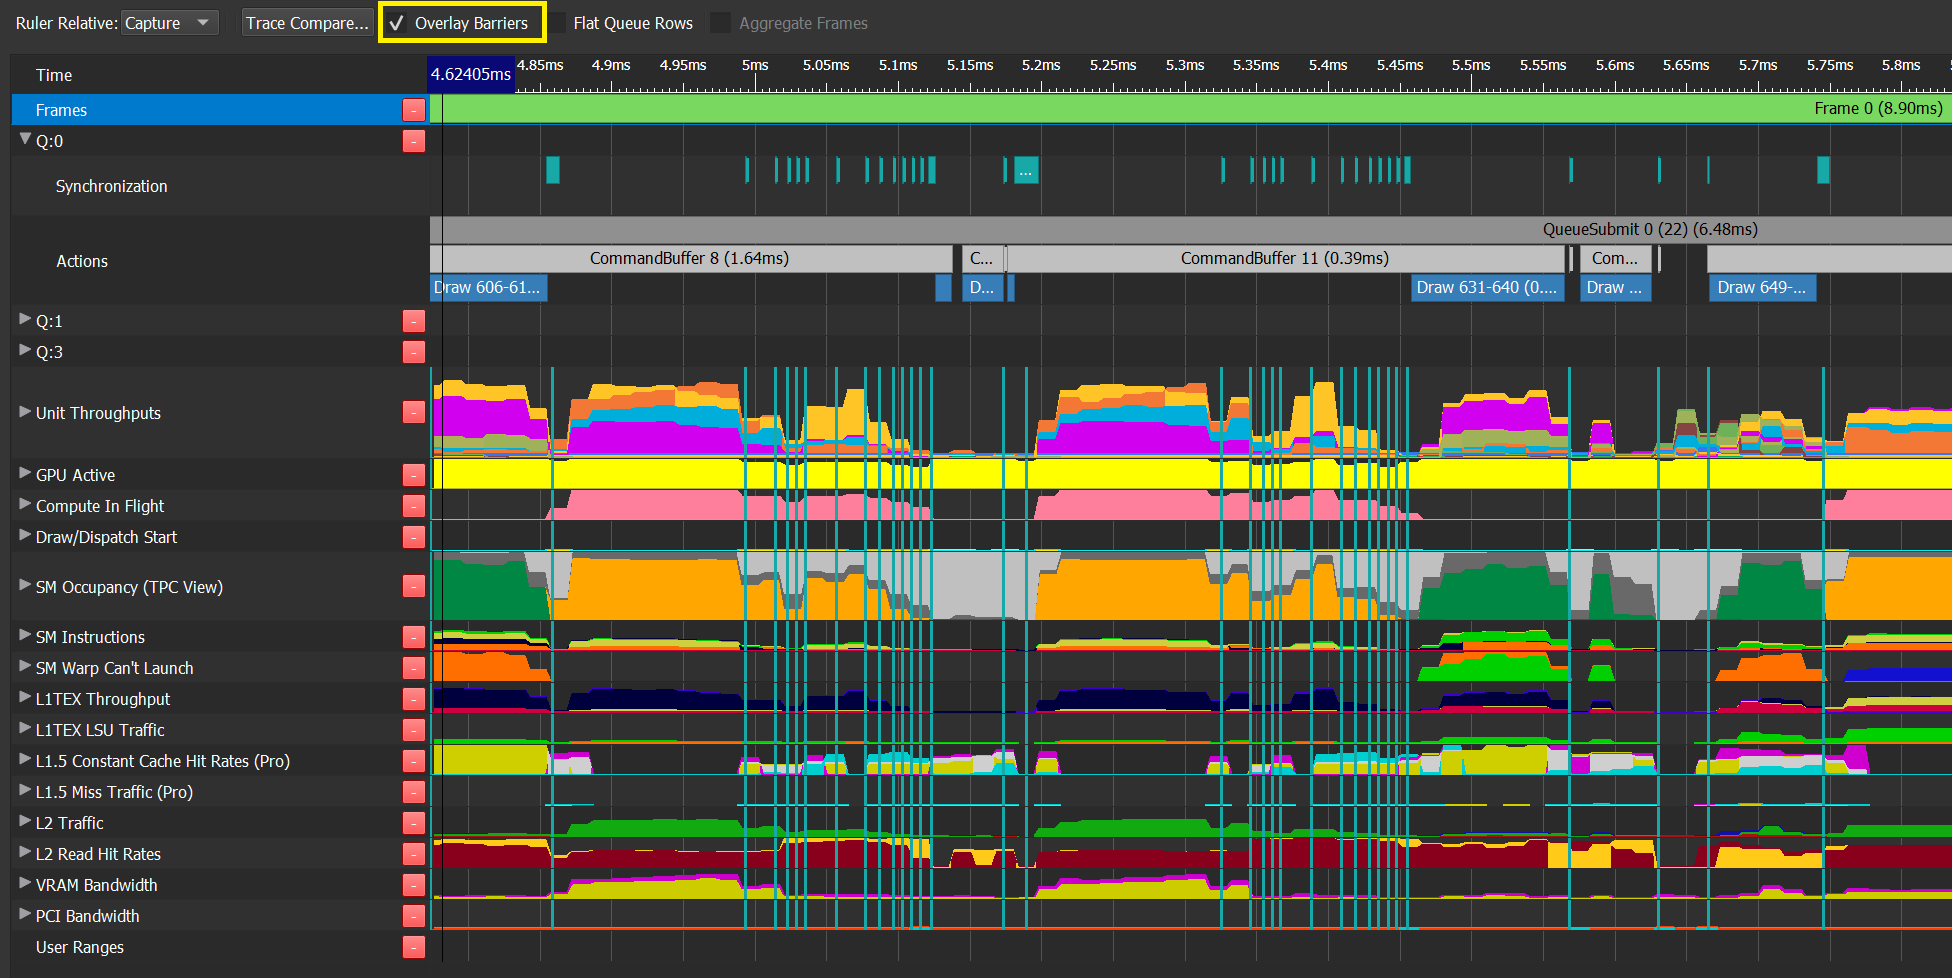

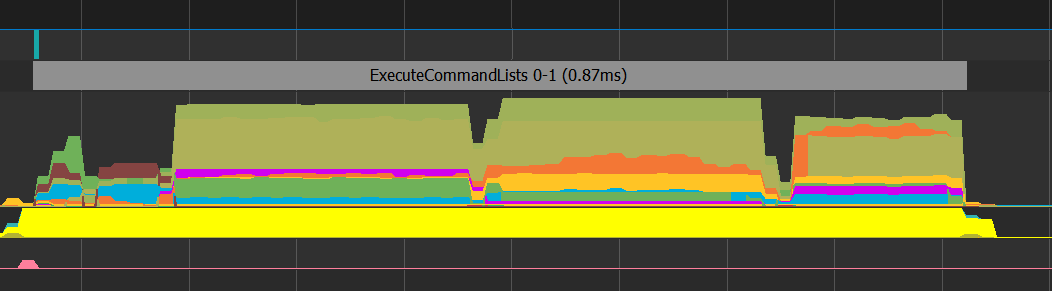
Scrubber: Metrics Graphs
The Metrics Data Rows can track NVIDIA GPU hardware units' activity using performance monitors. GPU Trace enables capturing this data and observing in detail the hardware utilization during frame execution.
|
Note: |
Note: In order to understand more what action items you can conclude from this data, the following blog is recommended: The Peak-Performance-Percentage Analysis Method for Optimizing Any GPU Workload https://devblogs.nvidia.com/the-peak-performance-analysis-method-for-optimizing-any-gpu-workload/ |
When hovering your mouse over the scrubber, a tooltip appears that displays the average of the metrics data per the selected time. The data is sorted from high to low:
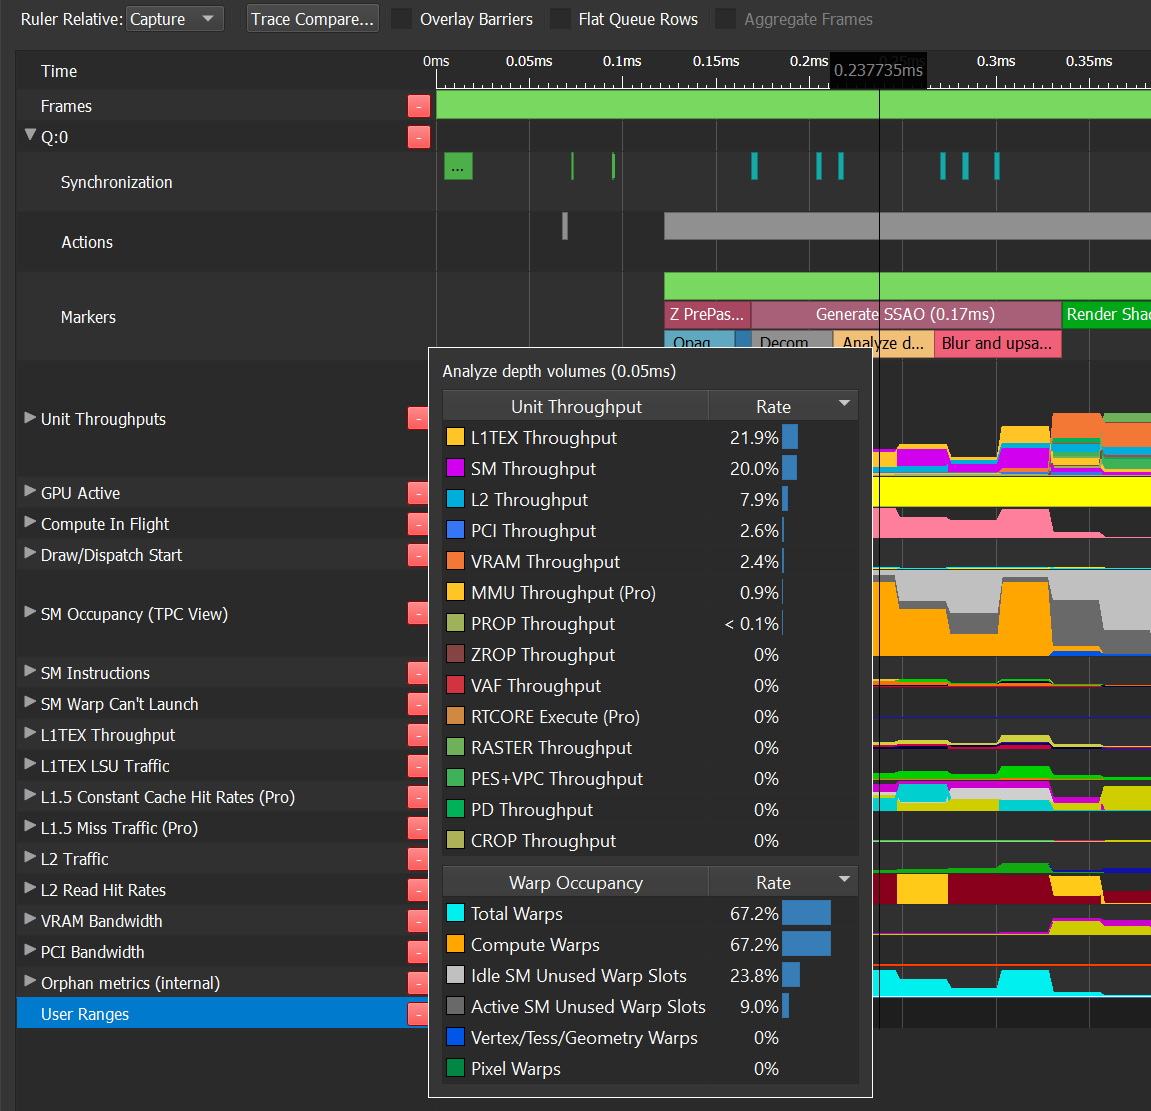
GPU Unit's Metrics Data Rows
GPU Trace presents hardware units' metric data captured throughout the frame execution. This data is presented in the scrubber. Each counter data is presented in a specific row, while some counters are grouped for convenience. Hovering over the metric's name, a tooltip will be presented with the counter description. Group rows can be expanded to view individual counters.
The tooltip shows the counter data for the specific time where your mouse is pointed, or the average counter value for the selected range.
Handling Row in the Scrubber
GPU Trace captures a lot of data. It is possible to arrange the Scrubber in a way that will better meet your current needs and will allow you to focus on the area of your interest.
Removing Rows
Focus your performance triage operation by removing rows that are not the main concern by clicking the red - square.
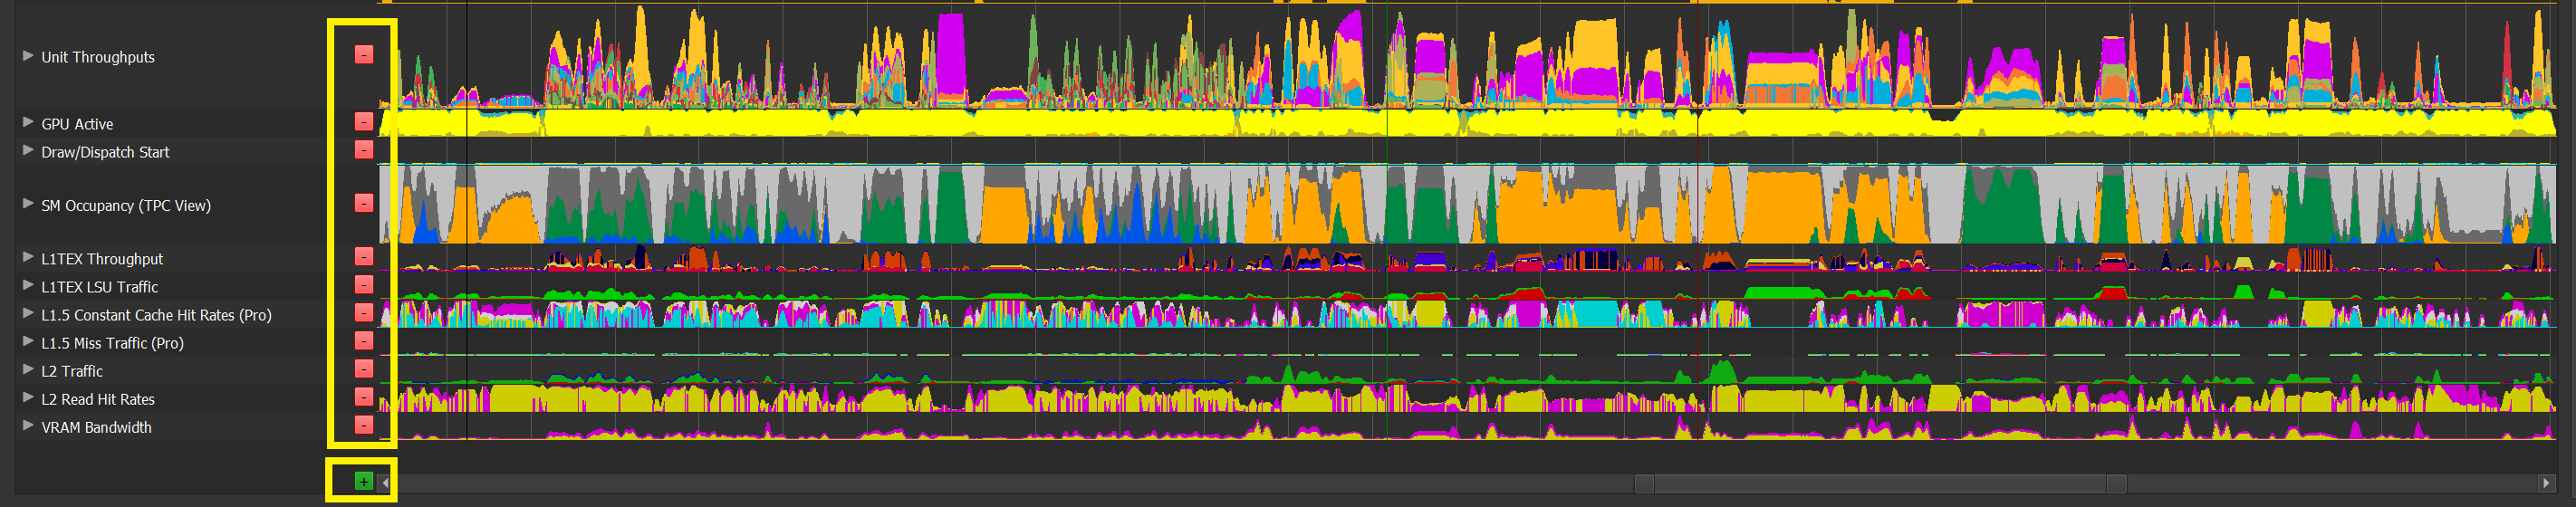
Clicking on the red - square will remove the row from the Scrubber view, but will not delete the data from the database. You can add the row back to the Scrubber by clicking the green + square at the bottom of the Scrubber.
Change Rows Location
You can change the Metrics Data Rows' location by pressing Alt + Left Click and dragging the rows to the desired location.
Pinned Rows Option
GPU Trace Scrubber allows you to pin rows. When hovering over the row, a pinned button will pop up. If you click this row, it will automatically move to the top of the Scrubber and will remain anchored when scrolling down the other rows. You can choose more then one row to pin. This information will be saved so when reopening the file, the settings will remain. In the below example, the markers row is pinned, and this will allows you to keep the markers row visible:
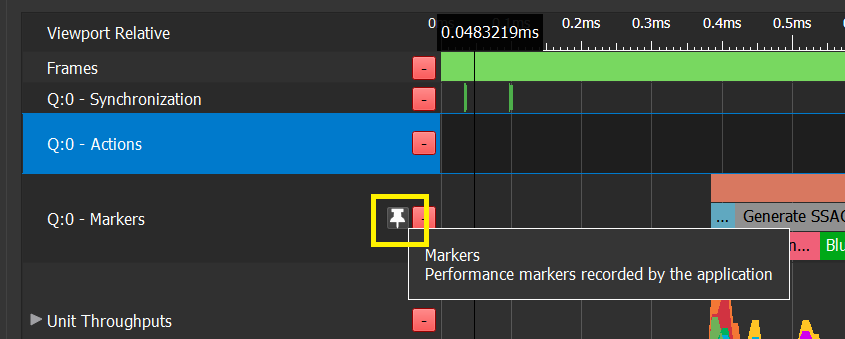
User Ranges
User Ranges are ranges that can be added and edited on the captured file. This can be used as personal notes and enhance performance triage capabilities.
To add a user range:
-
Select a range in the User Ranges row with "SHIFT + Mouse Right-Click."
-
In the dialog that pops add you label and description.
-
Press OK.
-
Next to the capture file name, there is an asterisk (*), which indicates that this capture has been edited.
-
You can edit or remove the marker by using the right-click menu.
User ranges acts like any other marker and its data is reflected accordingly in the Summary and Metrics tab. The user ranges information can also be viewed in the ranges table.
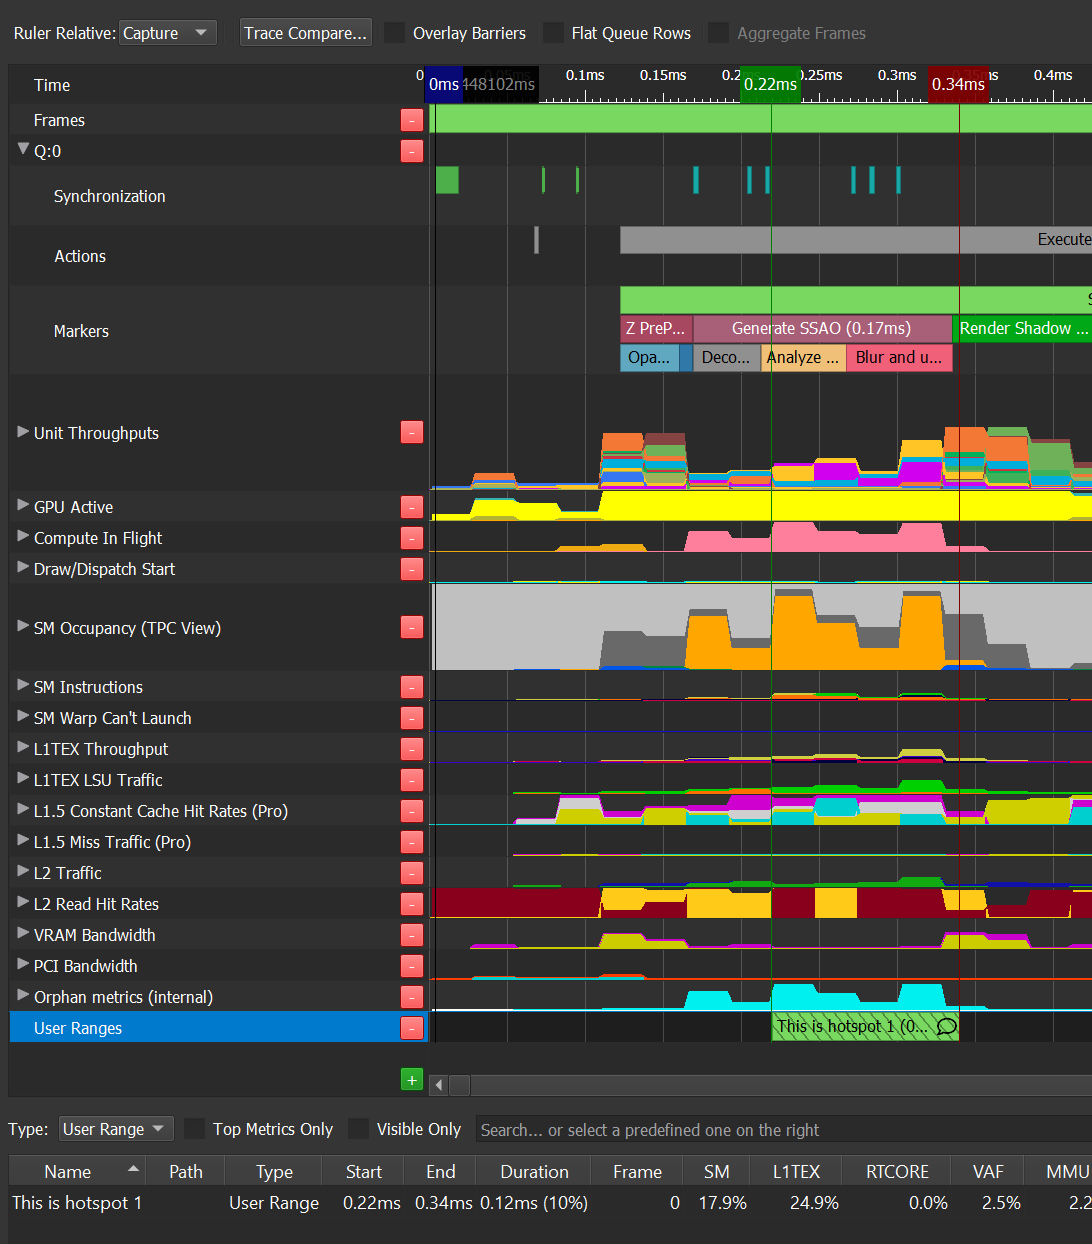
Information Tabs
The Information Tabs section provides general information on the capture, and also provides an additional view on the metrics data that were captured.
It contains 3 tabs:
Summary Tab
The upper section on the Summary tab provides details for the selected range. If no selection has been made, the information will be relevant to the entire visible range:
-
Start: The start time of the selected range or the visible range.
-
End: The end time of the selected range or the visible range.
-
Duration: The duration on the selected range or the visible range.
-
Range: An indicator whether the relevant data is applicable to a selected range on the visible range.
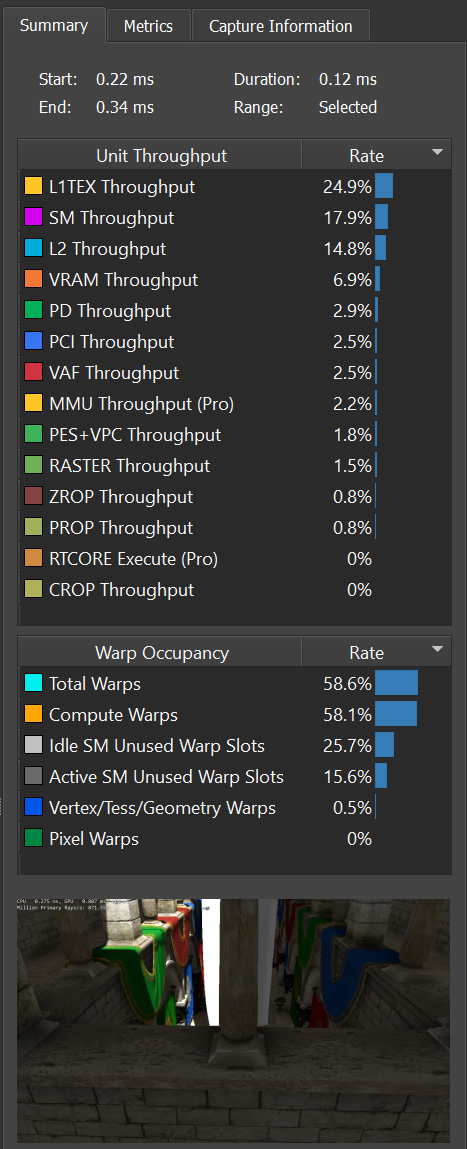
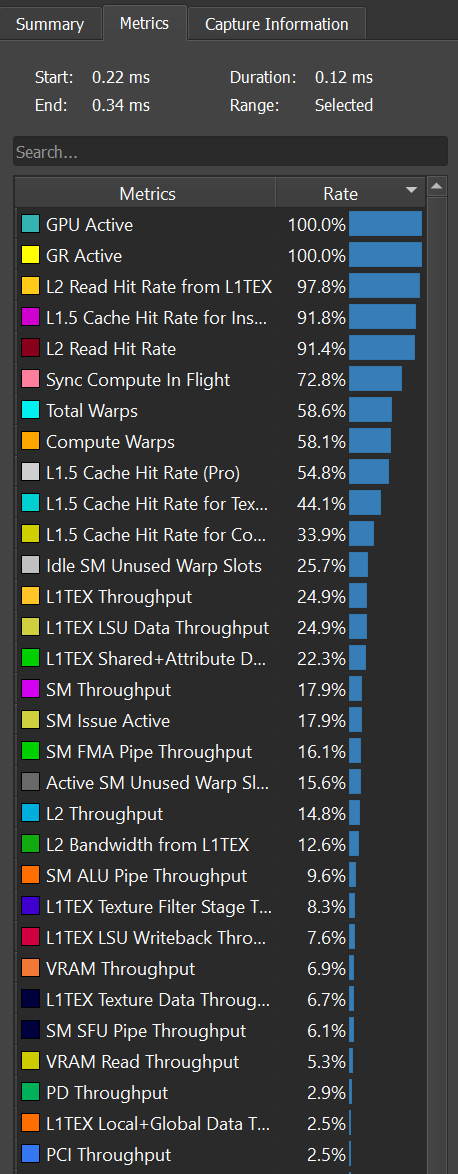
Capture Information Tab
The Capture Information tab provides general information of the capture, such the GPU model, CPU, and operating system that were used for the executable and comma line arguments run. This might be useful when trying to analyze workload behavior or reproduce issues.
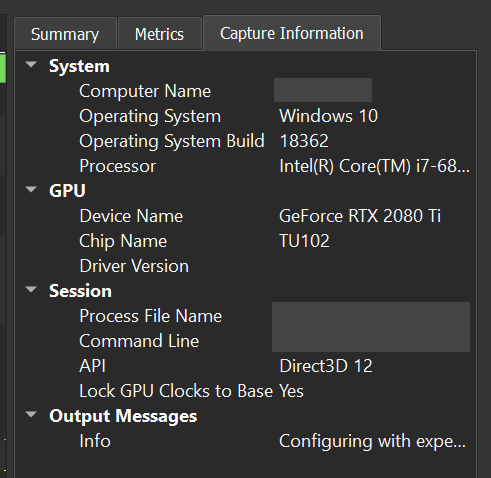
Note that if there were any warnings or errors occurred while making this capture, they will appear in this tab.
Ranges Table
The Ranges Table shows the various ranges in the trace (primarly user markers) and their associated metric data. It is correlated with the scrubber, so selecting a marker in the table automatically selects the marker in the scrubber (and vice-versa).
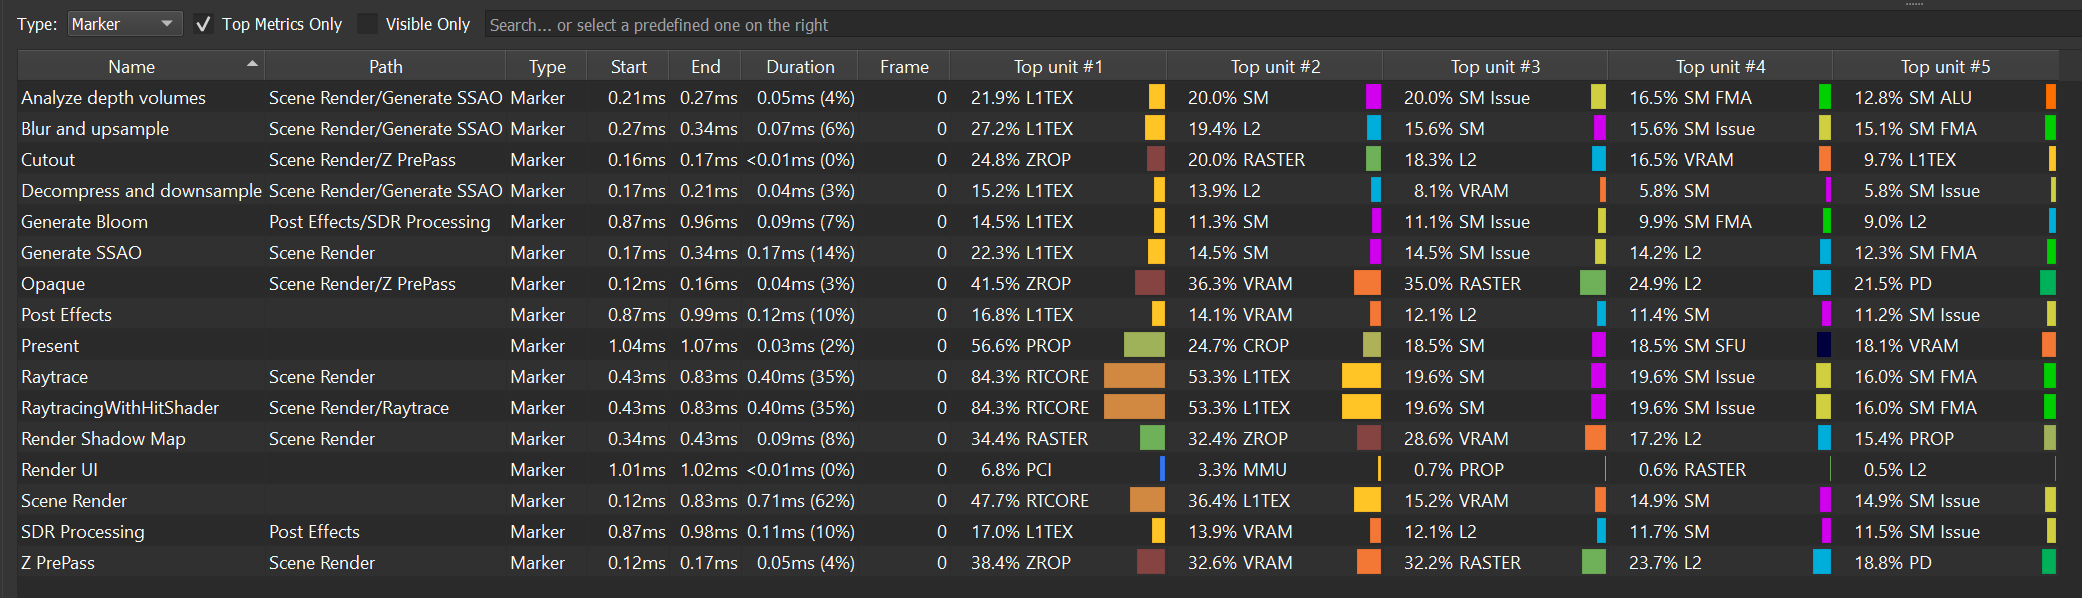
Type
You can select which type of ranges the table displays (with the default being user markers).
Top Metrics Display
With this option enabled, the table shows just the highest metric values for each range. You can change the number of top metrics and their appearance in the settings.
Only Visible
By checking this option, the ranges in the table will be automatically limited to the visible ranges in the scrubber.
Copy Data
For convenience, you can select data from the table and copy to clipboard or save it as a CSV file.
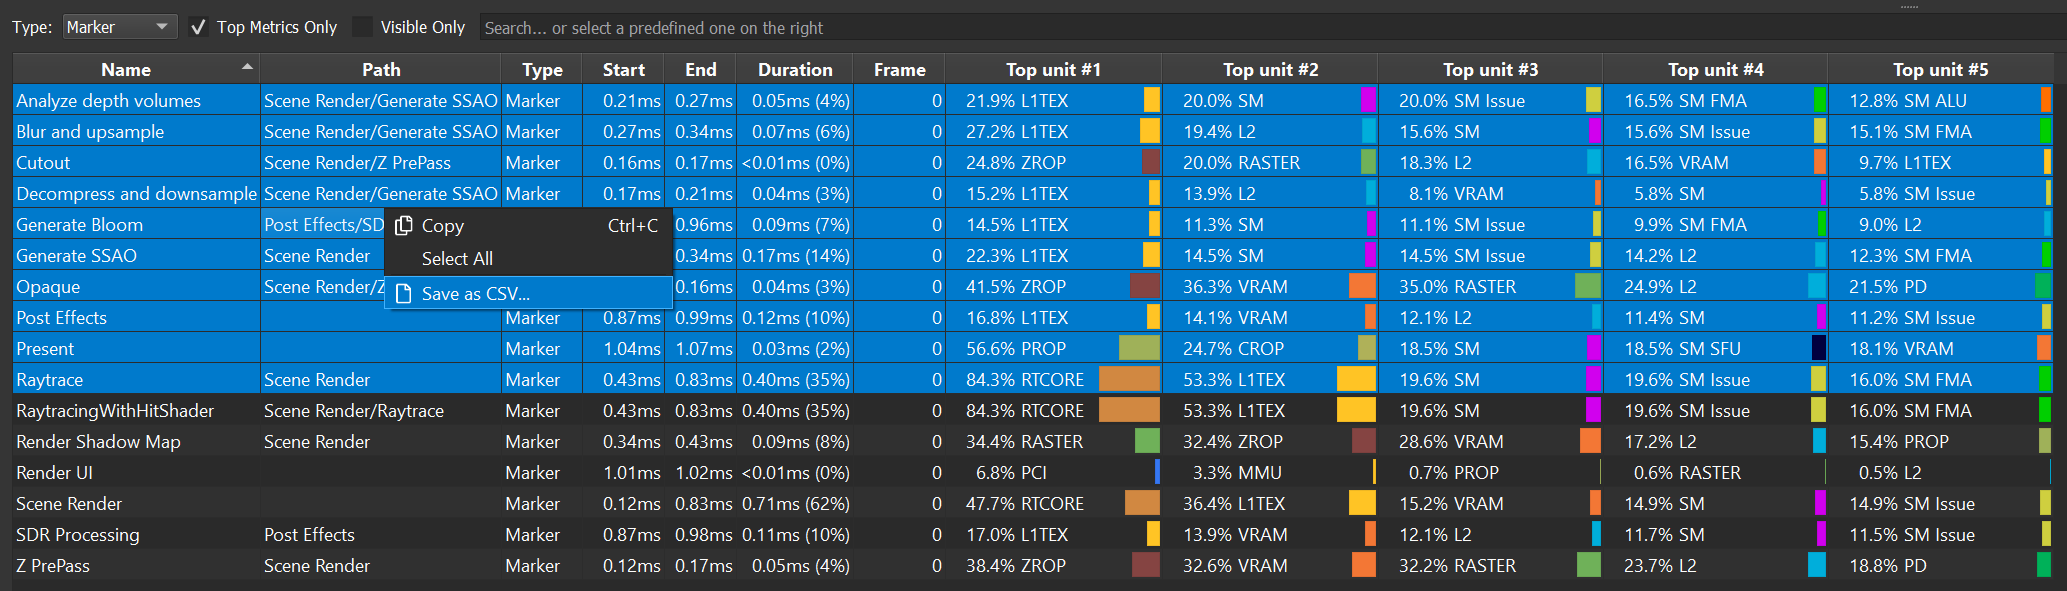
Search Area
You can search for a specific range name by simply typing the range name or part of it. This is a powerful filter that can help detect areas of interest. Examples of such filters:
- $('SM') > 50 && $('VRAM') < 20 : This filters for all the markers where its SM values is higher than 50 and VRAM is lower then 20.
- $('Top Unit #1') > 50: This filters for all markers where the top unit value is larger than 50.
Trace Compare
The Trace Compare tool enables the GPU Trace user to easily analyze the effect of his code changes on a specific frame. It displays a simplified version of the GPU Trace time line for 2 frames. The frames are placed one on top of the other, with their start time aligned. Trace compare enables to compare either 2 frames from 2 different capture files or 2 frames within the same file.
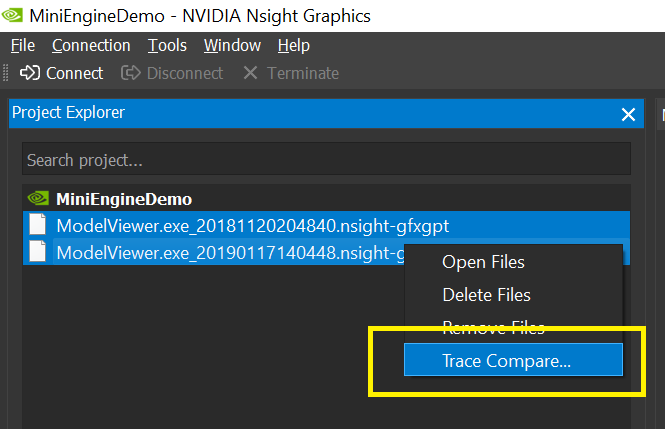
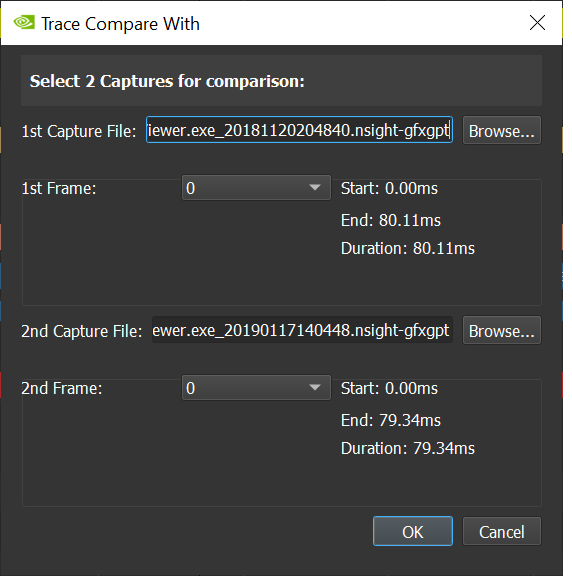
Using the Trace Compare Tool
Trace Compare displays the selected frames in a simplified version of the GPU Trace timeline, one on top of the other, aligning the frames' start time.
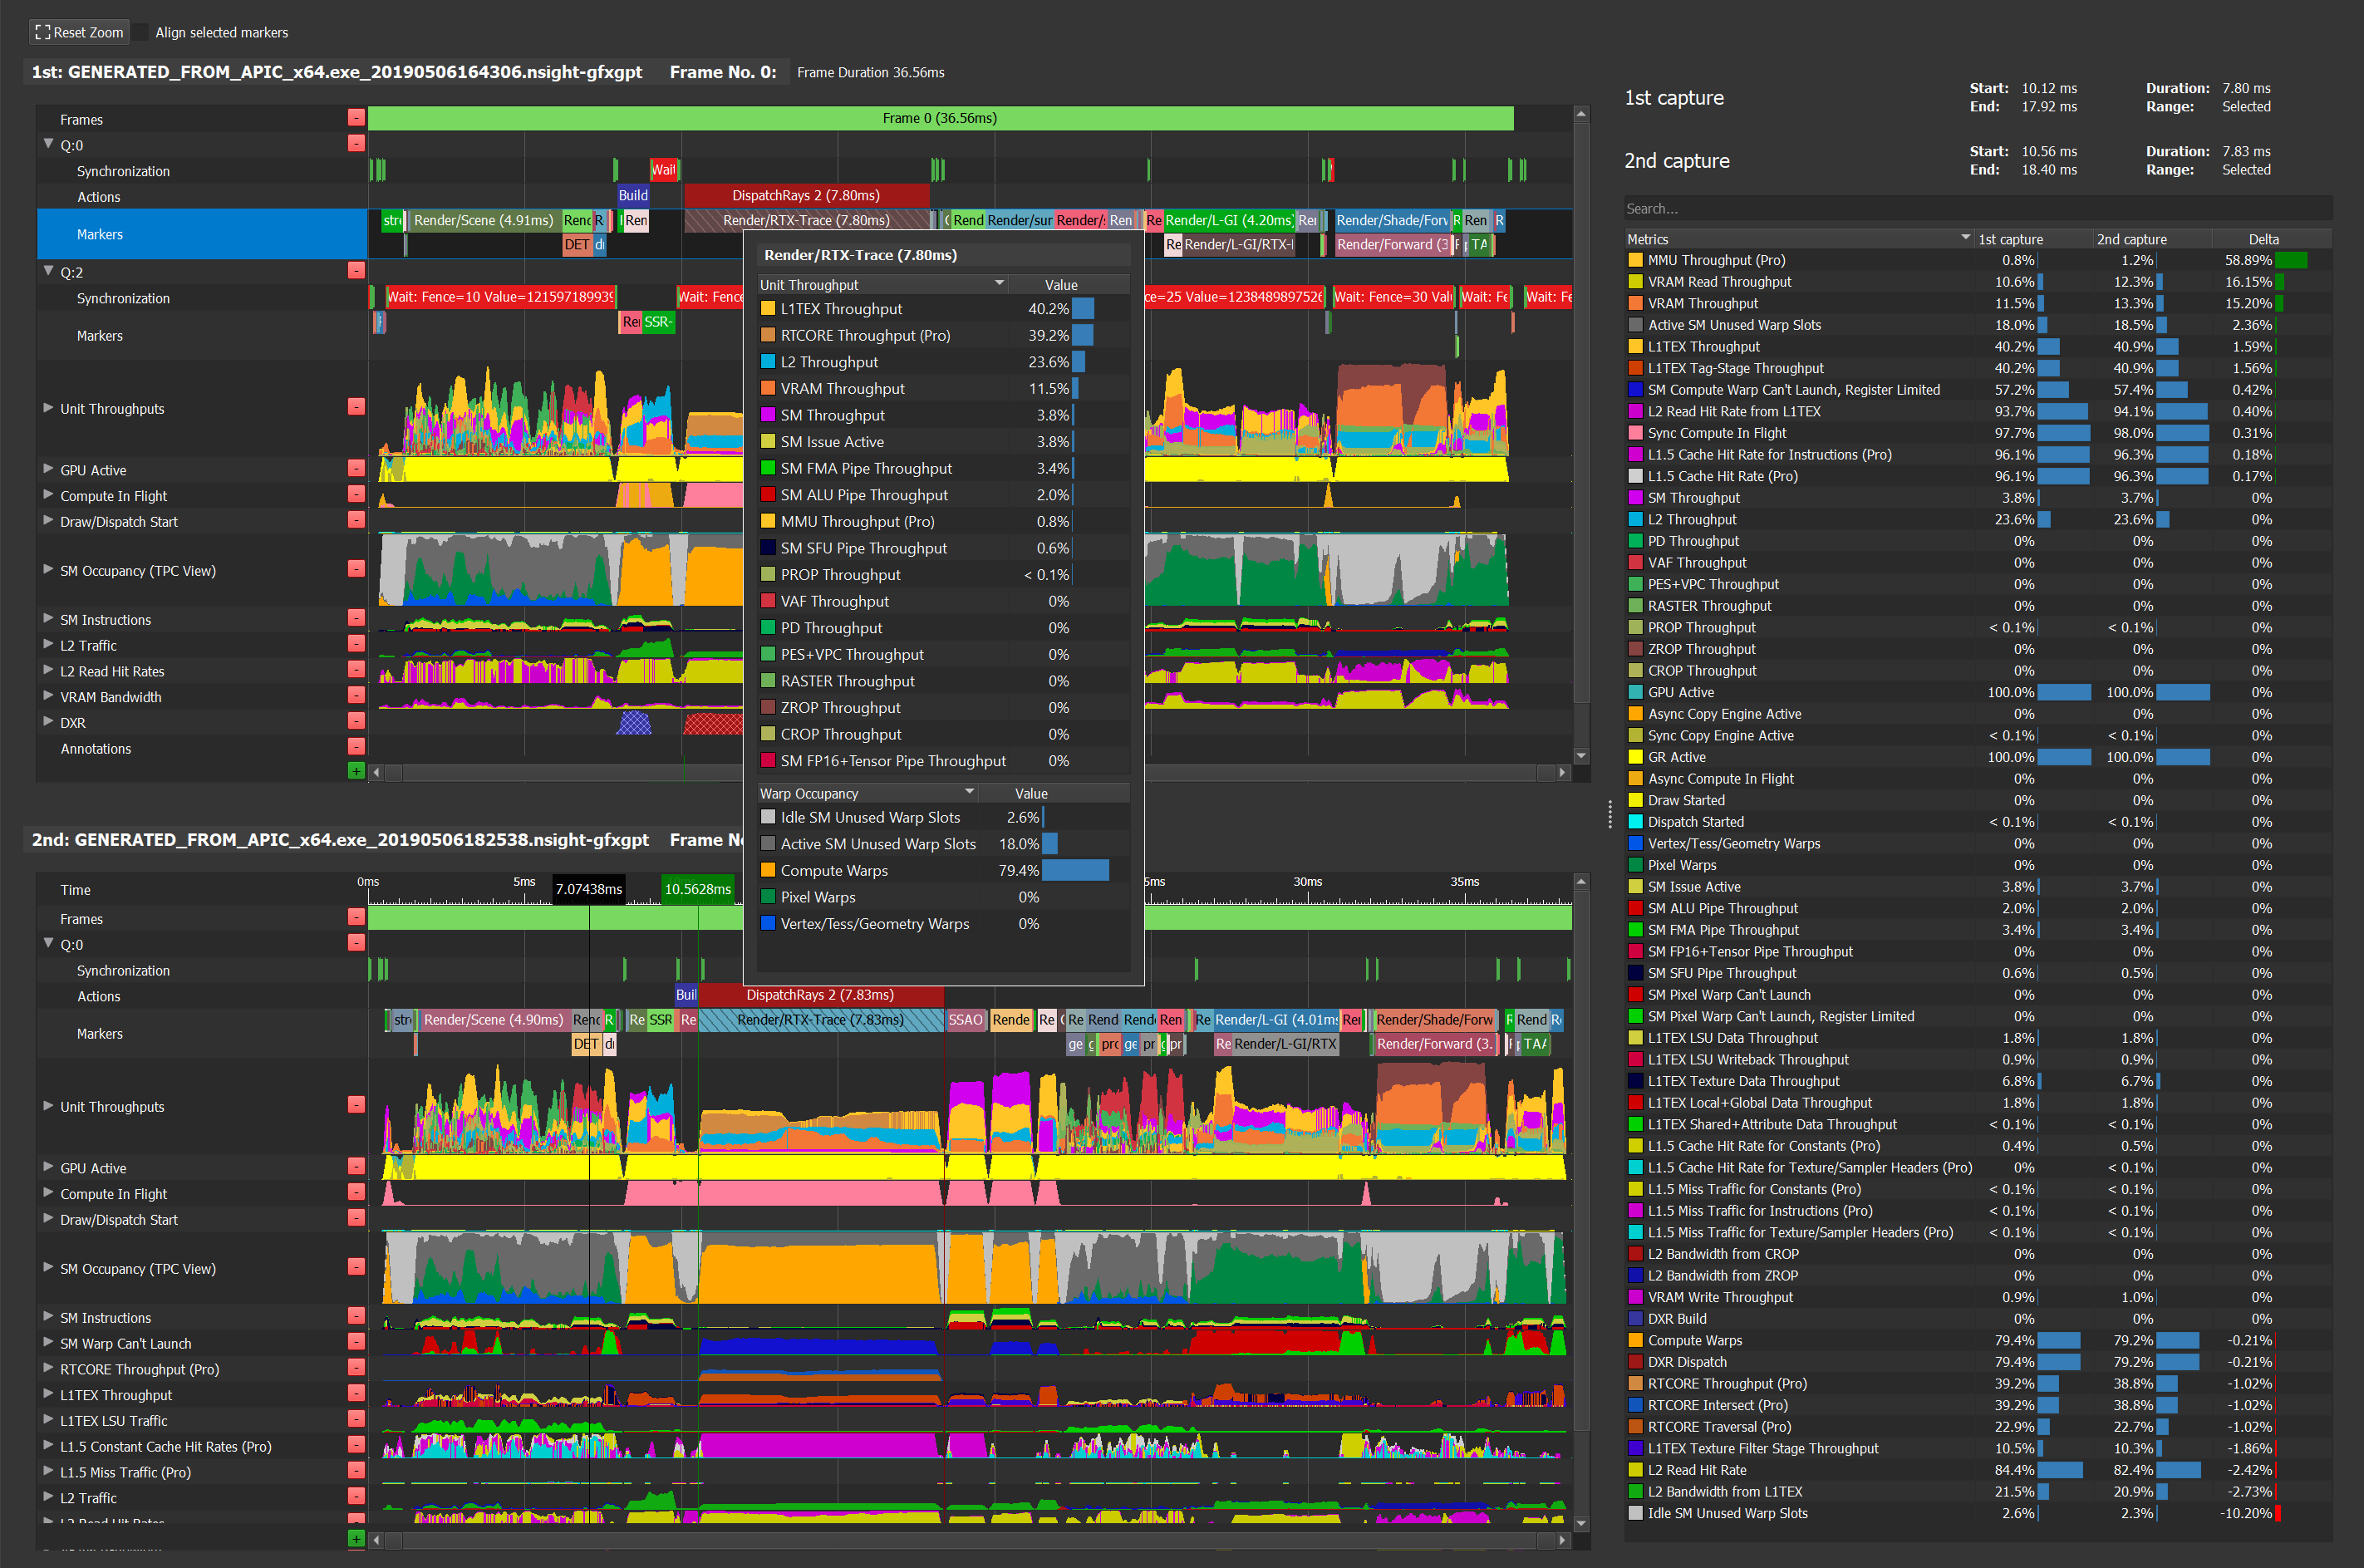
Markers are correlated as well, so when you click on a certain marker on one frame, the matching marker on the other frame will be chosen, if found.
Align to Marker
Sometimes it is easier to spot differences when the selected markers' start times are aligned. Choose a specific marker and click the Align Selected Marker check box to activate the alignment.
Metrics Table in Trace Compare Mode
The detailed Metrics Table appears in this mode and shows the metrics data for each frame, side by side, and the delta between the values.
Profiling Applications with no Graphics [BETA Feature]
GPU Trace enables profiling graphics applications. It relies on frame boundaries to set up the profiling session duration. Modern Graphics APIs, such as DX12 and Vulkan, enable compute work using compute shaders. We see now more and more applications that use compute only shaders for multiple purposes, such as applications that use WinML, and test applications that perform Ray Tracing calculations. GPU Trace now is able to profile such applications to help users improve those applications' performance.
Setting up the GPU Trace project:
To profile such applications there is a need to change the capture type to “One-shot” as shown in the below figure:
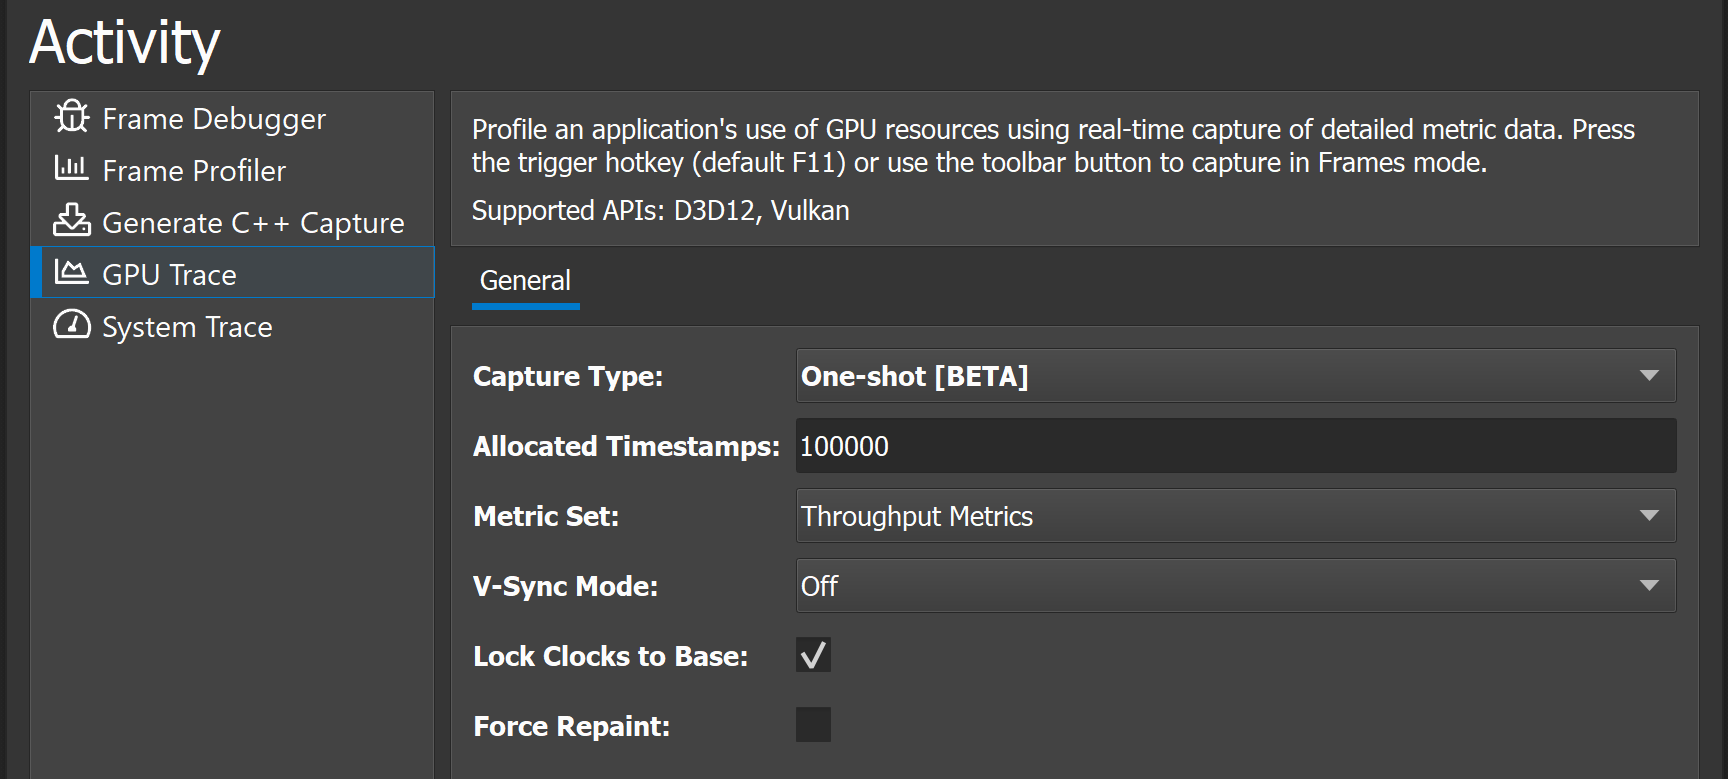
Set the rest of the project setting as you normally would, providing the executable file and path, working directory, command line arguments and environment variables.
Generating a Trace:
To generate a trace, all you need to do is press the “Launch GPU Trace” button. A trace will be automatically generated when GPU Trace will detect the supported API is in flight.
Open a trace file:
Once the trace has been created, simply open the generated file and analyze it as you normally would.
Things to keep in mind:
Timestamp Count
GPU Trace is a detailed profiler and it collects a lot of metrics data, hence, it is limited in the profiling session duration. You may notice a new argument in the GPU Trace project dialog, with “Timestamp Count” default number. This number influences the size of the buffer that the GPU Trace will allocate to keep track of the GPU events. If you get an error message in the “Output Messages” window saying you run out of resources you might want to try and increase the timestamp count value:
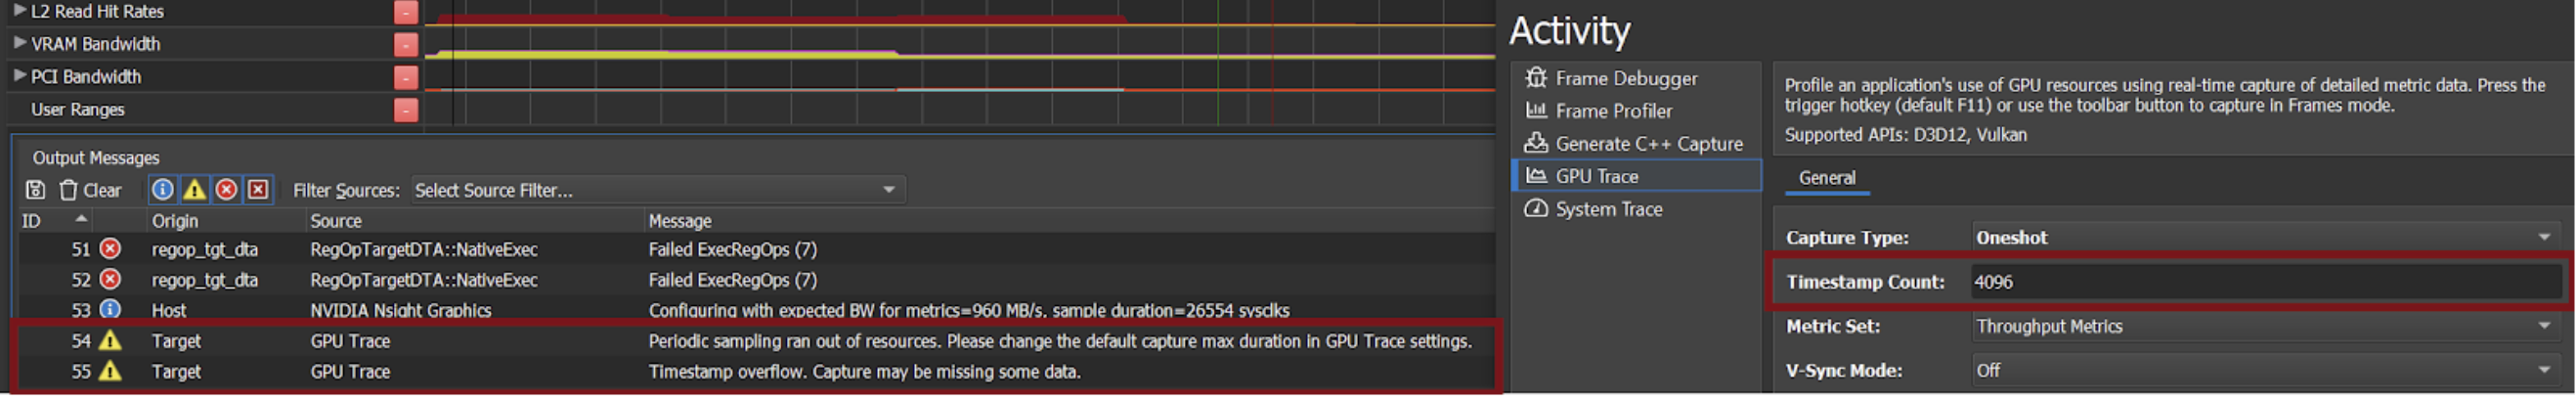
Application disconnected:
GPU Trace host launches the target application and profiles it. In this mode the target application may exit automatically, upon application end, you may get warning message saying the communication to the target was lost even though the trace was generated and all worked fine.
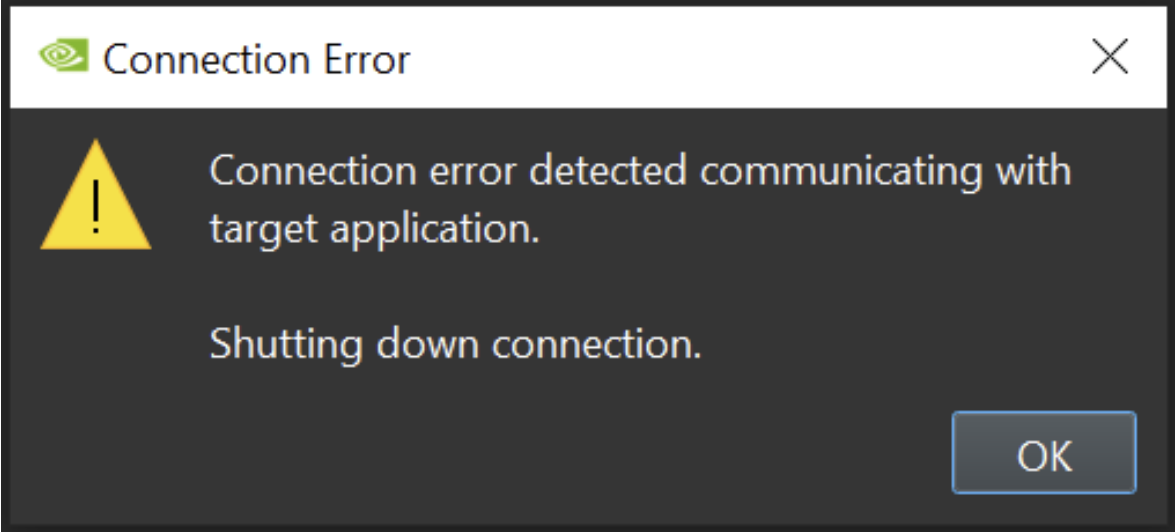
Additional Capture Options
Nsight Graphics framework enables launching an application with a specific set of command line arguments and / or environment variables. This is done via 'Connect to Process' dialog.
Below are special pre-defined environment variables:
Automatic capture after X number of frames
Set WARPVIZ_CAPTURE_ON_FRAME to trigger a capture automatically after X number of frames elapsed.
For example:
WARPVIZ_CAPTURE_ON_FRAME=100 will trigger capture automatically, once, after 100 frames.
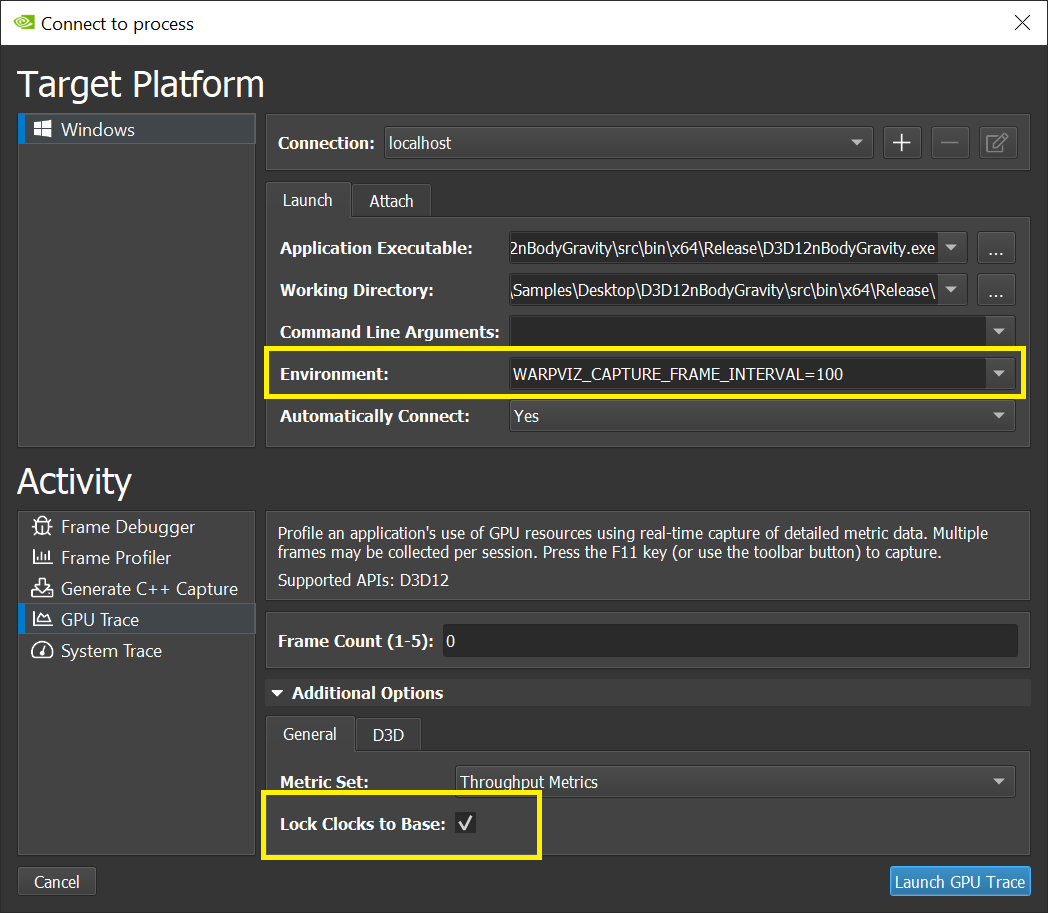
Capture with Advanced Mode
GPU Trace capture hardware throughput data on a single frame. This data is collected according to the metrics set defined when launching the application. It is now possible to configure the application to run in 'Advanced Mode'. In this mode, the GPU Trace will automatically capture many more counters on consecutive frames. At the end of the capture, you will be able to view all this data presented as a single profiling session.
This mode provides additional counters that may explain "Why" there is low throughput.
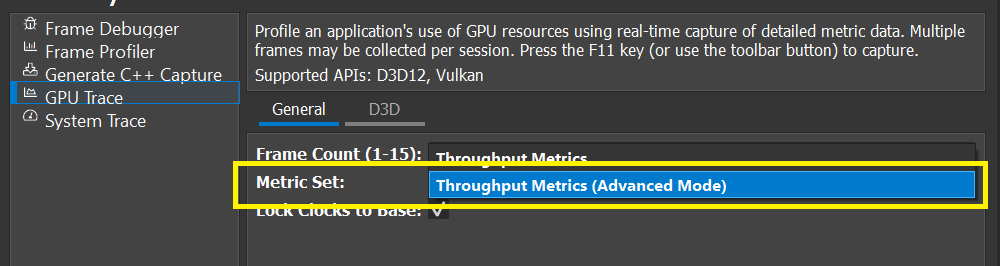
Capture in Advanced mode:
You can capture using the Target application capture hotkey or the "Generate Capture File" as in the regular mode. However, you might notice that the capture takes a longer time. This is because in this mode much more data is being collected.
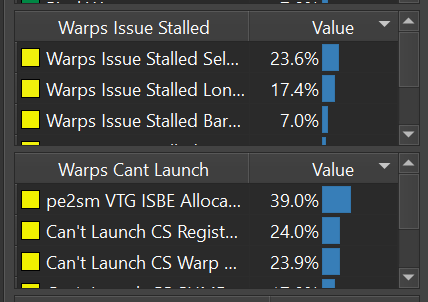
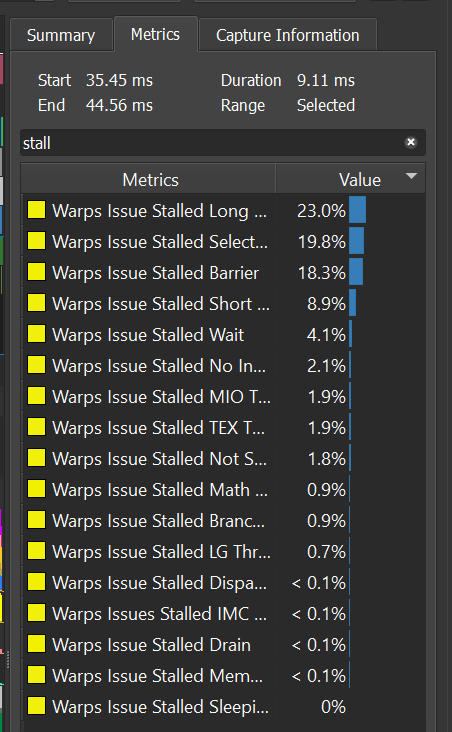
GPU Crash Dumps
GPU Crash Dump Monitor
GPU Crash Dump Monitor Settings
To configure the NVIDIA Nsight Aftermath Monitor settings, left-click the NVIDIA Nsight Aftermath Monitor icon in the Microsoft Windows system notification area (system tray) or right-click the icon and select the Settings option from the pop-up menu.
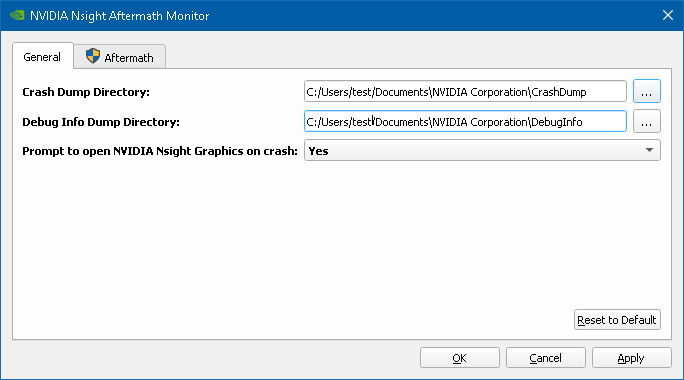
Aftermath Settings
The Aftermath Settings page allows you to configure various Nsight Aftermath driver options and set up a whitelist of applications for which to capture GPU crash dumps. These driver settings can only be modified if the NVIDIA Nsight Aftermath Monitor was started with Windows Administrator privileges.
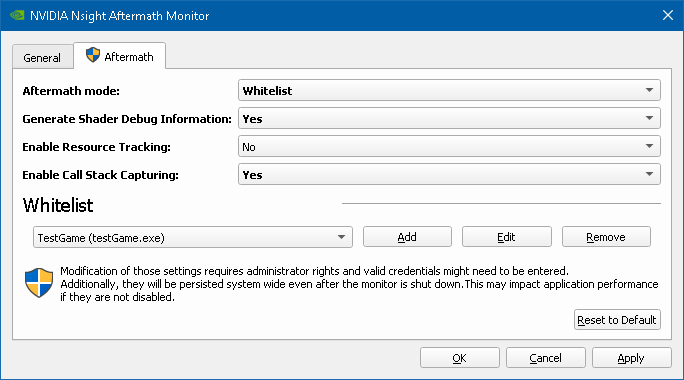
Supported Aftermath Modes are the following:
-
Disabled disables all GPU crash dump creation.
-
Global enables crash dump creation for all applications using the D3D12 or Vulkan APIs.
-
Whitelist allows you to limit the GPU crash dump creation to a specific set of applications on the whitelist.
Generate Shader Debug Information enables debug information generation for shaders.
Note:
Enabling this setting will cause additional compilation overhead for generating the debug information and general driver overhead for handling the debug information during shader compilation.
Enable Resource Tracking enables driver side tracking of resources (textures, buffers, etc.) used to augment the GPU fault information in crash dumps.
Note:
Enabling this feature will cause additional driver overhead for tracking resource information.
Enable Call Stack Capturing enables automatic tracking of CPU call stacks for draw calls, dispatches, and copies. This data is collected for these calls, or can augment the data collected via Aftermath user markers. Enabling this feature will cause additional driver overhead for gathering the necessary information.
Note:
As with other crash dumps (like Windows minidump files), when this feature is enabled, the GPU crash dump file may contain the file path for the crashing application's executable, as well as the file paths for all DLLs loaded by the application.
Command Line Settings
All crash dump monitor settings can be also configured through command line parameters. The available options are:
-
--help Print help message with a list of available options.
-
--version Print the release version of the executable.
-
--crashdump-dir arg Set crash dump directory.
-
--debuginfo-dir arg Set debug info dump directory.
-
--prompt-on-crash Prompt to open Nsight Graphics after a crash is generated.
-
--hostname argThe host name of the machine on which to look for already existing Nsight Graphics instances.
Aftermath settings can be configured through a separate command line tool installed next to the crash dump monitor application: nv-aftermath-control.exe. The available configuration options are:
-
--mode arg Set Nsight Aftermath mode. Supported options for arg are: Disabled, Whitelist, or Global.
-
--debuginfo Generate shader debug information.
-
--resource-tracking Enable resource tracking.
-
--callstacks Enable call stack capturing.
-
--whitelist arg Add application to the Nsight Aftermath whitelist. arg must be of the following form:
ApplicationName MyApp ExecutableName myApp.exe
This option can be repeated to add multiple applications to the whitelist. This option also clears a previously set up whitelist.
Modifying Aftermath settings requires Windows Administrator privileges. Therefore, when this tool is run, a User Account Control confirmation window may pop-up asking for permission to modify system settings.
New Crash Dump Notification Dialog
If the NVIDIA Nsight Aftermath Monitor is configured to prompt on new crash dumps, every time a new GPU crash dump file is stored to the crash dump directory, a notification dialog will pop up indicating that a new GPU crash dump is available. This dialog shows the name generated for the new crash dump and also allows you to directly open it in a newly launched instance of Nsight Graphics or in an already running instance of Nsight Graphics.
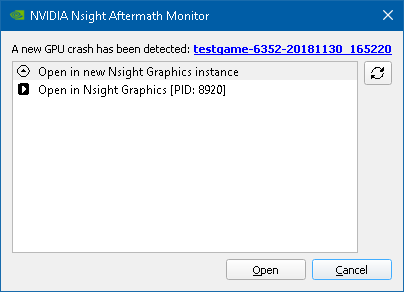
GPU Crash Dump Inspector
The GPU Crash Dump Inspector window is comprised of two major views:
-
In the left part of the window, there is a set of tabs that provide summary information for the open GPU crash dump file, as well as information about the captured crash.
-
In the right part of the window, there is a multi-purpose area that shows detailed information based on selections made in some of the sections of the left-side tabs.
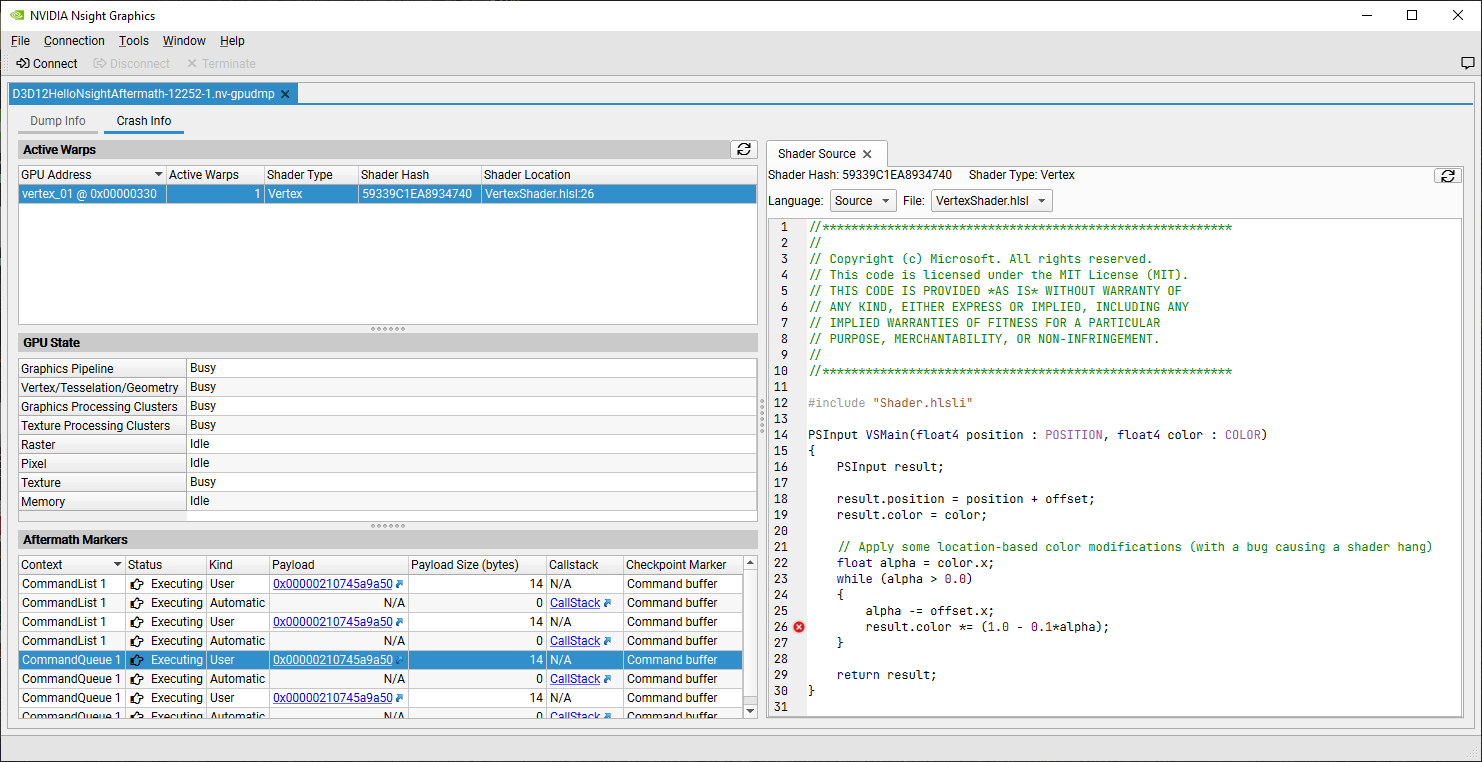
Dump Info
The Dump Info tab provides summary information for the open GPU crash dump file and the data contained in the dump. It is comprised of the following sections:
-
The Dump Details section summarizes information about the GPU crash dump file, such as the file name, the date and time the dump was created, and the size of the file.
-
The Application section summarizes information about the application for which the GPU crash dump file was captured, like the name of the executable, the process identifier of the corresponding process, and which graphics API was used.
-
The Exception Summary section summarizes information about the reason for the GPU crash or GPU hang captured in the GPU crash dump file. It shows what state the graphics adapter and D3D or Vulkan device were in when the device recovery was triggered (TDR).
-
The System Info section summarizes the information about the system on which the GPU crash dump file was captured. This include information about the operating system, the graphics driver, and the GPU on which the has crash happened.
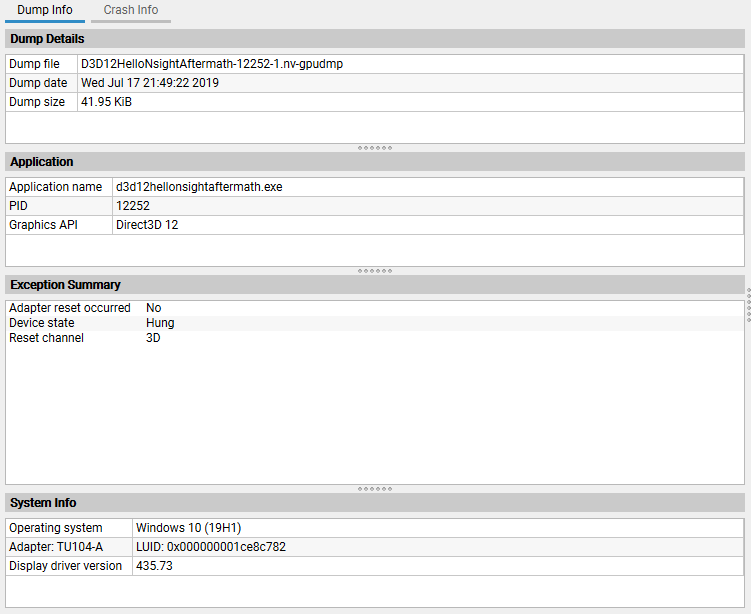
Crash Info
The Crash Info tab provides detailed information for data captured in the open GPU crash dump file. The available sections will vary based on the type of the crash and what information was captured into the crash dump.
-
The Active Warps section, if available, shows all active shader executions at the time of the crash or hang. Each row shows the summary for all the warps executing at a specific shader address, including the number of warps, the type of the shader, the shader hash, and the corresponding location within the source shader (if source shader debug information is available). Clicking a row in the table will open the corresponding Shader View.
-
The Page Fault section, if available, shows information about the GPU page fault that caused the crash. Besides the address that caused the page fault, it may also show information about the resource that is mapped or was mapped at that address.
-
The GPU State section shows a high-level summary of the state of various parts of the GPU. This can be helpful to track down which parts of the graphics pipeline were active or have faulted in the case of a crash.
-
The Aftermath Markers section, if available, shows a summary of the Aftermath event markers last processed by the GPU for each of the registered Aftermath contexts. Clicking the links in the table will open the corresponding Aftermath Markers View or Aftermath Call Stack View. See also the event marker documentation in GFSDK_Aftermath.h for more detail.
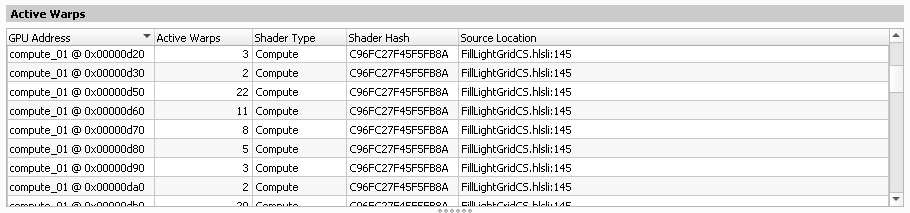
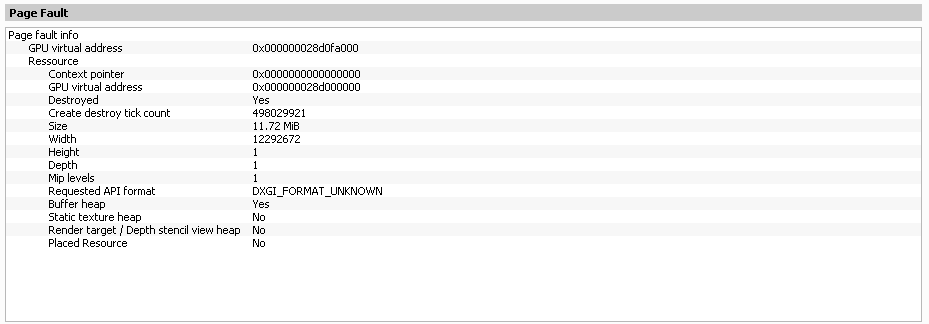
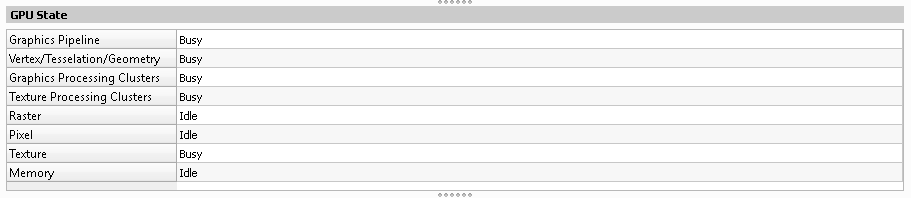
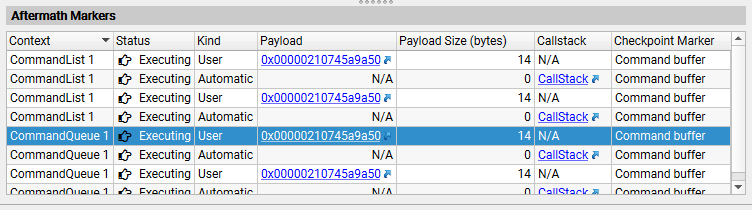
Shader View
The Shader Source view shows the shader code related to the selection made in the Active Warps view. Depending on what information is available for the shader the Language selection box provides the following options:
-
If Source is selected the view shows the high-level shader source of the shader corresponding to the row selected in the Active Warps view. If the shader was compiled from several source files the File selection box allows to switch between the source files. The shader source line that was executed when the crash dump was created is marked with a red circle.
-
If IL is selected, the view shows the intermediate assembly of the shader (DXIL or SPIR-V) corresponding to the row selected in the Active Warps view. The assembly statement that was executed when the crash dump was created is marked with a red circle.
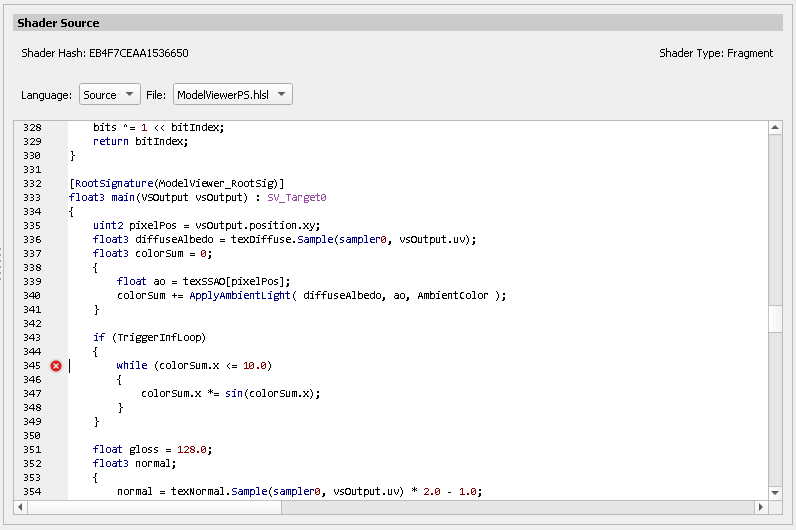
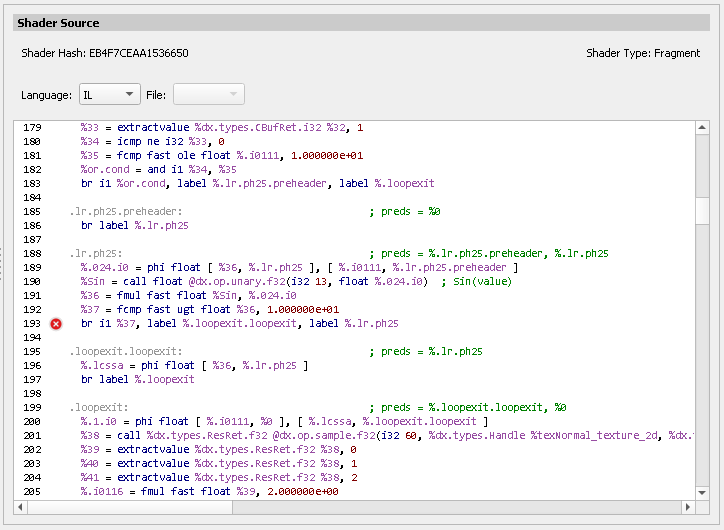
Aftermath Marker Data View
The Aftermath Marker Data view allows inspection of the Aftermath event marker data provided by the application. Since Aftermath event marker data is typeless the marker data view supports different Data view modes for interpretation of the raw data:
-
As string interprets the event marker data as zero-terminated UTF-8 character string.
-
As wide string interprets the event marker data as zero-terminated wide character string.
-
Custom allows to inspect the raw event marker byte data or to provide a custom interpretation of the data using a Structured Memory Configuration.
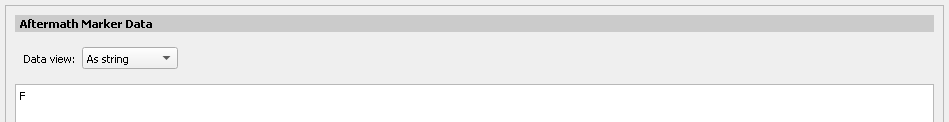
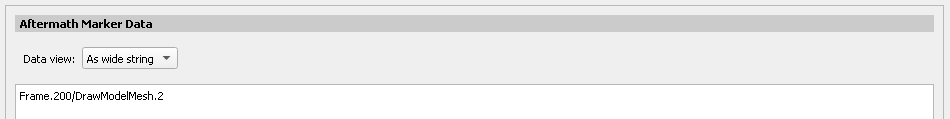
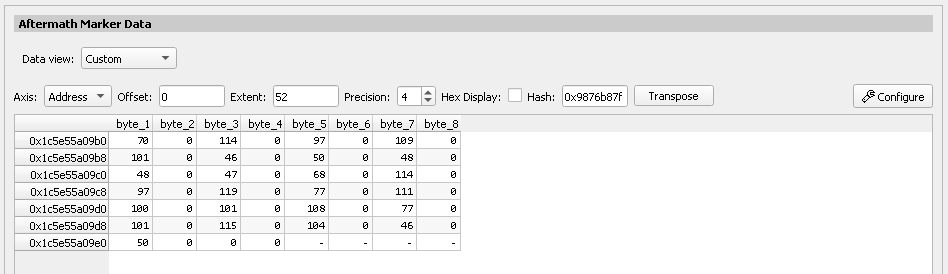
Aftermath Marker Call Stack View
The Aftermath Marker Call Stack view shows the call stack for the last draw, dispatch, or copy call processed by the GPU. Resolving the call stack to source location requires a properly set up symbol search path in the Search Paths Settings. Alternatively, clicking the Unknown Symbol link allows to provide a symbol file for a specific call stack element.
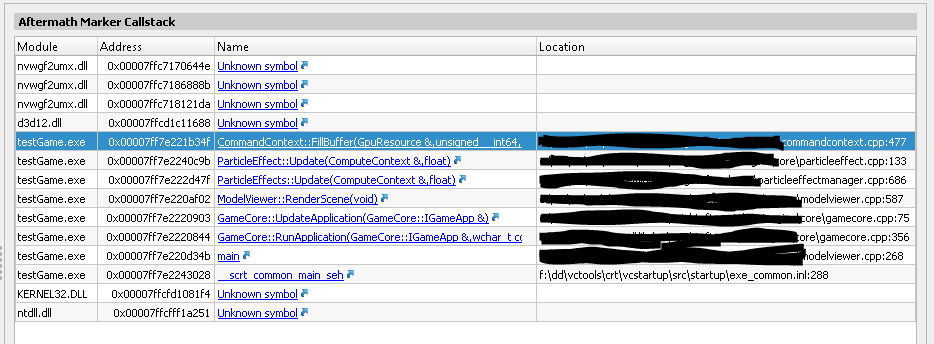
Project Explorer
The Project Explorer offers a view of all data associated with the current project. It will contain data files, sorted by the time of generation. Note that you may also include arbitrary links to other files as a useful aid in correlating data.
Items in the Project Explorer can be adjusted by right-clicking and selecting an option to interact with it. They may also be renamed by selecting the item and pressing F2.
In addition to navigating via the Project Explorer, you may wish to see the files that were recently generated. Load these through File > Recent Files, or File > Open File.
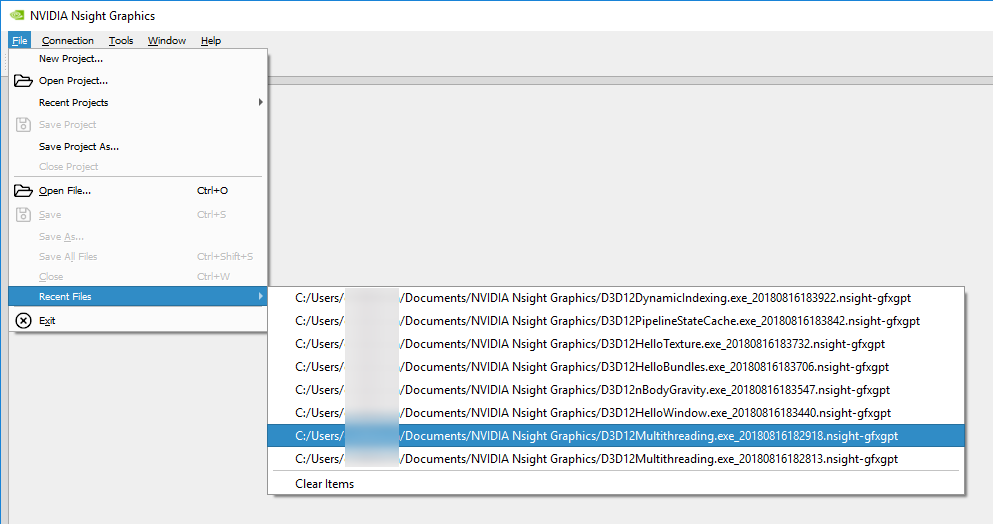
Options
The Options dialog, accessed via the Tools > Options... menu, allows you to configure Nsight Graphics in a number of different ways. Each section is detailed below. The options selected are persisted in user settings for the next time you run the tool.
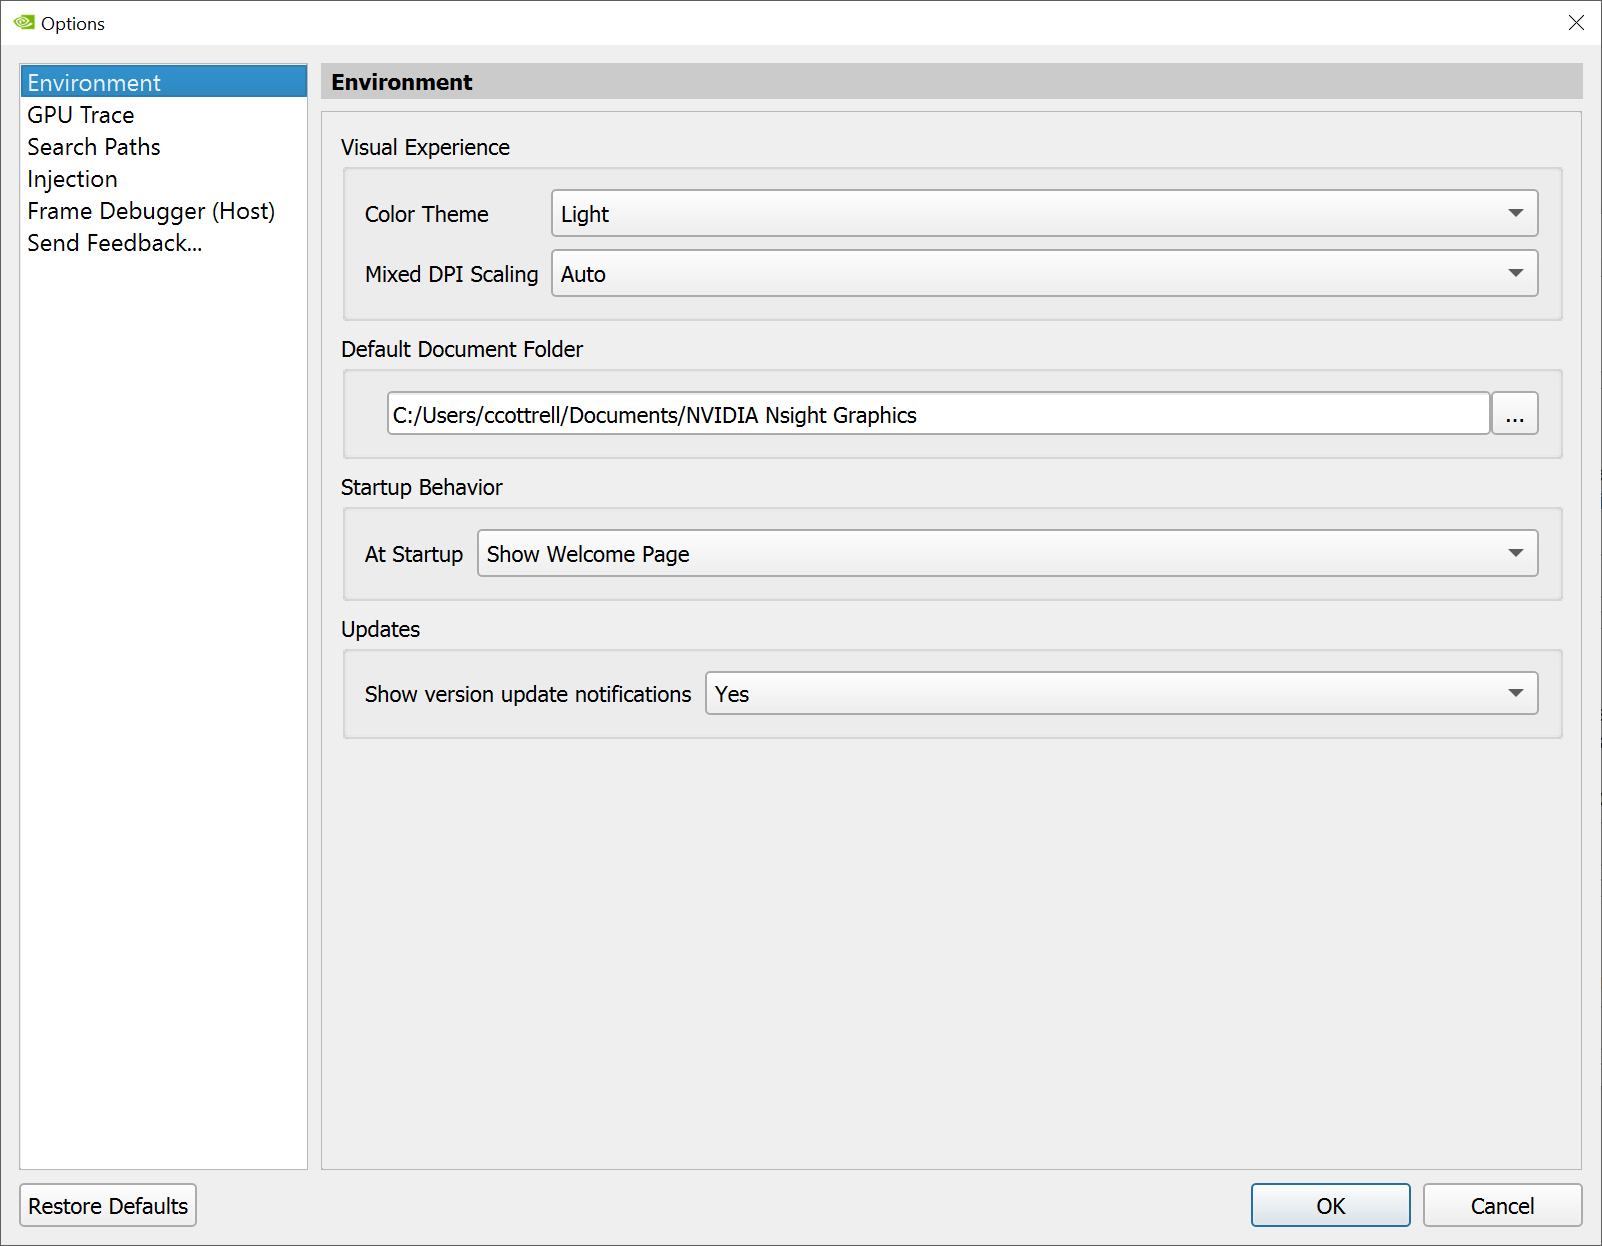
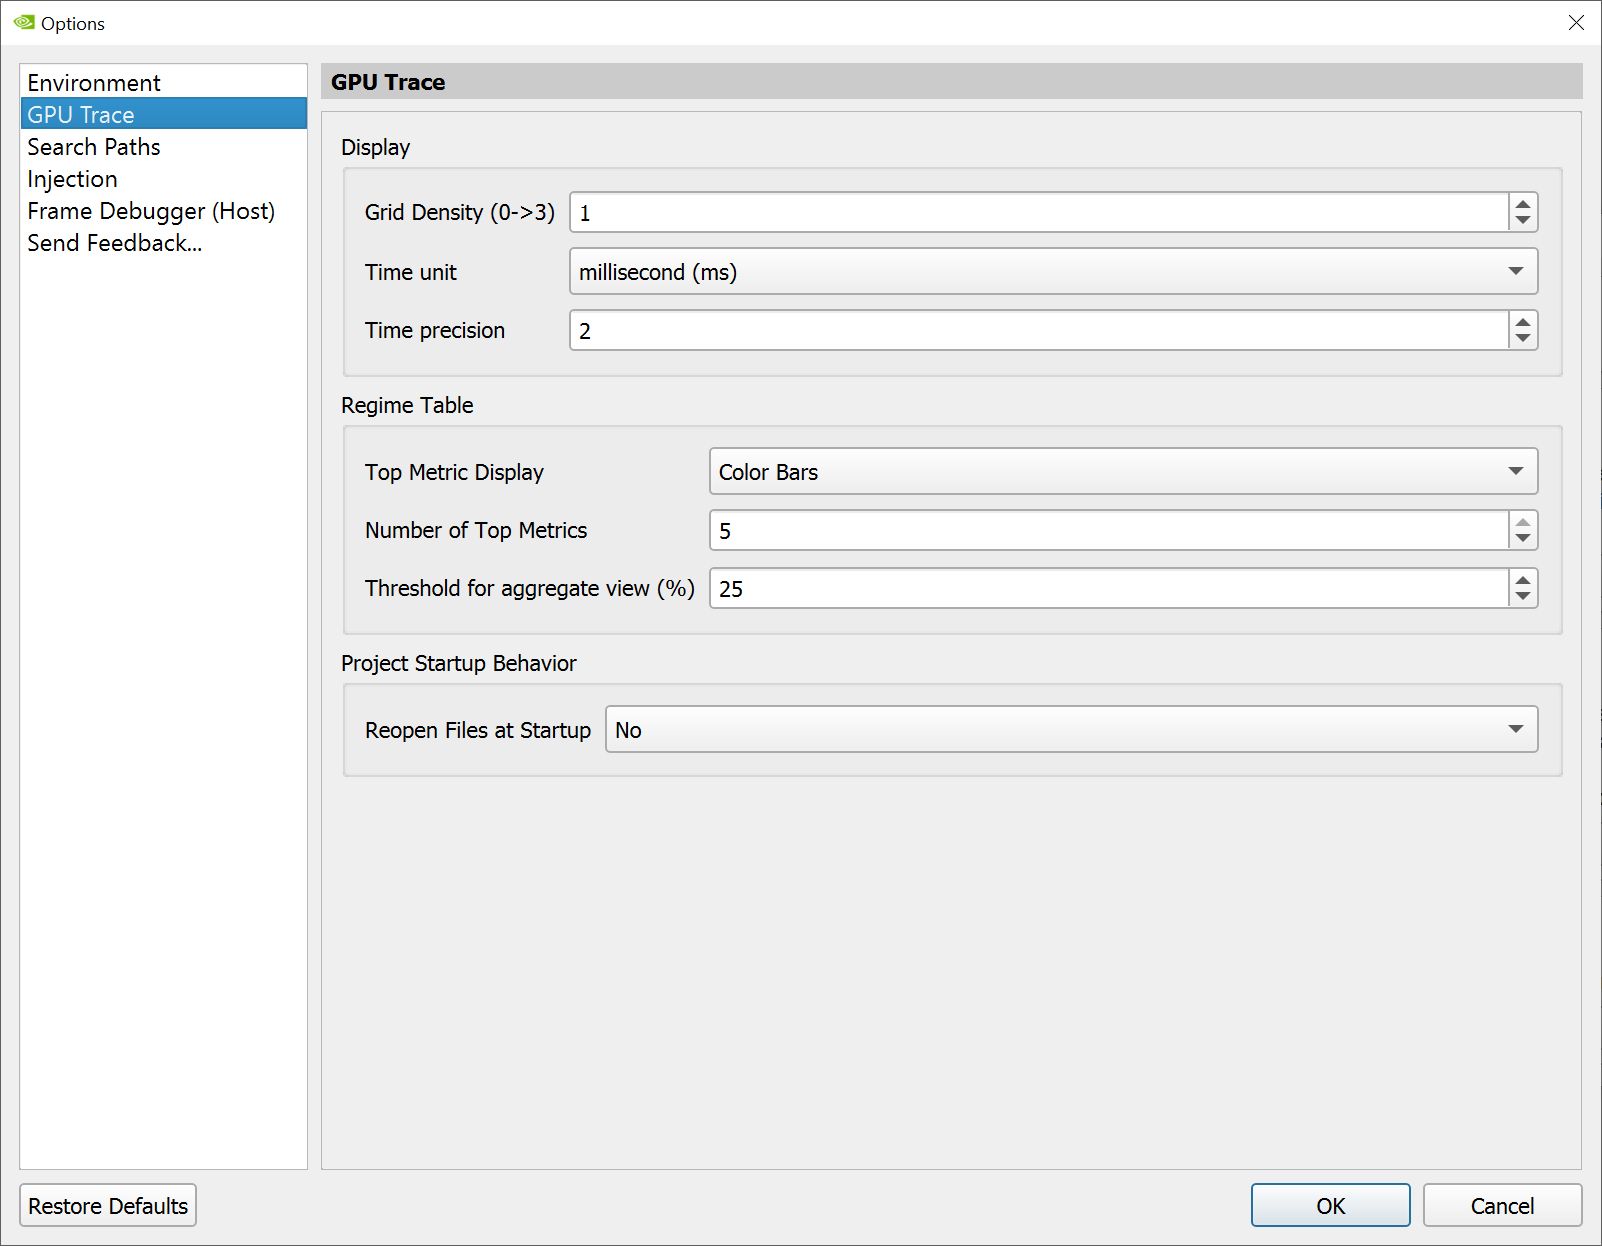
Search Paths
On the Search Paths tab, you can configure search path settings for shader and application debug files used by the NVIDIA Nsight Aftermath GPU Crash Dump Inspector, NVIDIA Nsight Graphics FrameDebugger, and other tools.
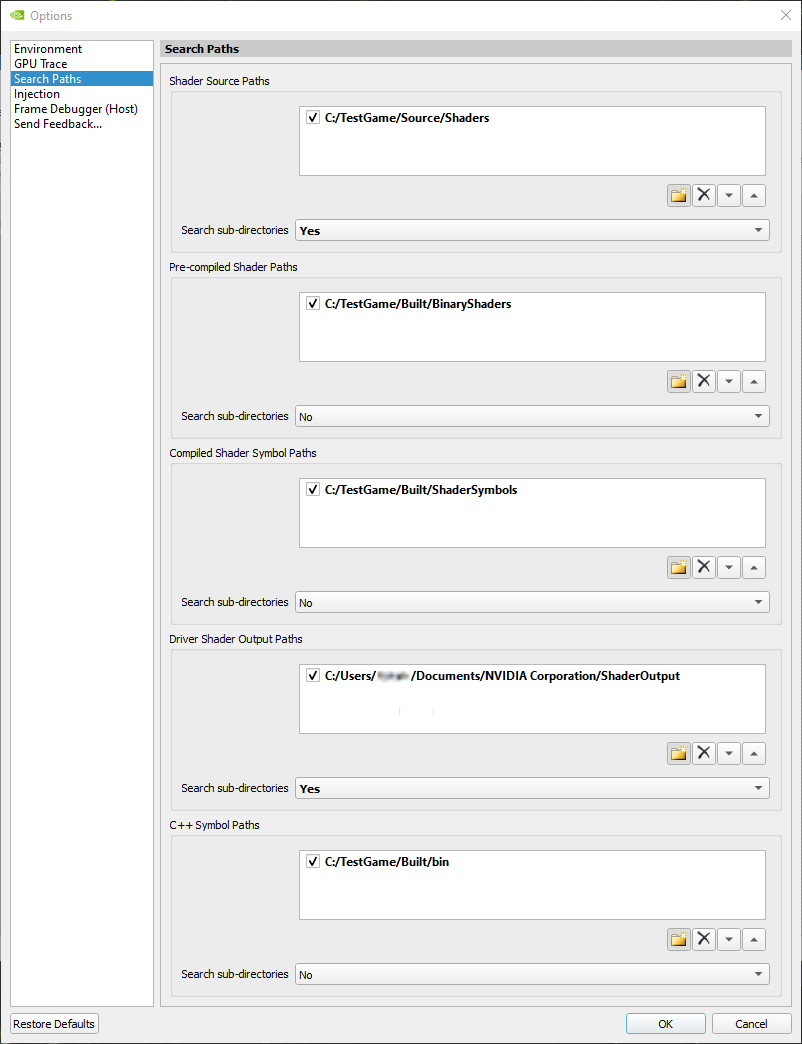
-
Shader Source Paths specifies a list of directories where shader source files can be found. This option is used to associate the high-level shader (HLSL, GLSL, etc.) source files that are used in your application to the file names that are embedded in shader objects by your shader compiler.
-
Pre-compiled Shader Paths specifies a list of directories where pre-compiled binary shader objects (DXIL objects, SPIR-V binaries, etc.) can be found.
-
Compiled Shader Symbol Paths specifies a list of directories where shader debug information files separate from the shader object can be found. These are the shader debug information files that may have been produced by your compiler toolchain when compiling the shader objects (.lld or .pdb files generated by dxc.exe for instance).
-
Driver Shader Output Paths specifies a list of directories where NVIDIA shader debug information files can be found. These are the shader debug information files generated by the Nsight Aftermath GPU Crash Dump Monitor (.nvdbg files) or the files created based on the data provided by the shader debug info callback for applications that are instrumented with the GPU crash dump collection feature of the Nsight Aftermath SDK. For more details see the Nsight Aftermath SDK documentation.
-
C++ Symbol Paths specifies a list of directories where symbols for the application that is analyzed and the dynamic libraries it has loaded can be found. This is necessary to resolve application call stacks in several views.
-
For all of the above paths, it is possible to recursively search the configured directories by enabling the Search sub-directories option that is associated with each.
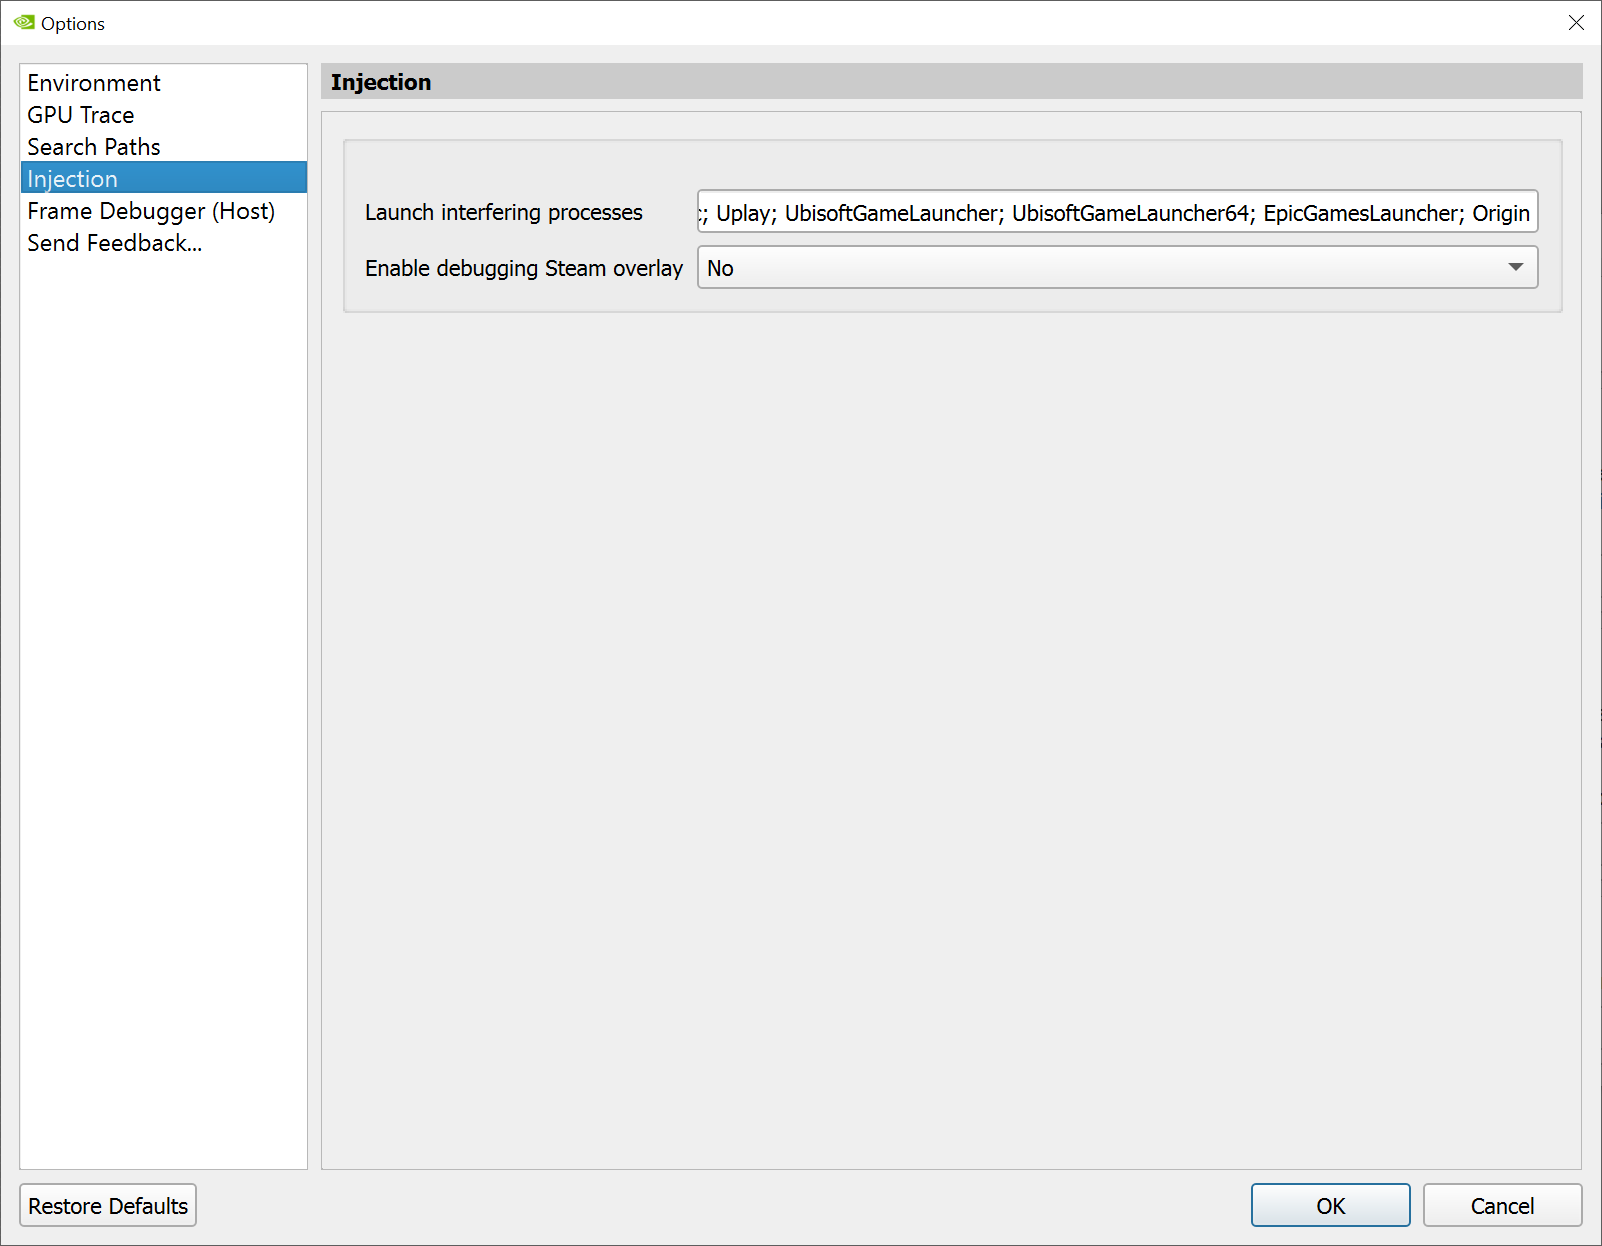
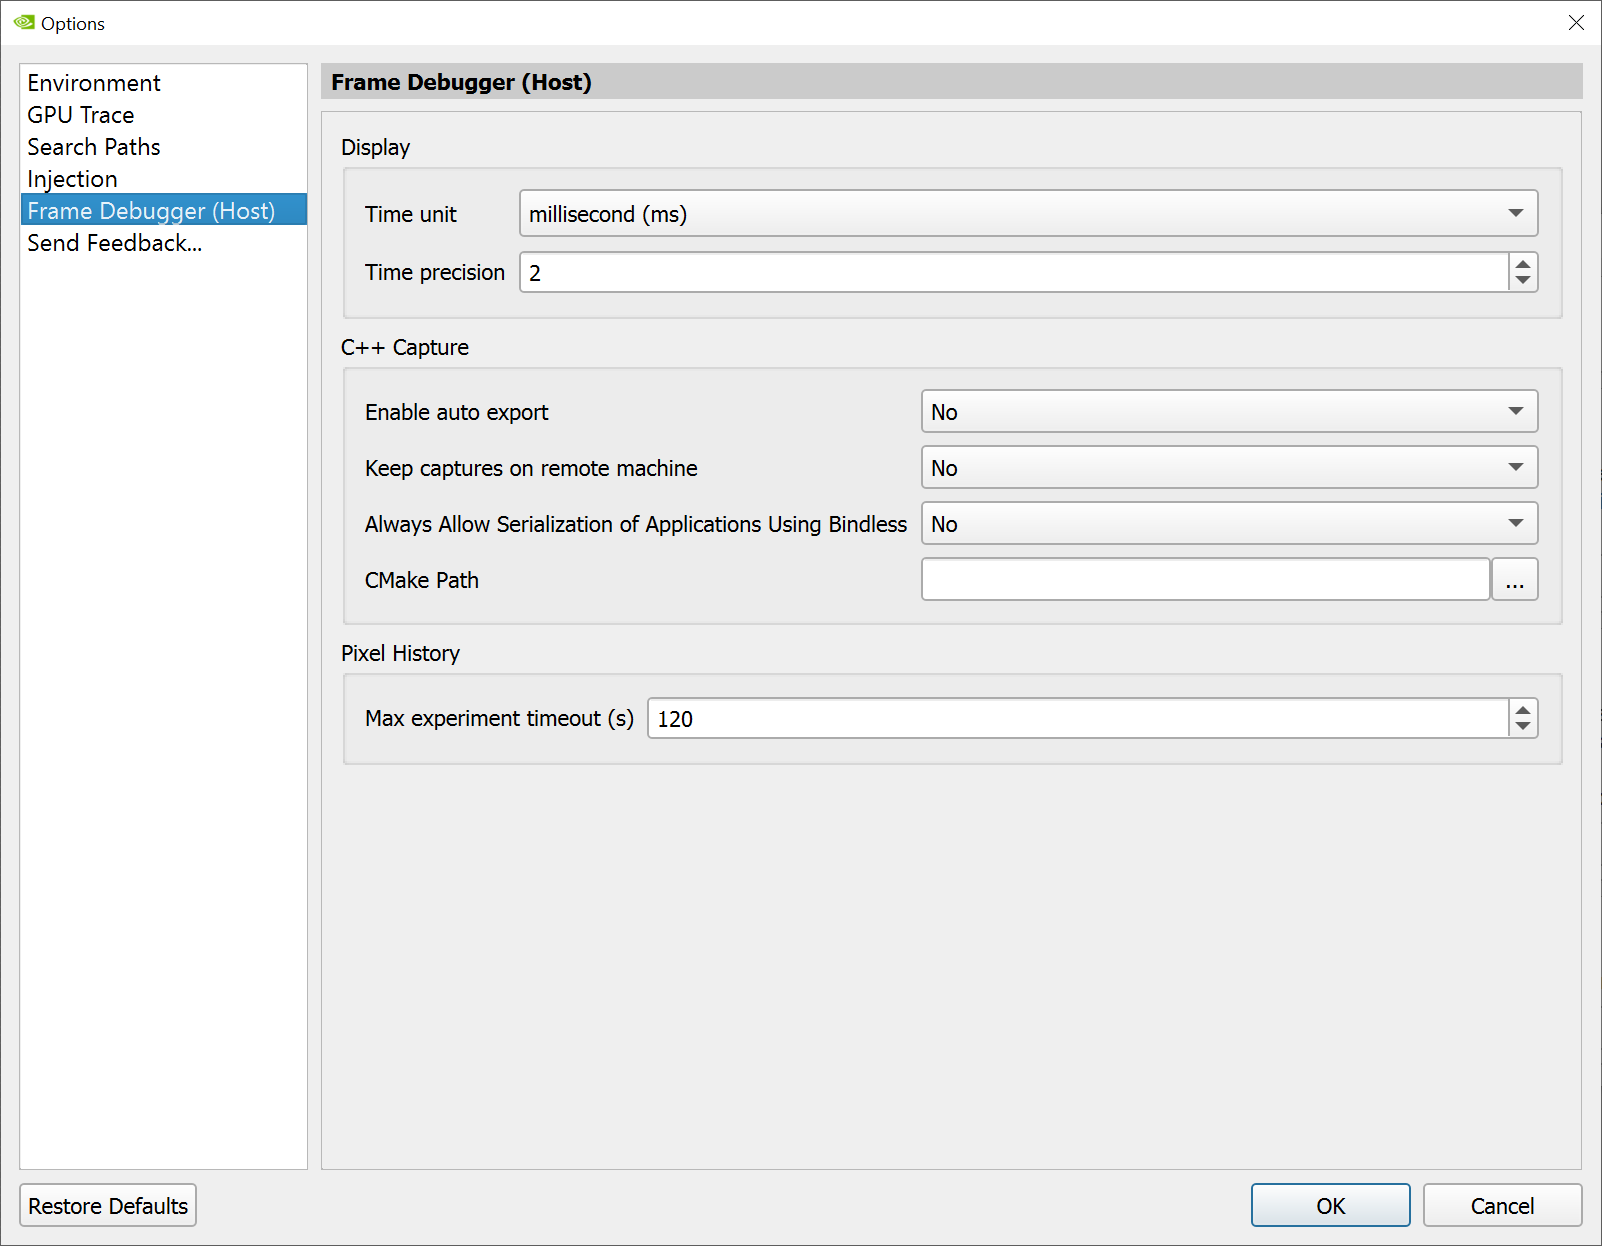
Common View Capabilities
Nsight Graphics supports docking multiple windows within the main window. Any window may be moved, adjusted, tabbed, or pulled out from the docking system that it provides. Most default layouts have multiple documents already specified, but if you wish to adjust these documents you can do so at any time.
Beyond positioning, when frame debugging or profiling, there are buttons that are common across several frame debugger views.
- The Clone button makes a copy of the current view, so that you can compare different parts of the API Inspector (or other cloned views) for the current action.
- The Lock button freezes the current view so that changing the current event does not update this view. This is helpful when trying to compare the same state on two different actions.
Window Layouts
Nsight Graphics has an intuitive window management and docking system. Windows may be dragged and docked in your preferred locations.
Floating Windows
Windows may be dragged out of the main Nsight Graphics window so that they can be independently managed. Other windows can then dock onto that floating window. On operating systems that support it, such as Microsoft Windows, windows may also be managed from the taskbar.
User Named Layouts
Nsight Graphics allows users to customize the size and position of the views to create a layout that is targeted to the task at hand. For example, if you are focused on debugging a problem with API usage, you can put the Events View and API Inspector next to each other as you work your way through the frame, inspecting the API state at different points in the frame. The view locations are automatically saved when you exit the frame replay and restored when capture a new frame.
However, different problem types may require unique layouts. To facilitate a smooth transition from one layout to another, you can save and restore activity-centric view arrangements via user named layouts.
You can access this save/load capability from the Window pull down in the main menu. The section pertaining to layouts includes entries to "Save Window Layout...", "Restore Window Layout", "Manage Window Layouts...", and restore the "Default Window Layout".
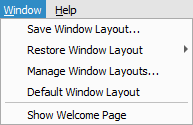
"Save Window Layout..." will bring up a dialog that allows you to specify a name for the current layout. The layouts are saved to a Layouts folder in the documents directory as named ".nvlayout" files and can be shared with colleagues.
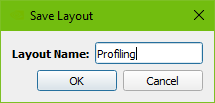
Once you have saved a layout (or two), you can restore them by using the "Restore Window Layout" menu entry. When you mouse to it, a sub-menu will pop out with all of your saved layouts. Simply select the entry you want and the views will be restored to their original locations.
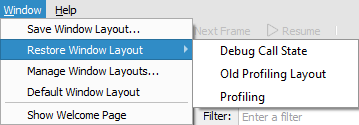
There may come a time when you want to clean up some unused layouts. When you select the "Manage Window Layouts" entry, a dialog will come up that allows you to delete or rename old layouts, etc.
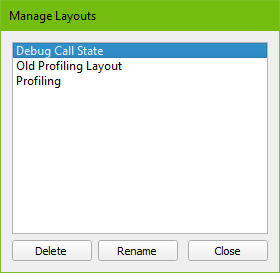
Finally, the "Reset Window Layout" entry in this section allows you to restore the layout to the default one for the current activity.
Window Chooser
Nsight Graphics has a window chooser for fast enumeration and selection of opened documents and windows . To open this dialog, select Windows > Windows...
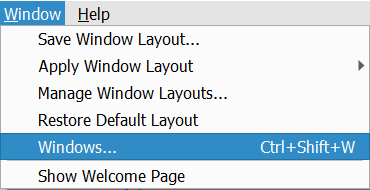
Once activated, a window chooser is brought up that contains all of the opened documents and windows.
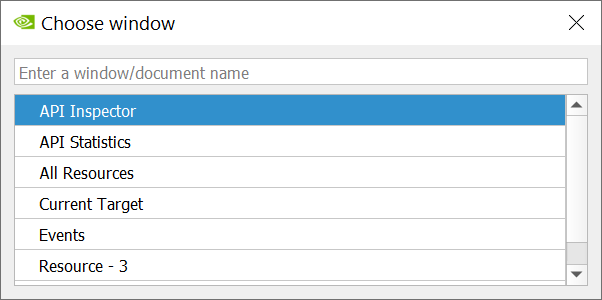
Navigate with the mouse or keyboard to select an entry and press enter to activate the selected window or document. Alternatively you may double click an entry to activate it.
You may also enter filter expressions to filter to the window of interest.
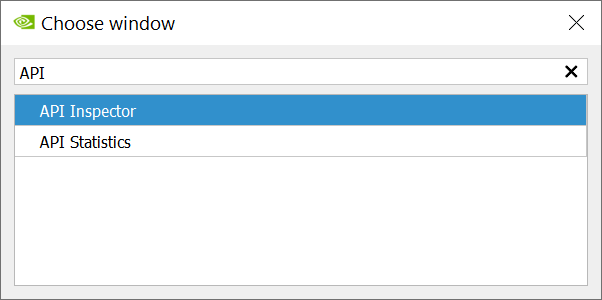
Troubleshooting
Due to the complex nature of the underlying mechanisms that make arbitrary application analysis possible, there is the possibility of errors. Nsight Graphics offers a significant number of ways where you can discover opportunities to correct issues that you may encounter.
See the sections below for general tools as well as listings of common problems and possible solutions for them. Also, you may want to review known issues to determine if you are encountering an issue already known.
General Tools
This section provides troubleshooting tips for Nsight Graphics.
Output Messages
Throughout the operation of the tool, Nsight Graphics provides messages that inform on the status of operations as well as if any issues are encountered. This could provide some assistance when trying to determine why your application may not run, connect, or capture correctly. Error messages are indicated by a red flag in the bottom right of the application window. This flag may be double-clicked to open the Output Messages window. Alternatively this window may be accessed via Tools > Output Messages.
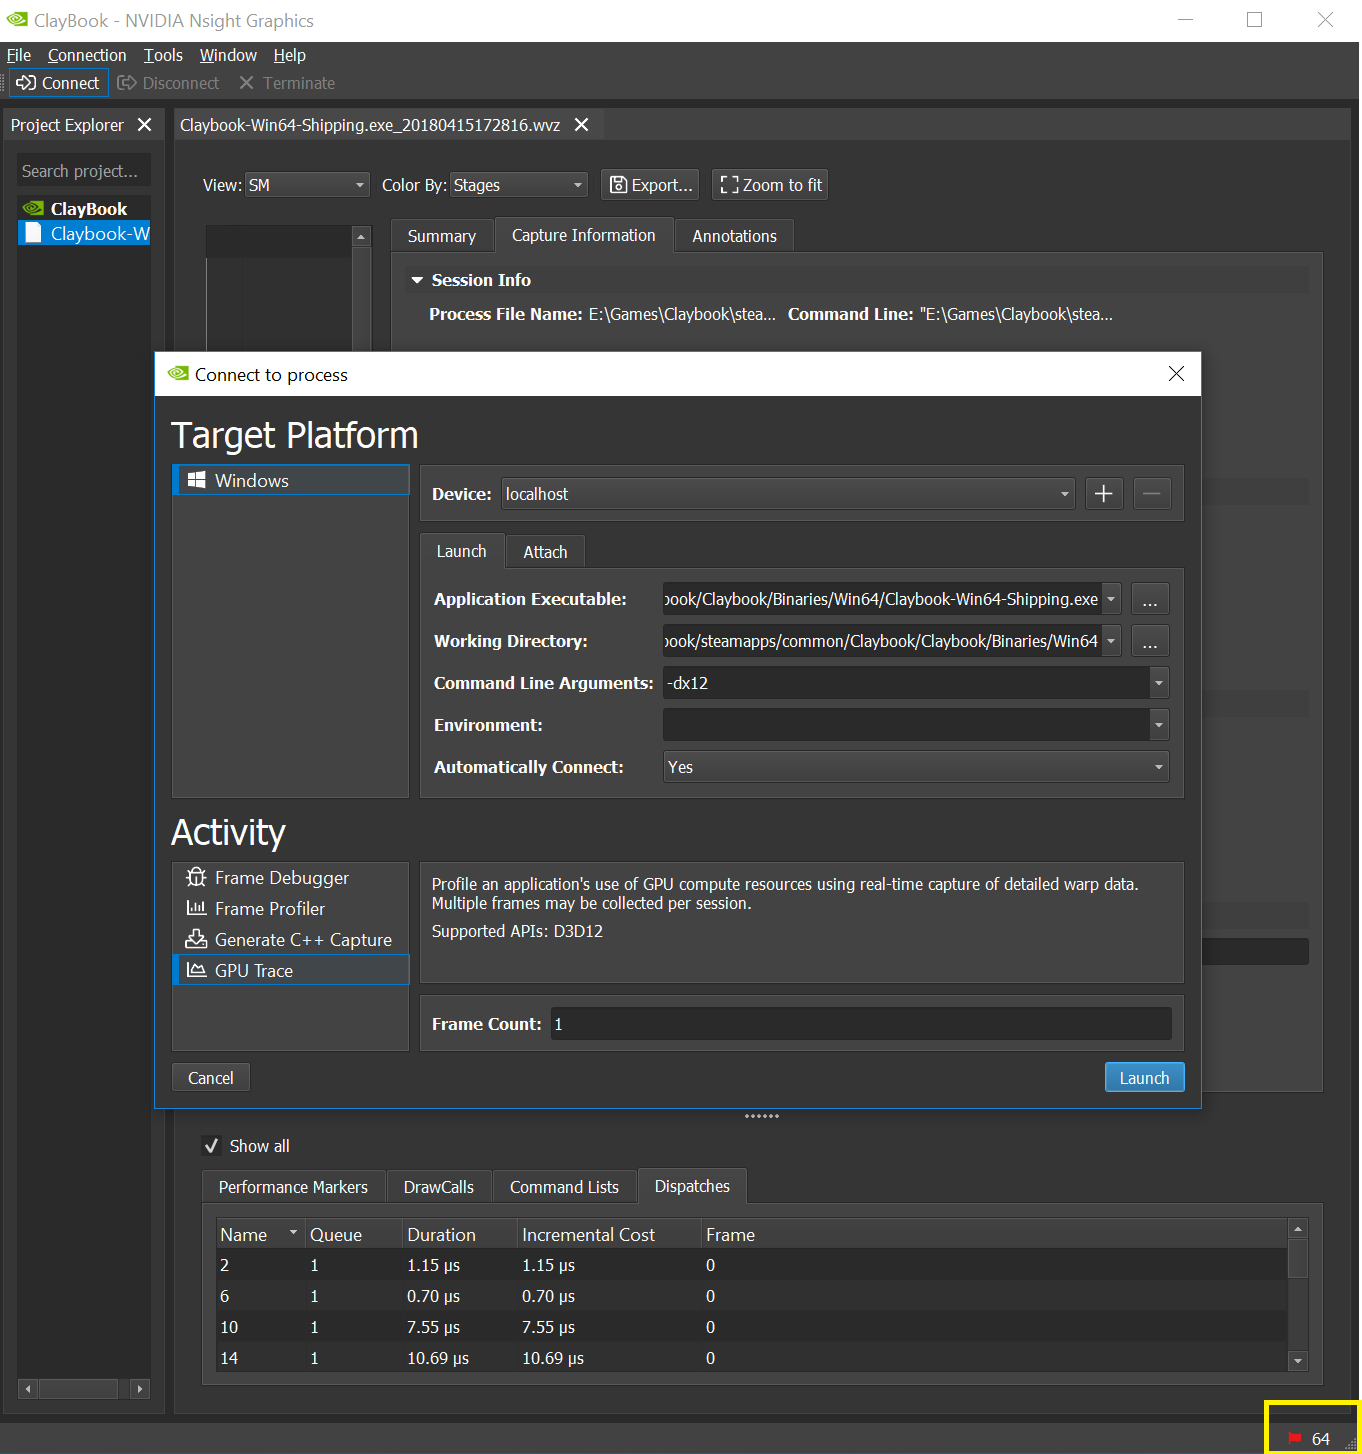
Crash Reporting
When an application crashes, or hangs, a crash report can be one of the most valuable pieces of information in helping to fix the issue. Accordingly, if you have the ability to send a crash report, it would be greatly appreciated.
Automatic Crash Reports
Nsight Graphics's (host and target) are configured to automatically send crash reports when they encounter a crash. Submitting via the dialog is a good approach, but saving the minidump for explicit communication can be useful too.
Manual Crash Reports
Manual crash reports are an effective approach to collecting information in case you are finding that automatic crash reports are not triggering. A process dump be collected by attaching to the crashing process with a debugger and manually creating a dump in the case of a crash.
Windows
A crash dump can be created by Microsoft Visual Studio. To accomplish this:
-
Start Visual Studio.
-
Follow the instructions for Debugging Your Application with a Debugger.
-
Start the application with Nsight Graphics.
-
Attach the Visual Studio debugger to it with "Debug > Attach To Process"
-
When you encounter a crash, use the Visual Studio "Debug > Save Dump As" menu option.
Linux
A crash dump can be created by GDB, the GNU Debugger. To accomplish this:
-
Start gdb.
-
Follow the instructions for Debugging Your Application with a Debugger.
-
Start the application with Nsight Graphics.
-
Attach gdb to it.
-
When you encounter a crash, use the "generate-core-file" command.
- Next, while the process is still alive, use the core2md utility to translate the
core file into a dump that can be consued by running: core2md <core dump>
/proc/<crash process ID>/ <minidump>
- The core2md utility can be found in the Nsight Graphics installation directory under host/linux-desktop-nomad-x64.
Manual Hang Reports
If the application encounters a hang, a process dump can be one of the most effective ways to identify the source of the hang. A process dump be collected by attaching to the crashing process with a debugger and manually creating a dump by following the instructions below:
Windows
A crash dump can be created by Microsoft Visual Studio. To accomplish this:
-
Start Visual Studio.
-
Attach the Visual Studio debugger to the hanging process with "Debug > Attach to Process"
-
Stop program execution by using the Visual Studio "Debug > Break All" command.
-
Generate a process dump using the Visual Studio "Debug > Save Dump As" command.
Linux
A crash dump can be created by GDB, the GNU Debugger. To accomplish this:
-
Start gdb.
-
Attach gdb to your process.
-
The process should been stopped after being attached by GDB, otherwise press Ctrl + C to send a SIGINT to stop the process.
-
Generate a process dump using the "generate-core-file" command.
- Next, while the process is still alive, use the core2md utility to translate the
core file into a dump that can be consued by running: core2md <core dump>
/proc/<hang process ID>/ <minidump>
- The core2md utility can be found in the Nsight Graphics installation directory under host/linux-desktop-nomad-x64.
Debugging Your Application with a Debugger
Although launching your application with Nsight Graphics might appear to be an alternative to CPU debugging, the application that is launched is still very much a debuggable application. This can be useful to determine if a problem you are encountering is in your own code by tracing the paths taken by your application.
To do this, set an environment variable of NVIDIA_PROCESS_INJECTION_ATTACH_DIALOG=1 and attach a debugger when you see a message box. Click OK to resume your application once you have set breakpoints that will allow you to inspect if your application is following the expected paths.
Collecting DirectX Debug Logging
Sometimes a device lost or other issue can be narrowed by observing what the DirectX debug layer has to say.
If you need to install the layer it should be part of the OS in Windows 10:
Apps & Features > Manage Optional Features > Graphics Tools
Open dxcpl, which should look like the below. Make sure your installed application is in the Scope List, and set the Direct3D/DXGI Debug Layer to Force On.
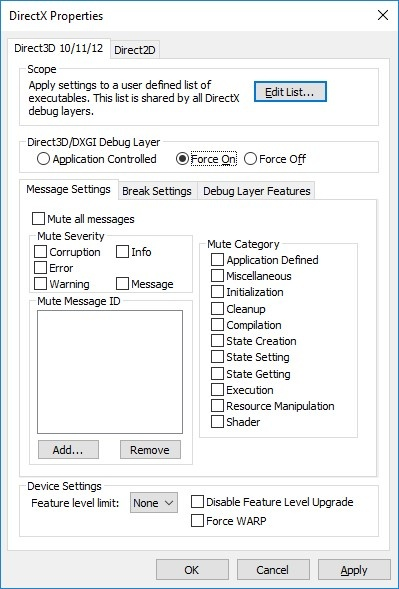
There are two ways to see the spew:
-
You can see logging without attaching Visual Studio by just running DbgView.exe. https://docs.microsoft.com/en-us/sysinternals/downloads/debugview.
-
Alternately, attach using Visual Studio. Logging will be in the Visual Studio Output window.
Common Problems
Problem: Application Fails to Launch
You've tried to launch your application, but it is failing to launch.
Possible Causes
-
Incorrect command line arguments.
-
Incorrect working directory.
-
You're trying to launch on a remote machine that does not have the Nsight Monitor running.
Possible Solutions
Make sure that your command line arguments and working directory are as expected.
If you are trying to run on a remote machine, please ensure that the remote monitor is running and that the name of the machine is correct. See Remote Launching.
Disambiguate if the application is launching at all. Follow the instructions in Debugging Your Application with a Debugger. Check to see if your application is launched at all and if so, whether it is following its expected path. If the application doesn't launch at all, please send an email to devtools-support@nvidia.com .
Problem: Application Crashes at Runtime
You've found that your application appears to launch, but it crashes during runtime.
Possible Causes
-
Lack of API support by Nsight
-
Application not checking return codes from device/object creation, assuming it has succeeded
-
Interception-library crash
-
Internal-driver crash
-
D3D-debug runtime interaction
Possible Solutions
Try disabling the following features:
For D3D apps, try running without the D3D debug runtime enabled, as the debug runtime occasionally differs in behavior when compared with the release runtime.
If none of the above works, please try to collect a crash dump if possible and send it to devtools-support@nvidia.com .
Problem: Application Hangs at Runtime
You've found that your application appears to launch, but it hangs during runtime.
Possible Solutions
Try disabling the following features:
If none of the above works, please try to collect a process dump if possible and send it to devtools-support@nvidia.com .
Problem: Application Crashes during Capture
You've found that you're able to run the application successfully, but upon trying to perform a live analysis, the application crashes.
Possible Causes
-
Multi-threading issue
-
Out of memory
-
The application is tearing itself down due to a watchdog timeout
Possible Solutions
Try disabling the following features:
If you suspect a multi-threading issue (D3D's runtime sometimes indicates this), try disabling multi-threaded capture.
If Nsight Graphics reports out of memory, trying reducing the requirements of the application or try running with a more capable GPU.
If the application exits without any clear sign of a crash, the application could be tearing itself down. Please contact devtools-support@nvidia.com with your concern and we will investigate if there is any opportunity for deactivating the thread.
Problem: Application Hangs during Capture
You've found that you're able to run the application successfully, but upon trying to perform a live analysis, the application hangs. This hang sometimes appears as a white screen on the target application.
Possible Causes
- The application is lazily presenting frames, preventing progress
-
Multi-threading issue
-
App is running in fullscreen mode
Possible Solutions
If the application is lazily presenting frames, it may prevent capture progress given that Nsight performs work on frame boundaries. If this is the case, try turning on the Force Repaint feature so as to force the application to present frames.
If you suspect a multi-threading issue, try changing the following feature to RenderOnly:
If none of the above works, please try to collect a process dump if possible and send it to devtools-support@nvidia.com .
Problem: Application Encounters an Incompatibility
This problem arises when the application you are running is using API methods or patterns that are not supported by Nsight
Possible Solutions
When encountering this issue, Nsight will present a list of API methods or reasons that it has encountered as incompatible. This listing is listed alongside an explanation of the reasons why Nsight has prevented capture, which include application crashes, incorrect data, etc. Because Nsight is a replay based debugger, the absence of methods may lead to critical issues as replay is attempted. In some cases, however, the missing methods are innocuous and replay may proceed correctly without them. When capturing through the host, Nsight will offer the user an opportunity to capture despite these incompatibilities. From this point, it is up to the user to determine if the data is meaningful.
When encountering an incompatibility, we recommend that you communicate this incompatibility to devtools-support@nvidia.com so that the Nsight development team may track this issue and determine if it is something that will be supported in the future.
Note that if you wish to ignore all incompatibilities on every run, and wish to accept the possible errors that come with it, you may set the option of 'Troubleshooting > Ignore Incompatibilities' to accomplish that.
Problem: Application Captures Successfully, but Exits after a Time in Capture
This problem indicates that you have had some level of success, but even if the application generally inactive, the application crashes.
Possible Solutions
When encountering this issue, take note of what you are doing when you encounter if. The first thing to try is doing nothing – does the application still crash when doing so? If there is nothing going on, this is either a memory leak or a watchdog timer.
-
Look at the memory usage of the process – is it growing? It's a memory leak, either from the application or the tool.
-
Set a stopwatch to count how long it takes to crash – is it a "round" number like 30 or 60 seconds? It's probably a watchdog.
-
If this is a memory leak (uncommon but possible) please contact support to help identify the issue.
If this is a watchdog issue, disable the watchdog in your application.
Problem: Application Runs Extremely Slowly
You've observed that the application runs at a significantly lower rate than normal operation.
Possible Solutions
Try disabling optional features, such as collecting shader sourcecollecting native shaders, or collecting hardware performance metrics.
Problem: D3D12 Replayer Shows More CPU Overhead than Expected
If you encounter more overhead in your range profiling session or generated C++ capture, conservative synchronization may be the problem.
Problem: I Can't Capture a Vulkan Application
If you find that the button to Capture for Live Analysis is disabled, or you do not see a message that your application has Nsight analysis enabled, the Nsight Vulkan layer may not be enabled. This symptom is often accompanied by an error in the Output Messages window, so look for errors in that window for an indication of the failure.
Possible Solutions
One workaround is to re-enable the Nsight Vulkan layer explicitly. To do this, run the following command for your system:
Windows
<install directory>/host/windows-desktop-nomad-x64/VK_LAYER_NV_nomad.bat
Linux
<install directory>/host/linux-desktop-nomad-x64/VK_LAYER_NV_nomad.sh
If, after repeating this installation, you find that your system still cannot capture, gather a log of the output of the vulkaninfo application from the Vulkan SDK and send it to devtools-support@nvidia.com.
Problem: I Can't Attach to the Application
The application launches, but you are unable to attach to it with the Nsight Graphics host.
Possible Causes
- You launched a piece of the process hierarchy without Nsight Graphics.
- You set the connection to automatically attach when the root application launches child processes that are the actual processes of interest.
- The application is interfering with the interception of Nsight Graphics, preventing it from intercepting.
- The application is using a software renderer.
Possible Solutions
Nsight Graphics is essentially an in-process debugger, so it cannot attach to an application that wasn’t originally launched through Nsight Graphics. The attach feature is meant to be used to attach to applications that have been launched through other means (e.g., a command line launcher), as well as to allow for some recoverability in the case of a host issue, as it allows you attach at a later time.
Make sure to kill any processes related to the process hierarchy of an application and try to launch it again.
Problem: The Host UI Crashes
The host UI crashes while you are analyzing an application.
Possible Solutions
Try reducing the number of views that you have open when running to pinpoint which view causes the issue.
If at all possible, try to collect a crash dump of the UI application and send it to devtools-support@nvidia.com.
Try deleting the UI persistence data with Help > Reset Application Data .
Problem: The Target Window Blocks the Host Window
While running a live analysis, you find that the target window is blocking the host window and interfering with the analysis you wish to perform on the host. This is most often reported on machines that do not have access to multiple monitors.
Possible Causes
- The application has fullscreen settings
- The application has a topmost flag set to keep the application on top
Possible Solutions
We suggest running without fullscreen or topmost settings. If fullscreen-like behavior is desired, many applications support a borderless window mode.
If you must analyze an application with these characteristics, and you do not have access to a second monitor, the virtual desktop or workspaces support on most modern operating system shells presents an effective path forward. Creating one desktop for the target application and one for the host often avoids the target from interfering. For more information on using these features, see one of the articles below.
NOTE: If you wish to suppress the dialog that reports replay window interference, set an environment variable of NSIGHT_REPORT_REPLAY_WINDOW_INTERFERENCE=0 .
Linux/Gnome: https://help.gnome.org/users/gnome-help/stable/shell-workspaces.html.en
Problem: Acceleration Structure Integrity Check Failed
Applications that make use of ray tracing use acceleration structures to define their application geometry. This acceleration structure geometry must be tracked by the tool in order to inform capabilities like replay and geometry visualization. When tracking geometry, there are tradeoffs between performance, accuracy, and robustness of any given approach.
If you are using a tracking mode of Shallow Geometry Reference with Integrity Check, you may encounter integrity check warnings. This implementation tries to match a common application behavior with high performance, while still providing some error checking. This may not be sufficient for all applications, however. For example, after building an acceleration structure, it is legal for an application to update or destroy the geometry buffers that were used in construction. In this situation, without deep copies of the original data, the tool cannot guarantee full function of the acceleration structure viewer, or of C++ capture. To attempt to detect erroneous patterns, Nsight Graphics™ will run an integrity check on the tracked data. If the data is suspicious, the tool will warn the developer to let them know about their opportunity to change it.
Possible Solutions
If you have application access, you may also try to adjust your code to avoid updating or destroying buffers, instead allowing them to match the lifetime of the acceleration structure you built. Another possible option is to make acceleration structure build periodic, and implement a code path to freeze the periodic build when a capture is desired.
If you do not have application access, you may use a Deep Geometry Copy option to avoid a shallow reference to the original data, instead copying it as needed. This additional copy will in fact increase the memory usage of the application, which can negatively impact tightly memory-constrained applications. Note that this will also lead to lower runtime performance when running the application before the capture, although this will not impact later profiling or debugging performance when the live analysis is being run.
Problem: Force-failed QueryInterface is Reported
It is possible that applications will attempt to QueryInterface for types that Nsight does not know about or understand. To avoid crashes, incorrect rendering, or bad data with these unknown types, Nsight will report a force-failed QueryInterface warning. After reporting this warning, Nsight will nullify the result of this QueryInterface call and return E_NOINTERFACE to report that this interface is unsupported.
Possible Solutions
When this issue is encountered, it is recommended that you first attempt to understand what the source of the incompatibility is. Nsight will attempt to print out the source and target types in the QueryInterface call. When the target is unknown, however, this type will be printed out as a GUID.
In some cases, the failure may be apparent, and you might be able to do a text search to determine where your application is making this problematic QueryInterface call. If that is too difficult to find, you may also try Debugging Your Application with a Debugger and setting a function breakpoint on MessageBoxA before running the application, which will report the call stack in which Nsight performs the report.
If you are unable to workaround this type support, you may attempt to set an environment variable to suppress this force-failed query. Note that this is not guaranteed to fix all concerns, and may result in future unspecified failures, but it is available as a possibility for working around problems. The environment variable of NSIGHT_PASSTHROUGH_UNKNOWN_GUIDS is a comma-delimited list of GUIDs to allow to passthrough without a force-failure. GUIDs must be fully specified with a brace syntax, as in NSIGHT_PASSTHROUGH_UNKNOWN_GUIDS={5b746c30-24e2-4385-81f6-39f7a068945b}.
If you suspect that the type being reported should be supported by Nsight, please send a report to devtools-support@nvidia.com to ask for assistance.
Appendix
Feature Support Matrix
| Feature | D3D11 | D3D12 | OpenGL | Vulkan |
|---|---|---|---|---|
|
Frame Capture and Live Analysis |
Yes |
Yes |
Yes |
Yes |
|
Range Profiling and Performance Counters |
Yes |
Yes |
Yes |
|
|
Real-time Performance Signals |
Yes |
Yes |
Yes |
|
|
Real-time Performance Experiments |
Yes |
Yes |
Yes |
|
|
C++ Capture |
Yes |
Yes |
Yes |
Yes |
|
Shader Performance Analysis |
Yes |
Yes |
Yes |
Yes |
|
Pixel History |
Yes |
Yes |
Yes |
Yes |
|
Dynamic Shader Editing |
Yes |
Yes |
Yes |
|
|
GPU Trace |
Yes |
|||
|
Ray Tracing Debugging |
Yes |
Yes |
||
|
Nsight Aftermath GPU Crash Dumps |
Yes |
Supported OpenGL Functions
Nsight Graphics's Frame Debugger supports the set of OpenGL operations, which are defined by the OpenGL 4.5 core profile. Note that it is not necessary to create a core profile context to make use of the frame debugger. An application that uses a compatibility profile context, but restricts itself to using the OpenGL 4.5 core subset, will also work. A few OpenGL 4.5 compatibility profile features, such as support for alpha testing and a default vertex array object, are also supported.
The Frame Debugger supports three classes of OpenGL extensions, described below.
1. OpenGL Core Context Support
The OpenGL extensions listed below are supported in as much as the extension has been adopted by the OpenGL 4.5 core profile. For example, EXT_subtexture is included as part of OpenGL 1.1. Calls to glTexSubImage2DEXT are supported and behave the same as calls to glTexSubImage2D. On the other hand, while EXT_vertex_array is also included as part of OpenGL 1.1, glColorPointerEXT is not supported by the Frame Debugger. The operation of glColorPointerEXT was modified when it was included as part of OpenGL 1.1. Additionally, glColorPointer is part of the compatibility subset, but not the core subset.
// GL 1.1
EXT_vertex_array
EXT_polygon_offset
EXT_blend_logic_op
EXT_texture
EXT_copy_texture
EXT_subtexture
EXT_texture_object
// GL 1.2
EXT_texture3D
EXT_bgra
EXT_packed_pixels
EXT_rescale_normal
EXT_separate_specular_color
SGIS_texture_edge_clamp
SGIS_texture_lod
EXT_draw_range_elements
EXT_color_table
EXT_color_subtable
EXT_convolutionHP_convolution_border_modes
SGI_color_matrix
EXT_histogram
EXT_blend_color
EXT_blend_minmax
EXT_blend_subtract
// GL 1.2.1
EXT_SGIS_multitexture
// GL 1.3
ARB_texture_compression
ARB_texture_cube_map
ARB_multisample
ARB_multitexture
ARB_texture_env_add
ARB_texture_env_combine
ARB_texture_env_dot3
ARB_texture_border_clamp
ARB_transpose_matrix
// GL 1.4
SGIS_generate_mipmap
NV_blend_square
ARB_depth_texture
ARB_shadow
EXT_fog_coord
EXT_multi_draw_arrays
ARB_point_arameters
EXT_secondary_color
EXT_blend_func_separate
EXT_stencil_wrap
EXT_texture_env_crossbar
EXT_texture_lod_bias
ARB_texture_mirrored_repeat
ARB_window_pos
// GL 1.5
ARB_vertex_buffer_object
ARB_occlusion_query
EXT_shadow_funcs
// GL 2.0
ARB_shader_objects
ARB_vertex_shader
ARB_fragment_shader
ARB_draw_buffers
ARB_texture_non_power_of_two
ARB_point_sprite
EXT_blend_equation_separate
ATI_separate_stencil
EXT_stencil_two_side
// GL 2.1
ARB_pixel_buffer_object
EXT_direct_state_access
EXT_texture_sRGB
// GL 3.0
EXT_gpu_shader4
NV_conditional_render
APPLE_flush_buffer_range
ARB_color_buffer_float
NV_depth_buffer_float
ARB_texture_float
EXT_packed_float
EXT_texture_shared_exponent
EXT_framebuffer_object
NV_half_float
ARB_half_float_pixel
EXT_framebuffer_multisample
EXT_framebuffer_blit
EXT_texture_integer
EXT_texture_array
EXT_packed_depth_stencil
EXT_draw_buffers2
EXT_texture_compression_rgtc
EXT_transform_feedback
APPLE_vertex_array_object
EXT_framebuffer_sRGB
// GL 3.1
EXT_draw_instanced
ARB_draw_instanced
ARB_copy_buffer
NV_primitive_restart
ARB_texture_buffer_object
ARB_texture_rectangle
ARB_uniform_buffer_object
// GL 3.2
ARB_vertex_array_bgra
ARB_draw_elements_base_vertex
ARB_fragment_coord_conventions
ARB_provoking_vertex
ARB_seamless_cube_map
ARB_texture_multisample
ARB_depth_clamp
ARB_geometry_shader_4
ARB_sync
// GL 3.3
ARB_shader_bit_encoding
ARB_blend_func_extended
ARB_explicit_attrib_location
ARB_occlusion_query2
ARB_sampler_objects
ARB_texture_rgb10_a2ui
ARB_texture_swizzle
ARB_timer_query
ARB_instanced_arrays
ARB_vertex_type_2_10_10_10_rev
// GL 4.0
ARB_texture_query_lod
ARB_draw_buffers_blend
ARB_draw_indirect
ARB_gpu_shader5
ARB_gpu_shader_fp64
ARB_sample_shading
ARB_shader_subroutine
ARB_tessellation_shader
ARB_texture_buffer_object_rgb32
ARB_texture_cube_map_array
ARB_texture_gather
ARB_transform_feedback2
ARB_transform_feedback3
// GL 4.1
ARB_ES2_compatibility
ARB_get_program_binary
ARB_separate_shader_objects
ARB_shader_precision
ARB_vertex_attrib_64bit
ARB_viewport_array
// GL 4.2
ARB_texture_compression_bptc
ARB_compressed_texture_pixel_storage
ARB_shader_atomic_counters
ARB_texture_storage
ARB_transform_feedback_instanced
ARB_base_instance
ARB_shader_image_load_store
ARB_conservative_depth
ARB_shading_language_420pack
ARB_internalformat_query
ARB_map_buffer_alignment
// GL 4.3
ARB_multi_draw_indirect
ARB_program_interface_query
ARB_shader_storage_buffer_object
ARB_copy_image
ARB_vertex_attrib_binding
ARB_texture_view
ARB_invalidate_subdata
ARB_framebuffer_no_attachments
ARB_stencil_texturing
ARB_explicit_uniform_location
ARB_texture_storage_multisample
ARB_program_interface_query
ARB_robust_buffer_access_behavior
ARB_ES3_compatibility
ARB_clear_buffer_object
ARB_internal_format_query2
ARB_texture_buffer_range
ARB_compute_shader
ARB_debug_group
ARB_debug_label
ARB_debug_output
// GL 4.4
ARB_query_buffer_object
ARB_enhanced_layouts
ARB_multi_bind
ARB_vertex_type_10f_11f_11f_rev
ARB_texture_mirror_clamp_to_edge
ARB_clear_texture
// GL 4.5
ARB_clip_control
ARB_cull_distance
ARB_conditional_render_inverted
GL_KHR_context_flush_control
ARB_get_texture_sub_image
GL_KHR_robustness
ARB_texture_barrier
ARB_ES3_1_compatibility
ARB_direct_state_access
ARB_shader_texture_image_samples
ARB_derivative_control
2. Other Supported OpenGL Extensions
The second class of OpenGL extensions is listed below. These extensions are not part of OpenGL 4.5 core or compatibility, but are fully supported by the frame debugger target. Context and object state, which is added by these extensions, may not be displayed by the host UI.
ARB_framebuffer_object
EXT_texture_filter_anisotropic
NV_buffer_store
ARB_vertex_attrib_binding
ARB_multi_draw_indirect
NV_gpu_multicast
ARB_parallel_shader_compile
ARB_seamless_cubemap_per_texture
NV_shader_buffer_load
NV_vertex_buffer_unified_memory
3. Partially Supported OpenGL Extensions
The third class of OpenGL extensions are ones for which there is partial support. These extensions are listed below.
ARB_bindless_texture
WGL_ARB_extensions_string
WGL_ARB_pixel_format
WGL_EXT_extensions_string
WGL_EXT_swap_control
WGL_EXT_swap_control_tear
WGL_ARB_create_context
4. OpenGL Immediate Mode
Beyond the core functionality and extensions, a selection of immediate-mode functions is supported.
glBegin
glEnd
glVertex*
glColor*
glIndex*
glNormal*
glTexCoord*
glDrawElement
glEnableClientState
glDisableClientState
glVertexPointer
glColorPointer
glSecondaryColorPointer
glIndexPointer
glNormalPointer
Supported Vulkan Functions
Nsight Graphics™ 2021.3 frame debugging supports all of Vulkan 1.2.131.
Additionally, the follow extensions to Vulkan 1.2.131 are supported:
VK_EXT_4444_formats
VK_EXT_acquire_xlib_display
VK_EXT_astc_decode_mode
VK_EXT_blend_operation_advanced
VK_EXT_buffer_device_address
VK_EXT_calibrated_timestamps
VK_EXT_conditional_rendering
VK_EXT_conservative_rasterization
VK_EXT_custom_border_color
VK_EXT_debug_marker
VK_EXT_debug_report
VK_EXT_debug_utils
VK_EXT_depth_clip_enable
VK_EXT_depth_range_unrestricted
VK_EXT_descriptor_indexing
VK_EXT_direct_mode_display
VK_EXT_discard_rectangles
VK_EXT_display_surface_counter
VK_EXT_extended_dynamic_state
VK_EXT_external_memory_host
VK_EXT_filter_cubic
VK_EXT_fragment_density_map
VK_EXT_fragment_shader_interlock
VK_EXT_full_screen_exclusive
VK_EXT_global_priority
VK_EXT_hdr_metadata
VK_EXT_headless_surface
VK_EXT_host_query_reset
VK_EXT_image_robustness
VK_EXT_index_type_uint8
VK_EXT_inline_uniform_block
VK_EXT_line_rasterization
VK_EXT_memory_budget
VK_EXT_memory_priority
VK_EXT_pci_bus_info
VK_EXT_pipeline_creation_feedback
VK_EXT_post_depth_coverage
VK_EXT_private_data
VK_EXT_queue_family_foreign
VK_EXT_robustness2
VK_EXT_sample_locations
VK_EXT_sampler_filter_minmax
VK_EXT_scalar_block_layout
VK_EXT_separate_stencil_usage
VK_EXT_shader_atomic_float
VK_EXT_shader_demote_to_helper_invocation
VK_EXT_shader_image_atomic_int64
VK_EXT_shader_stencil_export
VK_EXT_shader_subgroup_ballot
VK_EXT_shader_subgroup_vote
VK_EXT_shader_viewport_index_layer
VK_EXT_subgroup_size_control
VK_EXT_swapchain_colorspace
VK_EXT_texel_buffer_alignment
VK_EXT_texture_compression_astc_hdr
VK_EXT_tooling_info
VK_EXT_transform_feedback
VK_EXT_validation_cache
VK_EXT_validation_features
VK_EXT_validation_flags
VK_EXT_vertex_attribute_divisor
VK_EXT_ycbcr_image_arrays
VK_KHR_16bit_storage
VK_KHR_8bit_storage
VK_KHR_acceleration_structure
VK_KHR_android_surface
VK_KHR_bind_memory2
VK_KHR_buffer_device_address
VK_KHR_create_renderpass2
VK_KHR_dedicated_allocation
VK_KHR_deferred_host_operations
VK_KHR_depth_stencil_resolve
VK_KHR_descriptor_update_template
VK_KHR_device_group
VK_KHR_device_group_creation
VK_KHR_display
VK_KHR_display_swapchain
VK_KHR_draw_indirect_count
VK_KHR_driver_properties
VK_KHR_external_fence
VK_KHR_external_fence_capabilities
VK_KHR_external_fence_fd
VK_KHR_external_fence_win32
VK_KHR_external_memory
VK_KHR_external_memory_capabilities
VK_KHR_external_memory_fd
VK_KHR_external_memory_win32
VK_KHR_external_semaphore
VK_KHR_external_semaphore_capabilities
VK_KHR_external_semaphore_fd
VK_KHR_external_semaphore_win32
VK_KHR_fragment_shading_rate
VK_KHR_get_display_properties2
VK_KHR_get_memory_requirements2
VK_KHR_get_physical_device_properties2
VK_KHR_get_surface_capabilities2
VK_KHR_image_format_list
VK_KHR_imageless_framebuffer
VK_KHR_incremental_present
VK_KHR_maintenance1
VK_KHR_maintenance2
VK_KHR_maintenance3
VK_KHR_multiview
VK_KHR_pipeline_executable_properties
VK_KHR_pipeline_library
VK_KHR_push_descriptor
VK_KHR_ray_query
VK_KHR_ray_tracing_pipeline
VK_KHR_relaxed_block_layout
VK_KHR_sampler_mirror_clamp_to_edge
VK_KHR_sampler_ycbcr_conversion
VK_KHR_separate_depth_stencil_layouts
VK_KHR_shader_atomic_int64
VK_KHR_shader_clock
VK_KHR_shader_draw_parameters
VK_KHR_shader_float16_int8
VK_KHR_shader_float_controls
VK_KHR_shader_non_semantic_info
VK_KHR_shader_subgroup_extended_types
VK_KHR_shader_terminate_invocation
VK_KHR_shared_presentable_image
VK_KHR_spirv_1_4
VK_KHR_storage_buffer_storage_class
VK_KHR_surface
VK_KHR_surface_protected_capabilities
VK_KHR_swapchain
VK_KHR_swapchain_mutable_format
VK_KHR_synchronization2
VK_KHR_timeline_semaphore
VK_KHR_uniform_buffer_standard_layout
VK_KHR_variable_pointers
VK_KHR_vulkan_memory_model
VK_KHR_wayland_surface
VK_KHR_win32_keyed_mutex
VK_KHR_win32_surface
VK_KHR_xcb_surface
VK_KHR_xlib_surface
VK_NVX_image_view_handle
VK_NVX_multiview_per_view_attributes
VK_NV_clip_space_w_scaling
VK_NV_compute_shader_derivatives
VK_NV_cooperative_matrix
VK_NV_corner_sampled_image
VK_NV_coverage_reduction_mode
VK_NV_dedicated_allocation
VK_NV_dedicated_allocation_image_aliasing
VK_NV_device_diagnostic_checkpoints
VK_NV_device_diagnostics_config
VK_NV_device_generated_commands
VK_NV_external_memory
VK_NV_external_memory_capabilities
VK_NV_external_memory_win32
VK_NV_fill_rectangle
VK_NV_fragment_coverage_to_color
VK_NV_fragment_shader_barycentric
VK_NV_framebuffer_mixed_samples
VK_NV_geometry_shader_passthrough
VK_NV_geometry_shader_passthrough
VK_NV_glsl_shader
VK_NV_mesh_shader
VK_NV_ray_tracing
VK_NV_representative_fragment_test
VK_NV_sample_mask_override_coverage
VK_NV_scissor_exclusive
VK_NV_shader_image_footprint
VK_NV_shader_sm_builtins
VK_NV_shader_subgroup_partitioned
VK_NV_shading_rate_image
VK_NV_viewport_array2
VK_NV_viewport_swizzle
The follow extensions to Vulkan 1.2.131 are not currently supported. If your application uses these extensions, please send a feedback feature request to let the Nsight team know about your interest and needs.
VK_EXT_color_write_enable
VK_EXT_device_memory_report
VK_EXT_directfb_surface
VK_EXT_display_control
VK_EXT_external_memory_dma_buf
VK_EXT_fragment_density_map2
VK_EXT_image_drm_format_modifier
VK_EXT_metal_surface
VK_EXT_pipeline_creation_cache_control
VK_EXT_vertex_input_dynamic_state
VK_EXT_video_decode_h264
VK_EXT_video_decode_h265
VK_EXT_video_encode_h264
VK_EXT_ycbcr_2plane_444_formats
VK_KHR_copy_commands2
VK_KHR_performance_query
VK_KHR_portability_subset
VK_KHR_video_decode_queue
VK_KHR_video_encode_queue
VK_KHR_video_queue
VK_KHR_workgroup_memory_explicit_layout
VK_KHR_zero_initialize_workgroup_memory
VK_NV_acquire_winrt_display
VK_NV_fragment_shading_rate_enums
VK_NV_inherited_viewport_scissor
VK_NV_win32_keyed_mutex
Supported NVAPI Functions
Nsight Graphics's Frame Debugger supports a large set of NVAPI functions. The list of functions are the following:
NvAPI_GetErrorMessage
NvAPI_GetInterfaceVersionString
NvAPI_D3D_GetCurrentSLIState
NvAPI_D3D_GetObjectHandleForResource
NvAPI_D3D_SetResourceHint
NvAPI_D3D_BeginResourceRendering
NvAPI_D3D_EndResourceRendering
NvAPI_D3D11_CreateDevice
NvAPI_D3D11_CreateDeviceAndSwapChain
NvAPI_D3D11_SetDepthBoundsTest
NvAPI_D3D11_IsNvShaderExtnOpCodeSupported
NvAPI_D3D11_SetNvShaderExtnSlot
NvAPI_D3D12_SetNvShaderExtnSlotSpace
NvAPI_D3D12_SetNvShaderExtnSlotSpaceLocalThread
NvAPI_D3D11_BeginUAVOverlapEx
NvAPI_D3D11_BeginUAVOverlap
NvAPI_D3D11_EndUAVOverlap
NvAPI_D3D_SetFPSIndicatorState
NvAPI_D3D1x_Present
NvAPI_D3D1x_QueryFrameCount
NvAPI_D3D1x_ResetFrameCount
NvAPI_D3D1x_QueryMaxSwapGroup
NvAPI_D3D1x_QuerySwapGroup
NvAPI_D3D1x_JoinSwapGroup
NvAPI_D3D1x_BindSwapBarrier
NvAPI_D3D11_CreateRasterizerState
NvAPI_D3D11_AliasMSAATexture2DAsNonMSAA
NvAPI_D3D11_CreateGeometryShaderEx_2
NvAPI_D3D11_CreateVertexShaderEx
NvAPI_D3D11_CreateHullShaderEx
NvAPI_D3D11_CreateDomainShaderEx
NvAPI_D3D11_CreatePixelShaderEx_2
NvAPI_D3D11_CreateFastGeometryShaderExplicit
NvAPI_D3D11_CreateFastGeometryShader
NvAPI_D3D11_DecompressView
NvAPI_D3D12_CreateGraphicsPipelineState
NvAPI_D3D12_CreateComputePipelineState
NvAPI_D3D12_SetDepthBoundsTestValues
NvAPI_D3D12_CreateHeap2
NvAPI_D3D12_QueryCpuVisibleVidmem
NvAPI_D3D11_EnumerateMetaCommands
NvAPI_D3D11_CreateMetaCommand
NvAPI_D3D11_InitializeMetaCommand
NvAPI_D3D11_ExecuteMetaCommand
NvAPI_D3D12_EnumerateMetaCommands
NvAPI_D3D12_CreateMetaCommand
NvAPI_D3D12_InitializeMetaCommand
NvAPI_D3D12_ExecuteMetaCommand
NvAPI_D3D12_CreateCommittedResource
NvAPI_D3D12_IsNvShaderExtnOpCodeSupported
NvAPI_D3D_IsGSyncCapable
NvAPI_D3D_IsGSyncActive
NvAPI_D3D1x_DisableShaderDiskCache
NvAPI_D3D11_MultiGPU_GetCaps
NvAPI_D3D11_MultiGPU_Init
NvAPI_D3D_QuerySinglePassStereoSupport
NvAPI_D3D_SetSinglePassStereoMode
NvAPI_D3D12_QuerySinglePassStereoSupport
NvAPI_D3D12_SetSinglePassStereoMode
NvAPI_D3D_QueryMultiViewSupport
NvAPI_D3D_SetMultiViewMode
NvAPI_D3D_QueryModifiedWSupport
NvAPI_D3D_SetModifiedWMode
NvAPI_D3D12_QueryModifiedWSupport
NvAPI_D3D12_SetModifiedWMode
NvAPI_D3D_RegisterDevice
NvAPI_D3D11_MultiDrawInstancedIndirect
NvAPI_D3D11_MultiDrawIndexedInstancedIndirect
NvAPI_D3D_ImplicitSLIControl
NvAPI_D3D1x_GetGraphicsCapabilities
NvAPI_D3D11_RSSetExclusiveScissorRects
NvAPI_D3D11_RSSetViewportsPixelShadingRates
NvAPI_D3D11_CreateShadingRateResourceView
NvAPI_D3D11_RSSetShadingRateResourceView
NvAPI_D3D11_RSGetPixelShadingRateSampleOrder
NvAPI_D3D11_RSSetPixelShadingRateSampleOrder
NvAPI_D3D_InitializeSMPAssist
NvAPI_D3D_QuerySMPAssistSupport
NvAPI_D3D_GetSleepStatus
NvAPI_D3D_SetSleepMode
NvAPI_D3D_Sleep
NvAPI_D3D_GetLatency
NvAPI_D3D_SetLatencyMarker
NvAPI_OGL_ExpertModeSet
NvAPI_OGL_ExpertModeGet
NvAPI_OGL_ExpertModeDefaultsSet
NvAPI_OGL_ExpertModeDefaultsGet
Unsupported Captures
Nsight Graphics maintains a list of the unsupported functions or operations that are used by the application. If an unsupported operation is encountered, an unsupported capture will be reported. This unsupported capture guards against crashes or incorrect results coming from known limitations.
In some cases, however, these unsupported operations might not impact any analysis that follows. Accordingly, after warning about the risks of an unsupported capture, Nsight Graphics will offer the opportunity to proceed despite this warning. If the user proceeds, Nsight Graphics will continue into capture on a best-effort basis.
If you determine that this unsupported operation is innocuous, and you wish to turn it off completely, you may suppress this warning via the Ignore Incompatibilities option. Note that this will prevent you from being notified of future incompatibilities, however, so please use with caution.
Update Notification
Nsight Graphics can check for a new version and notify the user of any updates. There are 2 options available for controlling this feature, found in the Environment tab of the Tools > Options view.
By default, Nsight Graphics checks for updates every time the app is started. This can be changed by selecting “No” for the “Check for updates at startup” option. With this option disabled, Nsight Graphics will still check for updates every 3 days.
Update notifications can be completely disabled by setting the “Show version update notifications” value to “No”.
If the automatic checking feature is disabled, the user can still check for updates by selecting the Help > Check for updates… menu option.
Microsoft Visual Studio Integration
NVIDIA Nsight Integration is a Visual Studio extension that allows you to access the power of Nsight Graphics from within Visual Studio.
When Nsight Graphics is installed along with NVIDIA Nsight Integration, Nsight Graphics activities will appear under the Nsight menu in the Visual Studio menu bar. These activities launch Nsight Graphics with the current project settings and executable, allowing you to reuse all of the settings without manually copying any setting over. You can even set keybindings to launch sessions with a specified Nsight Graphics activity. When you use multiple Nsight tools, such as Nsight Systems or Nsight Compute, you will see independent commands for each of them, greatly simplifying your workflow.