User Guide
NVIDIA Nsight Systems user guide
Profiling from the CLI
Installing the CLI on Your Target
The Nsight Systems CLI provides a simple interface to collect on a target without using the GUI. The collected data can then be copied to any system and analyzed later.
The CLI is distributed in the Target directory of the standard Nsight Systems download package. Users who want to install the CLI as a standalone tool can do so by copying the files within the Target directory. If you want the CLI output file (.qdstrm) to be auto-converted (to .nsys-rep) after the analysis is complete, you will need to copy the host directory as well.
If you wish to run the CLI without root (recommended mode), you will want to install in a directory where you have full access.
Note that you must run the CLI on Windows as administrator.
Command Line Options
The Nsight Systems command lines can have one of two forms:
nsys [global_option]
or
nsys [command_switch][optional command_switch_options][application] [optional application_options]
All command line options are case sensitive. For command switch options, when short options are used, the parameters should follow the switch after a space; e.g. -s process-tree. When long options are used, the switch should be followed by an equal sign and then the parameter(s); e.g. --sample=process-tree.
For this version of Nsight Systems, if you launch a process from the command line to begin analysis, the launched process will be terminated when collection is complete, including runs with --duration set, unless the user specifies the --kill none option (details below). The exception is that if the user uses NVTX, cudaProfilerStart/Stop, or hotkeys to control the duration, the application will continue unless --kill is set.
The Nsight Systems CLI supports concurrent analysis by using sessions. Each Nsight Systems session is defined by a sequence of CLI commands that define one or more collections (e.g. when and what data is collected). A session begins with either a start, launch, or profile command. A session ends with a shutdown command, when a profile command terminates, or, if requested, when all the process tree(s) launched in the session exit. Multiple sessions can run concurrently on the same system.
CLI Global Options
Short |
Long |
Description |
|---|---|---|
-h |
|
Help message providing information about available command switches and their options. |
-v |
|
Output Nsight Systems CLI version information. |
CLI Command Switches
The Nsight Systems command line interface can be used in two modes. You may launch your application and begin analysis with options specified to the nsys profile command. Alternatively, you can control the launch of an application and data collection using interactive CLI commands.
Command |
Description |
|---|---|
analyze |
Post process existing Nsight Systems result, either in .nsys-rep or SQLite format, to generate expert systems report. |
cancel |
Cancels an existing collection started in interactive mode. All data already collected in the current collection is discarded. |
export |
Generates an export file from an existing .nsys-rep file. For more information about the exported formats see the /documentation/nsys-exporter directory in your Nsight Systems installation directory. |
launch |
In interactive mode, launches an application in an environment that supports the requested options. The launch command can be executed before or after a start command. |
nvprof |
Special option to help with transition from legacy NVIDIA nvprof tool. Calling |
profile |
A fully formed profiling description requiring and accepting no further input. The command switch options used (see below table) determine when the collection starts, stops, what collectors are used (e.g. API trace, IP sampling, etc.), what processes are monitored, etc. |
recipe |
PREVIEW FEATURE Post process multiple existing Nsight Systems results, in .nsys-rep or SQLite to generate statistical information and create various plots. See Multi-Node Analysis topic for details. |
sessions |
Gives information about all sessions running on the system. |
shutdown |
Disconnects the CLI process from the launched application and forces the CLI process to exit. If a collection is pending or active, it is cancelled |
start |
Start a collection in interactive mode. The start command can be executed before or after a launch command. |
stats |
Post process existing Nsight Systems result, either in .nsys-rep or SQLite format, to generate statistical information. |
status |
Reports on the status of a CLI-based collection or the suitability of the profiling environment. |
stop |
Stop a collection that was started in interactive mode. When executed, all active collections stop, the CLI process terminates but the application continues running. |
CLI Analyze Command Switch Options
The nsys analyze command generates and outputs to the terminal a report using expert system rules on existing results. Reports are generated from an SQLite export of a .nsys-rep file. If a .nsys-rep file is specified, Nsight Systems will look for an accompanying SQLite file and use it. If no SQLite export file exists, one will be created.
After choosing the analyze command switch, the following options are available. Usage:
nsys [global-options] analyze [options] [input-file]
Short |
Long |
Possible Parameters |
Default |
Switch Description |
|---|---|---|---|---|
|
<tag> |
none |
Print the help message. The option can take one optional argument that will be used as a tag. If a tag is provided, only options relevant to the tag will be printed. |
|
-f |
|
column, table, csv, tsv, json, hdoc, htable, . |
Specify the output format. The special name “.” indicates the default format for the given output. The default format for console is column, while files and process outputs default to csv. This option may be used multiple times. Multiple formats may also be specified using a comma-separated list (<name[:args…][,name[:args…]…]>). See Report Scripts for options available with each format. |
|
|
true, false |
false |
Force a re-export of the SQLite file from the specified .nsys-rep file, even if an SQLite file already exists. |
|
|
true, false |
false |
Overwrite any existing output files. |
|
|
<format_name>, ALL, [none] |
none |
With no argument, list a summary of the available output formats. If a format name is given, a more detailed explanation of the the format is displayed. If |
|
|
<rule_name>, ALL, [none] |
none |
With no argument, list available rules with a short description. If a rule name is given, a more detailed explanation of the rule is displayed. If |
|
-o |
|
-, @<command>, <basename>, . |
|
Specify the output mechanism. There are three output mechanisms: print to console, output to file, or output to command. This option may be used multiple times. Multiple outputs may also be specified using a comma-separated list. If the given output name is “-”, the output will be displayed on the console. If the output name starts with “@”, the output designates a command to run. The nsys command will be executed and the analysis output will be piped into the command. Any other output is assumed to be the base path and name for a file. If a file basename is given, the filename used will be: <basename>_<analysis&args>.<output_format>. The default base (including path) is the name of the SQLite file (as derived from the input file or |
-q |
|
Do not display verbose messages, only display errors. |
||
-r |
|
cuda_memcpy_async, cuda_memcpy_sync, cuda_memset_sync, cuda_api_sync, gpu_gaps, gpu_time_util, dx12_mem_ops |
all |
Specify the rules(s) to execute, including any arguments. This option may be used multiple times. Multiple rules may also be specified using a comma-separated list. See Expert Systems section and |
|
<file.sqlite> |
Specify the SQLite export filename. If this file exists, it will be used. If this file doesn’t exist (or if |
||
|
nsec, nanoseconds, usec, microseconds, msec, milliseconds, seconds |
nanoseconds |
Set basic unit of time. The argument of the switch is matched by using the longest prefix matching. Meaning that it is not necessary to write a whole word as the switch argument. It is similar to passing a “:time=<unit>” argument to every formatter, although the formatter uses more strict naming conventions. See |
CLI Cancel Command Switch Options
After choosing the cancel command switch, the following options are available. Usage:
nsys [global-options] cancel [options]
Short |
Long |
Possible Parameters |
Default |
Switch Description |
|---|---|---|---|---|
|
<tag> |
none |
Print the help message. The option can take one optional argument that will be used as a tag. If a tag is provided, only options relevant to the tag will be printed. |
|
|
<session identifier> |
none |
Cancel the collection in the given session. The option argument must represent a valid session name or ID as reported by |
CLI Export Command Switch Options
After choosing the export command switch, the following options are available. Usage:
nsys [global-options] export [options] [nsys-rep-file]
Short |
Long |
Possible Parameters |
Default |
Switch Description |
|---|---|---|---|---|
-f |
|
true, false |
false |
If true, overwrite all existing result files with same output filename (QDSTRM, nsys-rep, SQLITE, HDF, TEXT, ARROW, JSON). |
|
<tag> |
none |
Print the help message. The option can take one optional argument that will be used as a tag. If a tag is provided, only options relevant to the tag will be printed. |
|
-l |
|
true, false |
true |
Controls if table creation is lazy or not. When true, a table will only be created when it contains data. This option will be deprecated in the future, and all exports will be non-lazy. This affects SQLite, HDF5, and Arrow exports only. |
-o |
|
<filename> |
<inputfile.ext> |
Set the .output filename. The default is the input filename with the extension for the chosen format. |
-q |
|
true, false |
false |
If true, do not display progress bar |
|
true,false |
false |
Output stored strings and thread names separately, with one value per line. This affects JSON and text output only. |
|
-t |
|
arrow, hdf, info, json, sqlite, text |
sqlite |
Export format type. HDF format is supported only on x86_64 Linux and Windows |
|
true, false |
false |
If true, all timestamp values in the report will be shifted to UTC wall-clock time, as defined by the UNIX epoch. This option can be used in conjunction with the |
|
|
signed integer, in nanoseconds |
0 |
If given, all timestamp values in the report will be shifted by the given amount. This option can be used in conjunction with the |
CLI Launch Command Switch Options
After choosing the launch command switch, the following options are available. Usage:
nsys [global-options] launch [options] <application> [application-arguments]
Short |
Long |
Possible Parameters |
Default |
Switch Description |
|---|---|---|---|---|
-b |
|
WARNING: This switch is no longer supported. Please set the |
||
|
true, false |
false |
Collect clock frequency changes. Available in Nsight Systems Embedded Platforms Edition only. |
|
|
0x16, 0x17, …, none |
none |
Collect per-cluster Uncore PMU counters. Multiple values can be selected, separated by commas only (no spaces). Use the |
|
|
< filename > |
none |
Open a file that contains launch switches and parse the switches. Note additional switches on the command line will override switches in the file. This flag can be specified more than once. |
|
|
0x11,0x13,…,none |
none |
Collect per-core PMU counters. Multiple values can be selected, separated by commas only (no spaces). Use the |
|
|
0x2a, 0x2c, …, none |
none |
Collect per-socket Uncore PMU counters. Multiple values can be selected, separated by commas only (no spaces). Use the |
|
|
WARNING: This switch is no longer supported. Please set the |
|||
|
milliseconds |
See description |
Set the interval, in milliseconds, when buffered CUDA data is automatically saved to storage. CUDA data buffer saves may cause profiler overhead. Buffer save behavior can be controlled with this switch. If the CUDA flush interval is set to 0 on systems running CUDA 11.0 or newer, buffers are saved when they fill. If a flush interval is set to a non-zero value on such systems, buffers are saved only when the flush interval expires. If a flush interval is set and the profiler runs out of available buffers before the flush interval expires, additional buffers will be allocated as needed. In this case, setting a flush interval can reduce buffer save overhead but increase memory use by the profiler. If the flush interval is set to 0 on systems running older versions of CUDA, buffers are saved at the end of the collection. If the profiler runs out of available buffers, additional buffers are allocated as needed. If a flush interval is set to a non-zero value on such systems, buffers are saved when the flush interval expires. A cuCtxSynchronize call may be inserted into the workflow before the buffers are saved which will cause application overhead. In this case, setting a flush interval can reduce memory use by the profiler but may increase save overhead. For collections over 30 seconds an interval of 10 seconds is recommended. Default is 10000 for Nsight Systems Embedded Platforms Edition and 0 otherwise. |
|
|
true, false |
false |
Track the GPU memory usage by CUDA kernels. Applicable only when CUDA tracing is enabled. Note: This feature may cause significant runtime overhead. |
|
|
true, false |
false |
This switch tracks the page faults that occur when CPU code tries to access a memory page that resides on the device. Note that this feature may cause significant runtime overhead. Not available on Nsight Systems Embedded Platforms Edition. |
|
|
true, false |
false |
This switch tracks the page faults that occur when GPU code tries to access a memory page that resides on the host. Note that this feature may cause significant runtime overhead. Not available on Nsight Systems Embedded Platforms Edition. |
|
|
all, none, kernel, memory, sync, other |
none |
When tracing CUDA APIs, enable the collection of a backtrace when a CUDA API is invoked. Significant runtime overhead may occur. Values may be combined using ‘,’. Each value except ‘none’ may be appended with a threshold after ‘:’. Threshold is duration, in nanoseconds, that CUDA APIs must execute before backtraces are collected, e.g. ‘kernel:500’. Default value for each threshold is 1000ns (1us). Note: CPU sampling must be enabled. Note: Not available on IBM Power targets. |
|
|
graph, node |
graph |
If ‘graph’ is selected, CUDA graphs will be traced as a whole and node activities will not be collected. This will reduce overhead to a minimum, but requires CUDA driver version 515.43 or higher. If ‘node’ is selected, node activities will be collected, but CUDA graphs will not be traced as a whole. This may cause significant runtime overhead. Default is ‘graph’ if available, otherwise default is ‘node’. |
|
|
true, false |
false |
The Nsight Systems trace initialization involves creating a D3D device and discarding it. Enabling this flag makes a call to DXGIDeclareAdapterRemovalSupport() before device creation. |
|
|
true, false, individual, batch, none |
individual |
If individual or true, trace each DX12 workload’s GPU activity individually. If batch, trace DX12 workloads’ GPU activity in ExecuteCommandLists call batches. If none or false, do not trace DX12 workloads’ GPU activity. Note that this switch is applicable only when |
|
|
true, false |
false |
If true, trace wait calls that block on fences for DX12. Note that this switch is applicable only when |
|
-e |
|
A=B |
NA |
Set environment variable(s) for the application process to be launched. Environment variables should be defined as A=B. Multiple environment variables can be specified as A=B,C=D. |
|
<tag> |
none |
Print the help message. The option can take one optional argument that will be used as a tag. If a tag is provided, only options relevant to the tag will be printed. |
|
|
‘F1’ to ‘F12’ |
‘F12’ |
Hotkey to trigger the profiling session. Note that this switch is applicable only when |
|
-n |
|
true, false |
true |
When true, the current environment variables and the tool’s environment variables will be specified for the launched process. When false, only the tool’s environment variables will be specified for the launched process. |
|
true,false |
true |
Use detours for injection. If false, process injection will be performed by windows hooks which allows to bypass anti-cheat software. |
|
|
true,false |
Trace Interrupt Service Routines (ISRs) and Deferred Procedure Calls (DPCs). Requires administrative privileges. Available only on Windows devices. |
false |
|
|
openmpi,mpich |
openmpi |
When using |
|
-p |
|
range@domain, range, range@* |
none |
Specify NVTX range and domain to trigger the profiling session. Note that this switch is applicable only when |
|
default, <domain_names> |
Choose to exclude NVTX events from a comma separated list of domains. ‘default’ filters the NVTX default domain. A domain with this name or commas in a domain name must be escaped with ‘\’. Note: Only one of |
||
|
default, <domain_names> |
Choose to only include NVTX events from a comma separated list of domains. ‘default’ filters the NVTX default domain. A domain with this name or commas in a domain name must be escaped with ‘\’. Note: Only one of |
||
|
<json_file> |
Specify the path to the JSON file containing the requested NVTX annotations. |
||
|
true, false |
true |
If true, trace the OpenGL workloads’ GPU activity. Note that this switch is applicable only when |
|
|
integer |
24 |
Set the depth for the backtraces collected for OS runtime libraries calls. |
|
|
integer |
6144 |
Set the stack dump size, in bytes, to generate backtraces for OS runtime libraries calls. |
|
|
nanoseconds |
80000 |
Set the duration, in nanoseconds, that all OS runtime libraries calls must execute before backtraces are collected. |
|
|
< nanoseconds > |
1000 ns |
Set the duration, in nanoseconds, that Operating System Runtime (osrt) APIs must execute before they are traced. Values much less than 1000 may cause significant overhead and result in extremely large result files. Default is 1000 (1 microsecond). Note: Not available for IBM Power targets. |
|
|
cuda, none, false |
none |
Collect Python backtrace event when tracing the selected API’s trigger. This option is supported on Arm server (SBSA) platforms and x86 Linux targets. Note: the selected API tracing must be enabled. For example, |
|
|
true, false |
false |
Collect Python backtrace sampling events. This option is supported on Arm server (SBSA) platforms, x86 Linux and Windows targets. Note: When profiling Python-only workflows, consider disabling the CPU sampling option to reduce overhead. |
|
|
1 < integers < 2000 |
1000 |
Specify the Python sampling frequency. The minimum supported frequency is 1Hz. The maximum supported frequency is 2KHz. This option is ignored if the |
|
|
class/event,event,class/event:mode,class:mode,help,none |
none |
Multiple values can be selected, separated by commas only (no spaces). See the |
|
|
system,process,fast,wide |
system:fast |
Values are separated by a colon (‘:’) only (no spaces). ‘system’ and ‘process’ cannot be specified at the same time. ‘fast’ and ‘wide’ cannot be specified at the same time. Please check the QNX documentation to determine when to select the ‘fast’ or ‘wide’ mode. Specify the default mode for QNX kernel events collection. |
|
|
true,false |
true |
Resolve symbols of captured samples and backtraces. |
|
|
< username > |
none |
Run the target application as the specified username. If not specified, the target application will be run by the same user as Nsight Systems. Requires root privileges. Available for Linux targets only. |
|
-s |
|
WARNING: This switch is no longer supported. Please set the |
||
|
WARNING: This switch is no longer supported. Please set the |
|||
|
WARNING: This switch is no longer supported. Please set the |
|||
|
WARNING: This switch is no longer supported. Please set the |
|||
|
WARNING: This switch is no longer supported. Please set the |
|||
|
session identifier |
none |
Launch the application in the indicated session. The option argument must represent a valid session name or ID as reported by |
|
|
[a-Z][0-9,a-Z,spaces] |
[default] |
Launch the application in a new session. Name must start with an alphabetical character followed by printable or space characters. Any |
|
-w |
|
true, false |
true |
If true, send target process’s stdout and stderr streams to both the console and stdout/stderr files which are added to the report file. If false, only send target process stdout and stderr streams to the stdout/stderr files which are added to the report file. |
-t |
|
cuda, nvtx, cublas, cublas-verbose, cusparse, cusparse-verbose, cudnn, opengl, opengl-annotations, openacc, openmp, osrt, mpi, nvvideo, vulkan, vulkan-annotations, dx11, dx11-annotations, dx12, dx12-annotations, oshmem, ucx, wddm, nvmedia, python-gil, none |
cuda, opengl, nvtx, osrt |
Select the API(s) to be traced. The osrt switch controls the OS runtime libraries tracing. Multiple APIs can be selected, separated by commas only (no spaces). Since OpenACC, cuDNN and cuBLAS APIs are tightly linked with CUDA, selecting one of those APIs will automatically enable CUDA tracing. Reflex SDK latency markers will be automatically collected when DX or vulkan API trace is enabled.
See information on |
|
true, false |
false |
If true, trace any child process after fork and before they call one of the exec functions. Beware, tracing in this interval relies on undefined behavior and might cause your application to crash or deadlock. Note: This option is only available on Linux target platforms. |
|
|
true, false, individual, batch, none |
individual |
If individual or true, trace each Vulkan workload’s GPU activity individually. If batch, trace Vulkan workloads’ GPU activity in vkQueueSubmit call batches. If none or false, do not trace Vulkan workloads’ GPU activity. Note that this switch is applicable only when |
|
|
primary,all |
all |
If primary, the CLI will wait on the application process termination. If all, the CLI will additionally wait on re-parented processes created by the application. |
|
|
true, false |
true |
If true, collect additional range of ETW events, including context status, allocations, sync wait and signal events, etc. Note that this switch is applicable only when |
|
|
true, false |
false |
If true, collect backtraces of WDDM events. Disabling this data collection can reduce overhead for certain target applications. Note that this switch is applicable only when |
CLI Profile Command Switch Options
After choosing the profile command switch, the following options are available. Usage:
nsys [global-options] profile [options] <application> [application-arguments]
Short |
Long |
Possible Parameters |
Default |
Switch Description |
|---|---|---|---|---|
|
none,tegra-accelerators |
none |
Collect other accelerators workload trace from the hardware engine units. Available in Nsight Systems Embedded Platforms Edition only. |
|
|
true, false |
false |
Derive report file name from collected data uses details of profiled graphics application. Format: [Process Name][GPU Name][Window Resolution][Graphics API] Timestamp .nsys-rep If true, automatically generate report file names. |
|
-b |
|
auto,fp,lbr,dwarf,none |
Select the backtrace method to use while sampling. The option ‘lbr’ uses Intel(c) Corporation’s Last Branch Record registers, available only with Intel(c) CPUs codenamed Haswell and later. The option ‘fp’ is frame pointer and assumes that frame pointers were enabled during compilation. The option ‘dwarf’ uses DWARF’s CFI (Call Frame Information). Setting the value to ‘none’ can reduce collection overhead. |
|
-c |
|
none, cudaProfilerApi, hotkey, nvtx |
none |
When |
|
none, stop, stop-shutdown, repeat[:N], repeat-shutdown:N |
stop-shutdown |
Specify the desired behavior when a capture range ends. Applicable only when used along with |
|
|
true, false |
false |
Collect clock frequency changes. Available only in Nsight Systems Embedded Platforms Edition and Arm server (SBSA) platforms |
|
|
< filename > |
none |
Open a file that contains profile switches and parse the switches. Note additional switches on the command line will override switches in the file. This flag can be specified more than once. |
|
|
0x16, 0x17, …, none |
none |
Collect per-cluster Uncore PMU counters. Multiple values can be selected, separated by commas only (no spaces). Use the |
|
|
0x11,0x13,…,none |
none |
Collect per-core PMU counters. Multiple values can be selected, separated by commas only (no spaces). Use the |
|
|
‘help’ or the end users selected events in the format ‘x,y’ |
‘2’ i.e. Instructions Retired |
Select the CPU Core events to sample. Use the |
|
|
0x2a, 0x2c, …, none |
none |
Collect per-socket Uncore PMU counters. Multiple values can be selected, separated by commas only (no spaces). Use the |
|
|
process-tree, system-wide, none |
process-tree |
Trace OS thread scheduling activity. Select ‘none’ to disable tracing CPU context switches. Depending on the platform, some values may require admin or root privileges. Note: if the |
|
|
milliseconds |
See Description |
Set the interval, in milliseconds, when buffered CUDA data is automatically saved to storage. CUDA data buffer saves may cause profiler overhead. Buffer save behavior can be controlled with this switch. If the CUDA flush interval is set to 0 on systems running CUDA 11.0 or newer, buffers are saved when they fill. If a flush interval is set to a non-zero value on such systems, buffers are saved only when the flush interval expires. If a flush interval is set and the profiler runs out of available buffers before the flush interval expires, additional buffers will be allocated as needed. In this case, setting a flush interval can reduce buffer save overhead but increase memory use by the profiler. If the flush interval is set to 0 on systems running older versions of CUDA, buffers are saved at the end of the collection. If the profiler runs out of available buffers, additional buffers are allocated as needed. If a flush interval is set to a non-zero value on such systems, buffers are saved when the flush interval expires. A cuCtxSynchronize call may be inserted into the workflow before the buffers are saved which will cause application overhead. In this case, setting a flush interval can reduce memory use by the profiler but may increase save overhead. For collections over 30 seconds an interval of 10 seconds is recommended. Default is 10000 for Nsight Systems Embedded Platforms Edition and 0 otherwise. |
|
|
graph, node |
graph |
If ‘graph’ is selected, CUDA graphs will be traced as a whole and node activities will not be collected. This will reduce overhead to a minimum, but requires CUDA driver version 515.43 or higher. If ‘node’ is selected, node activities will be collected, but CUDA graphs will not be traced as a whole. This may cause significant runtime overhead. Default is ‘graph’ if available, otherwise default is ‘node’. |
|
|
true, false |
false |
Track the GPU memory usage by CUDA kernels. Applicable only when CUDA tracing is enabled. Note: This feature may cause significant runtime overhead. |
|
|
true, false |
false |
This switch tracks the page faults that occur when CPU code tries to access a memory page that resides on the device. Note that this feature may cause significant runtime overhead. Not available on Nsight Systems Embedded Platforms Edition. |
|
|
true, false |
false |
This switch tracks the page faults that occur when GPU code tries to access a memory page that resides on the host. Note that this feature may cause significant runtime overhead. Not availalbe on Nsight Systems Embedded Platforms Edition. |
|
|
all, none, kernel, memory, sync, other |
none |
When tracing CUDA APIs, enable the collection of a backtrace when a CUDA API is invoked. Significant runtime overhead may occur. Values may be combined using ‘,’. Each value except ‘none’ may be appended with a threshold after ‘:’. Threshold is duration, in nanoseconds, that CUDA APIs must execute before backtraces are collected, e.g. ‘kernel:500’. Default value for each threshold is 1000ns (1us). Note: CPU sampling must be enabled. Note: Not available on IBM Power targets. |
|
-y |
|
< seconds > |
0 |
Collection start delay in seconds. |
-d |
|
< seconds > |
NA |
Collection duration in seconds, duration must be greater than zero. The launched process will be terminated when the specified profiling duration expires unless the user specifies the |
|
60 <= integer |
Stop the recording session after this many frames have been captured. Note when it is selected cannot include any other stop options. If not specified, the default is disabled. |
||
|
true, false |
false |
The Nsight Systems trace initialization involves creating a D3D device and discarding it. Enabling this flag makes a call to DXGIDeclareAdapterRemovalSupport() before device creation. Requires DX11 or DX12 trace to be enabled. |
|
|
true, false, individual, batch, none |
individual |
If individual or true, trace each DX12 workload’s GPU activity individually. If batch, trace DX12 workloads’ GPU activity in ExecuteCommandLists call batches. If none or false, do not trace DX12 workloads’ GPU activity. Note that this switch is applicable only when |
|
|
true, false |
true |
If true, trace wait calls that block on fences for DX12. Note that this switch is applicable only when |
|
|
true, false |
false |
Enable EL1 sampling. Available in Nsight Systems Embedded Platforms Edition only. |
|
|
< filepath config.json > |
none |
EL1 sampling config. Available in Nsight Systems Embedded Platforms Edition only. |
|
-e |
|
A=B |
NA |
Set environment variable(s) for the application process to be launched. Environment variables should be defined as A=B. Multiple environment variables can be specified as A=B,C=D. |
|
“<name>,<guid>”, or path to JSON file |
none |
Add custom ETW trace provider(s). If you want to specify more attributes than Name and GUID, provide a JSON configuration file as as outlined below. This switch can be used multiple times to add multiple providers. Note: Only available for Windows targets. |
|
|
system-wide, none |
none |
Use the |
|
|
Integers from 1 to 20 Hz |
3 |
The sampling frequency used to collect event counts. Minimum event sampling frequency is 1 Hz. Maximum event sampling frequency is 20 Hz. Not available in Nsight Systems Embedded Platforms Edition. |
|
|
arrow, hdf, json, sqlite, text, none |
none |
Create additional output file(s) based on the data collected. This option can be given more than once. WARNING: If the collection captures a large amount of data, creating the export file may take several minutes to complete. |
|
|
true, false |
true |
If set to true, any call to cudaProfilerStop() will cause the CUDA trace buffers to be flushed. Note that the CUDA trace buffers will be flushed when the collection ends, irrespective of the value of this switch. |
|
-f |
|
true, false |
false |
If true, overwrite all existing result files with same output filename (.qdstrm, .nsys-rep, .arrows, .h5, .json, .sqlite, .txt). |
|
Collect ftrace events. Argument should list events to collect as: subsystem1/event1,subsystem2/event2. Requires root. No ftrace events are collected by default. Note: Not available on IBM Power targets. |
|||
|
Skip initial ftrace setup and collect already configured events. Default resets the ftrace configuration. |
|||
|
GPU ID, help, all, none |
none |
Collect GPU Metrics from specified devices. Determine GPU IDs by using |
|
|
integer |
10000 |
Specify GPU Metrics sampling frequency. Minimum supported frequency is 10 (Hz). Maximum supported frequency is 200000 (Hz). |
|
|
index, alias |
Specify metric set for GPU Metrics. The argument must be one of indices or aliases reported by |
||
|
true,false |
false |
Trace GPU context switches. Note that this requires driver r435.17 or later and root permission. Not supported on IBM Power targets. |
|
|
<tag> |
none |
Print the help message. The option can take one optional argument that will be used as a tag. If a tag is provided, only options relevant to the tag will be printed. |
|
|
‘F1’ to ‘F12’ |
‘F12’ |
Hotkey to trigger the profiling session. Note that this switch is applicable only when |
|
|
<IB switch GUIDs> |
none |
A comma-separated list of InfiniBand switch GUIDs. Collect InfiniBand switch congestion events from switches identified by the specified GUIDs. This switch can be used multiple times. System scope. Use the –ib-switch-congestion-nic-device, –ib-switch-congestion-percent, and –ib-switch-congestion-threshold-high switches to further control how congestion events are collected. |
|
|
<NIC name> |
none |
The name of the NIC (HCA) through which InfiniBand switches will be accessed. By default, the first active NIC will be used. One way to find a NIC’s name is via the ibnetdiscover –Hca_list | grep “$(hostname)” command. Example usage: –ib-switch-congestion-nic-device=mlx5_3 |
|
|
1 <= integer <= 100 |
50 |
Percent of InfiniBand switch congestion events to be collected. This option enables reducing the network bandwidth consumed by reporting congestion events. |
|
|
1 <= integer <= 1023 |
75 |
High threshold percentage for InfiniBand switch egress port buffer size. Before a packet leaves an InfiniBand switch, it is stored at an egress port buffer. The buffer’s size is checked and if it exceeds the given threshold percentage, a congestion event is reported. The percentage can be greater than 100. |
|
|
<IB switch GUIDs> |
none |
A comma-separated list of InfiniBand switch GUIDs. Collect metrics from the specified InfiniBand switches. This switch can be used multiple times. System scope. |
|
-n |
|
true, false |
true |
When true, the current environment variables and the tool’s environment variables will be specified for the launched process. When false, only the tool’s environment variables will be specified for the launched process. |
|
true,false |
true |
Use detours for injection. If false, process injection will be performed by windows hooks which allows to bypass anti-cheat software. |
|
|
true, false |
false |
Trace Interrupt Service Routines (ISRs) and Deferred Procedure Calls (DPCs). Requires administrative privileges. Available only on Windows devices. |
|
|
none, sigkill, sigterm, signal number |
sigterm |
Send signal to the target application’s process group. Can be used with |
|
|
openmpi,mpich |
openmpi |
When using |
|
|
true, false |
false |
Collect metrics from supported NIC/HCA devices. System scope. Not available on Nsight Systems Embedded Platforms Edition. |
|
-p |
|
range@domain, range, range@* |
none |
Specify NVTX range and domain to trigger the profiling session. This option is applicable only when used along with |
|
default, <domain_names> |
Choose to exclude NVTX events from a comma separated list of domains. ‘default’ excludes NVTX events without a domain. A domain with this name or commas in a domain name must be escaped with ‘\’. Note: Only one of |
||
|
default, <domain_names> |
Choose to only include NVTX events from a comma separated list of domains. ‘default’ filters the NVTX default domain. A domain with this name or commas in a domain name must be escaped with ‘\’. Note: Only one of |
||
|
<json_file> |
Specify the path to the JSON file containing the requested NVTX annotations. |
||
|
true, false |
true |
If true, trace the OpenGL workloads’ GPU activity. Note that this switch is applicable only when |
|
|
‘help’ or the end users selected events in the format ‘x,y’ |
none |
Select the OS events to sample. Use the |
|
|
integer |
24 |
Set the depth for the backtraces collected for OS runtime libraries calls. |
|
|
integer |
6144 |
Set the stack dump size, in bytes, to generate backtraces for OS runtime libraries calls. |
|
|
nanoseconds |
80000 |
Set the duration, in nanoseconds, that all OS runtime libraries calls must execute before backtraces are collected. |
|
|
< nanoseconds > |
1000 ns |
Set the duration, in nanoseconds, that Operating System Runtime (osrt) APIs must execute before they are traced. Values significantly less than 1000 may cause significant overhead and result in extremely large result files. Note: Not available for IBM Power targets. |
|
-o |
|
< filename > |
report# |
Set report file name. Any %q{ENV_VAR} pattern in the filename will be substituted with the value of the environment variable. Any %h pattern in the filename will be substituted with the hostname of the system. Any %p pattern in the filename will be substituted with the PID of the target process or the PID of the root process if there is a process tree. Any %% pattern in the filename will be substituted with %. Default is report#.{qdstrm,nsys-rep,sqlite,h5,txt,arrows,json} in the working directory. |
|
main, process-tree, system-wide |
main |
Select which process(es) to trace. Available in Nsight Systems Embedded Platforms Edition only. Nsight Systems Workstation Edition will always trace system-wide in this version of the tool. |
|
|
cuda, none, false |
none |
Collect Python backtrace event when tracing the selected API’s trigger. This option is supported on Arm server (SBSA) platforms and x86 Linux targets. Note: the selected API tracing must be enabled. For example, |
|
|
true, false |
false |
Collect Python backtrace sampling events. This option is supported on Arm server (SBSA) platforms, x86 Linux and Windows targets. Note: When profiling Python-only workflows, consider disabling the CPU sampling option to reduce overhead. |
|
|
1 < integers < 2000 |
1000 |
Specify the Python sampling frequency. The minimum supported frequency is 1Hz. The maximum supported frequency is 2KHz. This option is ignored if the |
|
|
class/event,event,class/event:mode,class:mode,help,none |
none |
Multiple values can be selected, separated by commas only (no spaces). See the |
|
|
system,process,fast,wide |
system:fast |
Values are separated by a colon (‘:’) only (no spaces). ‘system’ and ‘process’ cannot be specified at the same time. ‘fast’ and ‘wide’ cannot be specified at the same time. Please check the QNX documentation to determine when to select the ‘fast’ or ‘wide’ mode. Specify the default mode for QNX kernel events collection. |
|
|
true,false |
true |
Resolve symbols of captured samples and backtraces. |
|
|
true, false |
false |
Retain ETW files generated by the trace, merge and move the files to the output directory. |
|
|
< username > |
none |
Run the target application as the specified username. If not specified, the target application will be run by the same user as Nsight Systems. Requires root privileges. Available for Linux targets only. |
|
-s |
|
process-tree, system-wide, none |
process-tree |
Select how to collect CPU IP/backtrace samples. If ‘none’ is selected, CPU sampling is disabled. Depending on the platform, some values may require admin or root privileges. If a target application is launched, the default is ‘process-tree’, otherwise, the default is ‘none’. Note: ‘system-wide’ is not available on all platforms. Note: If set to ‘none’, CPU context switch data will still be collected unless the |
|
integer <= 32 |
1 |
The number of CPU IP samples collected for every CPU IP/backtrace sample collected. For example, if set to 4, on the fourth CPU IP sample collected, a backtrace will also be collected. Lower values increase the amount of data collected. Higher values can reduce collection overhead and reduce the number of CPU IP samples dropped. If DWARF backtraces are collected, the default is 4, otherwise the default is 1. This option is not available on Nsight Systems Embedded Platforms Edition or on non-Linux targets. |
|
|
100 < integers < 8000 |
1000 |
Specify the sampling/backtracing frequency. The minimum supported frequency is 100 Hz. The maximum supported frequency is 8000 Hz. This option is supported only on QNX, Linux for Tegra, and Windows targets. |
|
|
integer |
determined dynamically |
The number of CPU Cycle events counted before a CPU instruction pointer (IP) sample is collected. If configured, backtraces may also be collected. The smaller the sampling period, the higher the sampling rate. Note that smaller sampling periods will increase overhead and significantly increase the size of the result file(s). Requires |
|
|
integer |
determined dynamically |
The number of events counted before a CPU instruction pointer (IP) sample is collected. The event used to trigger the collection of a sample is determined dynamically. For example, on Intel based platforms, it will probably be “Reference Cycles” and on AMD platforms, “CPU Cycles”. If configured, backtraces may also be collected. The smaller the sampling period, the higher the sampling rate. Note that smaller sampling periods will increase overhead and significantly increase the size of the result file(s). This option is available only on Linux targets. |
|
|
timer, sched, perf, cuda |
timer,sched |
Specify backtrace collection trigger. Multiple APIs can be selected, separated by commas only (no spaces). Available on Nsight Systems Embedded Platforms Edition targets only. |
|
|
[a-Z][0-9,a-Z,spaces] |
profile-<id>-<application> |
Name the session created by the command. Name must start with an alphabetical character followed by printable or space characters. Any |
|
-w |
|
true, false |
true |
If true, send target process’s stdout and stderr streams to both the console and stdout/stderr files which are added to the report file. If false, only send target process stdout and stderr streams to the stdout/stderr files which are added to the report file. |
|
true,false |
false |
Collect SOC Metrics. Available in Nsight Systems Embedded Platforms Edition only. |
|
|
integer |
10000 |
Specify SOC Metrics sampling frequency. Minimum supported frequency is ‘100’ (Hz). Maximum supported frequency is ‘1000000’ (Hz). Available in Nsight Systems Embedded Platforms Edition only. |
|
|
see description |
see description |
Specify metric set for SOC Metrics sampling. The option argument must be one of indices or aliases reported by |
|
|
1 <= integer |
Start the recording session when the frame index reaches the frame number preceding the start frame index. Note when it is selected cannot include any other start options. If not specified, the default is disabled. |
||
|
true, false |
false |
Generate summary statistics after the collection. WARNING: When set to true, an SQLite database will be created after the collection. If the collection captures a large amount of data, creating the database file may take several minutes to complete. |
|
-x |
|
true, false |
true |
If true, stop collecting automatically when the launched process has exited or when the duration expires - whichever occurs first. If false, duration must be set and the collection stops only when the duration expires. Nsight Systems does not officially support runs longer than 5 minutes. |
-t |
|
cuda, nvtx, cublas, cublas-verbose, cusparse, cusparse-verbose, cudnn, opengl, opengl-annotations, openacc, openmp, osrt, mpi, nvvideo, vulkan, vulkan-annotations, dx11, dx11-annotations, dx12, dx12-annotations, oshmem, ucx, wddm, tegra-accelerators, python-gil, none |
cuda, opengl, nvtx, osrt |
Select the API(s) to be traced. The osrt switch controls the OS runtime libraries tracing. Multiple APIs can be selected, separated by commas only (no spaces). Since OpenACC, cuDNN and cuBLAS APIs are tightly linked with CUDA, selecting one of those APIs will automatically enable CUDA tracing. Reflex SDK latency markers will be automatically collected when DX or vulkan API trace is enabled. See information on |
|
true, false |
false |
If true, trace any child process after fork and before they call one of the exec functions. Beware, tracing in this interval relies on undefined behavior and might cause your application to crash or deadlock. Note: This option is only available on Linux target platforms. |
|
|
true, false |
false |
Collect vsync events. If collection of vsync events is enabled, display/display_scanline ftrace events will also be captured. Available in Nsight Systems Embedded Platforms Edition only. |
|
|
true, false, individual, batch, none |
individual |
If individual or true, trace each Vulkan workload’s GPU activity individually. If batch, trace Vulkan workloads’ GPU activity in vkQueueSubmit call batches. If none or false, do not trace Vulkan workloads’ GPU activity. Note that this switch is applicable only when |
|
|
primary,all |
all |
If primary, the CLI will wait on the application process termination. If all, the CLI will additionally wait on re-parented processes created by the application. |
|
|
true, false |
true |
If true, collect additional range of ETW events, including context status, allocations, sync wait and signal events, etc. Note that this switch is applicable only when |
|
|
true, false |
false |
If true, collect backtraces of WDDM events. Disabling this data collection can reduce overhead for certain target applications. Note that this switch is applicable only when |
|
|
< filepath pct.json > |
none |
Collect hypervisor trace. Available in Nsight Systems Embedded Platforms Edition only. |
|
|
all, none, core, sched, irq, trap |
all |
Available in Nsight Systems Embedded Platforms Edition only. |
CLI Sessions Command Switch Subcommands
After choosing the sessions command switch, the following subcommands are available. Usage:
nsys [global-options] sessions [subcommand]
Subcommand |
Description |
|---|---|
list |
List all active sessions including ID, name, and state information |
CLI Sessions List Command Switch Options
After choosing the sessions list command switch, the following options are available. Usage:
nsys [global-options] sessions list [options]
Short |
Long |
Possible Parameters |
Default |
Switch Description |
|---|---|---|---|---|
|
<tag> |
none |
Print the help message. The option can take one optional argument that will be used as a tag. If a tag is provided, only options relevant to the tag will be printed. |
|
-p |
|
true, false |
true |
Controls whether a header should appear in the output. |
CLI Shutdown Command Switch Options
After choosing the shutdown command switch, the following options are available. Usage:
nsys [global-options] shutdown [options]
Short |
Long |
Possible Parameters |
Default |
Switch Description |
|---|---|---|---|---|
|
<tag> |
none |
Print the help message. The option can take one optional argument that will be used as a tag. If a tag is provided, only options relevant to the tag will be printed. |
|
|
On Linux: one, sigkill, sigterm, signal number On Windows: true, false |
On Linux: sigterm On Windows: true |
Send signal to the target application’s process group when shutting down session. |
|
|
session identifier |
none |
Shutdown the indicated session. The option argument must represent a valid session name or ID as reported by |
CLI Start Command Switch Options
After choosing the start command switch, the following options are available. Usage:
nsys [global-options] start [options]
Short |
Long |
Possible Parameters |
Default |
Switch Description |
|---|---|---|---|---|
|
none,tegra-accelerators |
none |
Collect other accelerators workload trace from the hardware engine units. Only available on Nsight Systems Embedded Platforms Edition. |
|
-b |
|
auto,fp,lbr,dwarf,none |
Select the backtrace method to use while sampling. The option ‘lbr’ uses Intel(c) Corporation’s Last Branch Record registers, available only with Intel(c) CPUs codenamed Haswell and later. The option ‘fp’ is frame pointer and assumes that frame pointers were enabled during compilation. The option ‘dwarf’ uses DWARF’s CFI (Call Frame Information). Setting the value to ‘none’ can reduce collection overhead. |
|
-c |
|
none, cudaProfilerApi, hotkey, nvtx |
none |
When |
|
none, stop, stop-shutdown, repeat[:N], repeat-shutdown:N |
stop-shutdown |
Specify the desired behavior when a capture range ends. Applicable only when used along with |
|
|
‘help’ or the end users selected events in the format ‘x,y’ |
‘2’ i.e. Instructions Retired |
Select the CPU Core events to sample. Use the |
|
|
process-tree, system-wide, none |
process-tree |
Trace OS thread scheduling activity. Select ‘none’ to disable tracing CPU context switches. Depending on the platform, some values may require admin or root privileges. Note: if the |
|
|
true, false |
false |
Enable EL1 sampling. Available in Nsight Systems Embedded Platforms Edition only. |
|
|
< filepath config.json > |
none |
EL1 sampling config. Available in Nsight Systems Embedded Platforms Edition only. |
|
|
“<name>,<guid>”, or path to JSON file |
none |
Add custom ETW trace provider(s). If you want to specify more attributes than Name and GUID, provide a JSON configuration file as as outlined below. This switch can be used multiple times to add multiple providers. Note: Only available for Windows targets. |
|
|
system-wide, none |
none |
Use the |
|
|
Integers from 1 to 20 Hz |
3 |
The sampling frequency used to collect event counts. Minimum event sampling frequency is 1 Hz. Maximum event sampling frequency is 20 Hz. Not available in Nsight Systems Embedded Platforms Edition. |
|
|
arrow, hdf, json, sqlite, text, none |
none |
Create additional output file(s) based on the data collected. This option can be given more than once. WARNING: If the collection captures a large amount of data, creating the export file may take several minutes to complete. |
|
|
true, false |
true |
If set to true, any call to cudaProfilerStop() will cause the CUDA trace buffers to be flushed. Note that the CUDA trace buffers will be flushed when the collection ends, irrespective of the value of this switch. |
|
-f |
|
true, false |
false |
If true, overwrite all existing result files with same output filename (.qdstrm, .nsys-rep, .arrows, .hdf, .json, .sqlite, .txt). |
|
Collect ftrace events. Argument should list events to collect as: subsystem1/event1,subsystem2/event2. Requires root. No ftrace events are collected by default. Note: Not supported on IBM Power targets. |
|||
|
true, false |
false |
Skip initial ftrace setup and collect already configured events. Default resets the ftrace configuration. |
|
|
GPU ID, help, all, none |
none |
Collect GPU Metrics from specified devices. Determine GPU IDs by using |
|
|
integer |
10000 |
Specify GPU Metrics sampling frequency. Minimum supported frequency is 10 (Hz). Maximum supported frequency is 200000(Hz). |
|
|
index |
first |
Specify metric set for GPU Metrics sampling. The argument must be one of indices reported by |
|
|
true,false |
false |
Trace GPU context switches. Note that this requires driver r435.17 or later and root permission. Not supported on IBM Power targets. |
|
|
<tag> |
none |
Print the help message. The option can take one optional argument that will be used as a tag. If a tag is provided, only options relevant to the tag will be printed. |
|
|
<IB switch GUIDs> |
none |
A comma-separated list of InfiniBand switch GUIDs. Collect InfiniBand switch congestion events from switches identified by the specified GUIDs. This switch can be used multiple times. System scope. Use the –ib-switch-congestion-nic-device, –ib-switch-congestion-percent, and –ib-switch-congestion-threshold-high switches to further control how congestion events are collected. |
|
|
<NIC name> |
none |
The name of the NIC (HCA) through which InfiniBand switches will be accessed. By default, the first active NIC will be used. One way to find a NIC’s name is via the ibnetdiscover –Hca_list | grep “$(hostname)” command. Example usage: –ib-switch-congestion-nic-device=mlx5_3 |
|
|
1 <= integer <= 100 |
50 |
Percent of InfiniBand switch congestion events to be collected. This option enables reducing the network bandwidth consumed by reporting congestion events. |
|
|
1 <= integer <= 1023 |
75 |
High threshold percentage for InfiniBand switch egress port buffer size. Before a packet leaves an InfiniBand switch, it is stored at an egress port buffer. The buffer’s size is checked and if it exceeds the given threshold percentage, a congestion event is reported. The percentage can be greater than 100. |
|
|
true, false |
false |
Trace Interrupt Service Routines (ISRs) and Deferred Procedure Calls (DPCs). Requires administrative privileges. Available only on Windows devices. |
|
|
true, false |
false |
Collect metrics from supported NIC/HCA devices. System scope. Not available on Nsight Systems Embedded Platforms Edition. |
|
|
‘help’ or the end users selected events in the format ‘x,y’ |
none |
Select the OS events to sample. Use the |
|
-o |
|
< filename > |
report# |
Set report file name. Any %q{ENV_VAR} pattern in the filename will be substituted with the value of the environment variable. Any %h pattern in the filename will be substituted with the hostname of the system. Any %p pattern in the filename will be substituted with the PID of the target process or the PID of the root process if there is a process tree. Any %% pattern in the filename will be substituted with %. Default is report#.{nsys-rep,sqlite,h5,txt,arrows,json} in the working directory. |
|
main, process-tree, system-wide |
main |
Select which process(es) to trace. Available in Nsight Systems Embedded Platforms Edition only. Nsight Systems Workstation Edition will always trace system-wide in this version of the tool. |
|
|
true, false |
false |
Retain ETW files generated by the trace, merge and move the files to the output directory. |
|
-s |
|
process-tree, system-wide, none |
process-tree |
Select how to collect CPU IP/backtrace samples. If ‘none’ is selected, CPU sampling is disabled. Depending on the platform, some values may require admin or root privileges. If a target application is launched, the default is ‘process-tree’, otherwise, the default is ‘none’. Note: ‘system-wide’ is not available on all platforms. Note: If set to ‘none’, CPU context switch data will still be collected unless the |
|
integer <= 32 |
1 |
The number of CPU IP samples collected for every CPU IP/backtrace sample collected. For example, if set to 4, on the fourth CPU IP sample collected, a backtrace will also be collected. Lower values increase the amount of data collected. Higher values can reduce collection overhead and reduce the number of CPU IP samples dropped. If DWARF backtraces are collected, the default is 4, otherwise the default is 1. This option is not available on Nsight Systems Embedded Platforms Edition or on non-Linux targets. |
|
|
integers between 100 and 8000 |
1000 |
Specify the sampling/backtracing frequency. The minimum supported frequency is 100 Hz. The maximum supported frequency is 8000 Hz. This option is supported only on QNX, Linux for Tegra, and Windows targets. Requires |
|
|
integer |
determined dynamically |
The number of CPU Cycle events counted before a CPU instruction pointer (IP) sample is collected. If configured, backtraces may also be collected. The smaller the sampling period, the higher the sampling rate. Note that smaller sampling periods will increase overhead and significantly increase the size of the result file(s). Requires |
|
|
integer |
determined dynamically |
The number of events counted before a CPU instruction pointer (IP) sample is collected. The event used to trigger the collection of a sample is determined dynamically. For example, on Intel based platforms, it will probably be “Reference Cycles” and on AMD platforms, “CPU Cycles”. If configured, backtraces may also be collected. The smaller the sampling period, the higher the sampling rate. Note that smaller sampling periods will increase overhead and significantly increase the size of the result file(s). This option is available only on Linux targets. |
|
|
timer, sched, perf, cuda |
timer,sched |
Specify backtrace collection trigger. Multiple APIs can be selected, separated by commas only (no spaces). Available on Nsight Systems Embedded Platforms Edition targets only. |
|
|
session identifier |
none |
Start the application in the indicated session. The option argument must represent a valid session name or ID as reported by |
|
|
[a-Z][0-9,a-Z,spaces] |
[default] |
Start the application in a new session. Name must start with an alphabetical character followed by printable or space characters. Any |
|
|
true,false |
false |
Collect SOC Metrics. Available in Nsight Systems Embedded Platforms Edition only. |
|
|
integer |
10000 |
Specify SOC Metrics sampling frequency. Minimum supported frequency is ‘100’ (Hz). Maximum supported frequency is ‘1000000’ (Hz). Available in Nsight Systems Embedded Platforms Edition only. |
|
|
see description |
see description |
Specify metric set for SOC Metrics sampling. The option argument must be one of indices or aliases reported by |
|
|
true, false |
false |
Generate summary statistics after the collection. WARNING: When set to true, an SQLite database will be created after the collection. If the collection captures a large amount of data, creating the database file may take several minutes to complete. |
|
-x |
|
true, false |
true |
If true, stop collecting automatically when all tracked processes have exited or when |
|
true, false |
false |
Collect vsync events. If collection of vsync events is enabled, display/display_scanline ftrace events will also be captured. Available in Nsight Systems Embedded Platforms Edition only. |
|
|
< filepath pct.json > |
none |
Collect hypervisor trace. Available in Nsight Systems Embedded Platforms Edition only. |
|
|
all, none, core, sched, irq, trap |
all |
Available in Nsight Systems Embedded Platforms Edition only. |
CLI Stats Command Switch Options
The nsys stats command generates a series of summary or trace reports.
These reports can be output to the console, or to individual files, or piped to
external processes. Reports can be rendered in a variety of different output
formats, from human readable columns of text, to formats more appropriate for
data exchange, such as CSV.
Reports are generated from an SQLite export of a .nsys-rep file. If a .nsys-rep file is specified, Nsight Systems will look for an accompanying SQLite file and use it. If no SQLite file exists, one will be exported and created.
Individual reports are generated by calling out to scripts that read data from the SQLite file and return their report data in CSV format. Nsight Systems ingests this data and formats it as requested, then displays the data to the console, writes it to a file, or pipes it to an external process. Adding new reports is as simple as writing a script that can read the SQLite file and generate the required CSV output. See the shipped scripts as an example. Both reports and formatters may take arguments to tweak their processing. For details on shipped scripts and formatters, see Report Scripts topic.
Reports are processed using a three-tuple that consists of 1) the requested report (and any arguments), 2) the presentation format (and any arguments), and 3) the output (filename, console, or external process). The first report specified uses the first format specified, and is presented via the first output specified. The second report uses the second format for the second output, and so forth. If more reports are specified than formats or outputs, the format and/or output list is expanded to match the number of provided reports by repeating the last specified element of the list (or the default, if nothing was specified).
nsys stats is a very powerful command and can handle complex argument
structures, please see the topic below on Example Stats Command Sequences.
After choosing the stats command switch, the following options are
available. Usage:
nsys [global-options] stats [options] [input-file]
Short |
Long |
Possible Parameters |
Default |
Switch Description |
|---|---|---|---|---|
|
<tag> |
none |
Print the help message. The option can take one optional argument that will be used as a tag. If a tag is provided, only options relevant to the tag will be printed. |
|
-f |
|
column, table, csv, tsv, json, hdoc, htable, . |
Specify the output format. The special name “.” indicates the default format for the given output. The default format for console is column, while files and process outputs default to csv. This option may be used multiple times. Multiple formats may also be specified using a comma-separated list (<name[:args…][,name[:args…]…]>). See Report Scripts for options available with each format. |
|
|
true, false |
false |
Force a re-export of the SQLite file from the specified .nsys-rep file, even if an SQLite file already exists. |
|
|
true, false |
false |
Overwrite any existing report file(s). |
|
|
<format_name>, ALL, [none] |
none |
With no argument, give a summary of the available output formats. If a format name is given, a more detailed explanation of that
format is displayed. If |
|
|
<report_name>, ALL, [none] |
none |
With no argument, list a summary of the available summary and trace reports. If a report name is given, a more detailed explanation
of the report is displayed. If |
|
-o |
|
-, @<command>, <basename>, . |
|
Specify the output mechanism. There are three output mechanisms: print to console, output to file, or output to command. This
option may be used multiple times. Multiple outputs may also be specified using a comma-separated list. If the given output name
is “-”, the output will be displayed on the console. If the output name starts with “@”, the output designates a command to run.
The nsys command will be executed and the analysis output will be piped into the command. Any other output is assumed to be the
base path and name for a file. If a file basename is given, the filename used will be: <basename>_<analysis&args>.<output_format>.
The default base (including path) is the name of the SQLite file (as derived from the input file or |
-q |
|
Do not display verbose messages, only display errors. |
||
-r |
|
See Report Scripts |
Specify the report(s) to generate, including any arguments. This option may be used multiple times. Multiple reports may also be specified using a comma-separated list (<name[:args…][,name[:args…]…]>). If no reports are specified, the following will be used as the default report set: nvtx_sum, osrt_sum, cuda_api_sum, cuda_gpu_kern_sum, cuda_gpu_mem_time_sum, cuda_gpu_mem_size_sum, openmp_sum, opengl_khr_range_sum, opengl_khr_gpu_range_sum, vulkan_marker_sum, vulkan_gpu_marker_sum, dx11_pix_sum, dx12_gpu_marker_sum, dx12_pix_sum, wddm_queue_sum, um_sum, um_total_sum, um_cpu_page_faults_sum, openacc_sum. See Report Scripts section for details about existing built-in scripts and how to make your own. |
|
|
<path> |
Add a directory to the path used to find report scripts. This is usually only needed if you have one or more directories with
personal scripts. This option may be used multiple times. Each use adds a new directory to the end of the path. A search path can
also be defined using the environment variable “NSYS_STATS_REPORT_PATH”. Directories added this way will be added after the
application flags. The last two entries in the path will always be the current working directory, followed by the directory
containing the shipped |
||
|
<file.sqlite> |
Specify the SQLite export filename. If this file exists, it will be used. If this file doesn’t exist (or if |
||
|
nsec, nanoseconds, usec, microseconds, msec, milliseconds, seconds |
nanoseconds |
Set basic unit of time. The argument of the switch is matched by using the longest prefix matching. Meaning that it is not
necessary to write a whole word as the switch argument. It is similar to passing a “:time=<unit>” argument to every formatter,
although the formatter uses more strict naming conventions. See |
CLI Status Command Switch Options
The nsys status command returns the current state of the CLI. After choosing the status command switch, the following options are available. Usage:
nsys [global-options] status [options]
Short |
Long |
Possible Parameters |
Default |
Switch Description |
|---|---|---|---|---|
|
Prints information for all the available profiling environments. |
|||
-e |
|
Returns information about the system regarding suitability of the profiling environment. |
||
|
<tag> |
none |
Print the help message. The option can take one optional argument that will be used as a tag. If a tag is provided, only options relevant to the tag will be printed. |
|
-n |
|
Returns information about the system regarding suitability of the network profiling environment. |
||
|
session identifier |
none |
Print the status of the indicated session. The option argument must represent a valid session name or ID as reported by |
CLI Stop Command Switch Options
After choosing the stop command switch, the following options are available. Usage:
nsys [global-options] stop [options]
Short |
Long |
Possible Parameters |
Default |
Switch Description |
|---|---|---|---|---|
|
<tag> |
none |
Print the help message. The option can take one optional argument that will be used as a tag. If a tag is provided, only options relevant to the tag will be printed. |
|
|
session identifier |
none |
Stop the indicated session. The option argument must represent a valid session name or ID as reported by |
Example Single Command Lines
Version Information
nsys -v
Effect: Prints tool version information to the screen.
Run with elevated privilege
sudo nsys profile <app>
Effect: Nsight Systems CLI (and target application) will run with elevated privilege. This is necessary for some features, such as FTrace or system-wide CPU sampling. If you don’t want the target application to be elevated, use --run-as option.
Default analysis run
nsys profile <application>
    [application-arguments]
Effect: Launch the application using the given arguments. Start collecting immediately and end collection when the application stops. Trace CUDA, OpenGL, NVTX, and OS runtime libraries APIs. Collect CPU sampling information and thread scheduling information. With Nsight Systems Embedded Platforms Edition this will only analysis the single process. With Nsight Systems Workstation Edition this will trace the process tree. Generate the report#.nsys-rep file in the default location, incrementing the report number if needed to avoid overwriting any existing output files.
Limited trace only run
nsys profile --trace=cuda,nvtx -d 20
    --sample=none --cpuctxsw=none -o my_test <application>
    [application-arguments]
Effect: Launch the application using the given arguments. Start collecting immediately and end collection after 20 seconds or when the application ends. Trace CUDA and NVTX APIs. Do not collect CPU sampling information or thread scheduling information. Profile any child processes. Generate the output file as my_test.nsys-rep in the current working directory.
Delayed start run
nsys profile -e TEST_ONLY=0 -y 20
    <application> [application-arguments]
Effect: Set environment variable TEST_ONLY=0. Launch the application using the given arguments. Start collecting after 20 seconds and end collection at application exit. Trace CUDA, OpenGL, NVTX, and OS runtime libraries APIs. Collect CPU sampling and thread schedule information. Profile any child processes. Generate the report#.nsys-rep file in the default location, incrementing if needed to avoid overwriting any existing output files.
Collect ftrace events
nsys profile --ftrace=drm/drm_vblank_event
    -d 20
Effect: Collect ftrace drm_vblank_event events for 20 seconds. Generate the report#.nsys-rep file in the current working directory. Note that ftrace event collection requires running as root. To get a list of ftrace events available from the kernel, run the following:
sudo cat /sys/kernel/debug/tracing/available_events
Run GPU metric sampling on one TU10x
nsys profile --gpu-metrics-device=0
    --gpu-metrics-set=tu10x-gfxt <application>
Effect: Launch application. Collect default options and GPU metrics for the first GPU (a TU10x), using the tu10x-gfxt metric set at the default frequency (10 kHz). Profile any child processes. Generate the report#.nsys-rep file in the default location, incrementing if needed to avoid overwriting any existing output files.
Run GPU metric sampling on all GPUs at a set frequency
nsys profile --gpu-metrics-device=all
    --gpu-metrics-frequency=20000 <application>
Effect: Launch application. Collect default options and GPU metrics for all available GPUs using the first suitable metric set for each and sampling at 20 kHz. Profile any child processes. Generate the report#.nsys-rep file in the default location, incrementing if needed to avoid overwriting any existing output files.
Collect CPU IP/backtrace and CPU context switch
nsys profile --sample=system-wide --duration=5
Effect: Collects both CPU IP/backtrace samples using the default backtrace mechanism and traces CPU context switch activity for the whole system for 5 seconds. Note that it requires root permission to run. No hardware or OS events are sampled. Post processing of this collection will take longer due to the large number of symbols to be resolved caused by system-wide sampling.
Get list of available CPU core events
nsys profile --cpu-core-events=help
Effect: Lists the CPU events that can be sampled and the maximum number of CPU events that can be sampled concurrently.
Collect system-wide CPU events and trace application
nsys profile --event-sample=system-wide
    --cpu-core-events='1,2' --event-sampling-frequency=5 <app> [app args]
Effect:Collects CPU IP/backtrace samples using the default backtrace mechanism, traces CPU context switch activity, and samples each CPU’s “CPU Cycles” and “Instructions Retired” event every 200 ms for the whole system. Note that it requires root permission to run. Note that CUDA, NVTX, OpenGL, and OSRT within the app launched by Nsight Systems are traced by default while using this command. Post processing of this collection will take longer due to the large number of symbols to be resolved caused by system-wide sampling.
Collect custom ETW trace using configuration file
nsys profile --etw-provider=file.JSON
Effect: Configure custom ETW collectors using the contents of file.JSON. Collect data for 20 seconds. Generate the report#.nsys-rep file in the current working directory.
A template JSON configuration file is located at in the Nsight Systems installation directory as \target-windows-x64\etw_providers_template.json. This path will show up automatically if you call
nsys profile --help
The level attribute can only be set to one of the following:
TRACE_LEVEL_CRITICAL
TRACE_LEVEL_ERROR
TRACE_LEVEL_WARNING
TRACE_LEVEL_INFORMATION
TRACE_LEVEL_VERBOSE
The flags attribute can only be set to one or more of the following:
EVENT_TRACE_FLAG_ALPC
EVENT_TRACE_FLAG_CSWITCH
EVENT_TRACE_FLAG_DBGPRINT
EVENT_TRACE_FLAG_DISK_FILE_IO
EVENT_TRACE_FLAG_DISK_IO
EVENT_TRACE_FLAG_DISK_IO_INIT
EVENT_TRACE_FLAG_DISPATCHER
EVENT_TRACE_FLAG_DPC
EVENT_TRACE_FLAG_DRIVER
EVENT_TRACE_FLAG_FILE_IO
EVENT_TRACE_FLAG_FILE_IO_INIT
EVENT_TRACE_FLAG_IMAGE_LOAD
EVENT_TRACE_FLAG_INTERRUPT
EVENT_TRACE_FLAG_JOB
EVENT_TRACE_FLAG_MEMORY_HARD_FAULTS
EVENT_TRACE_FLAG_MEMORY_PAGE_FAULTS
EVENT_TRACE_FLAG_NETWORK_TCPIP
EVENT_TRACE_FLAG_NO_SYSCONFIG
EVENT_TRACE_FLAG_PROCESS
EVENT_TRACE_FLAG_PROCESS_COUNTERS
EVENT_TRACE_FLAG_PROFILE
EVENT_TRACE_FLAG_REGISTRY
EVENT_TRACE_FLAG_SPLIT_IO
EVENT_TRACE_FLAG_SYSTEMCALL
EVENT_TRACE_FLAG_THREAD
EVENT_TRACE_FLAG_VAMAP
EVENT_TRACE_FLAG_VIRTUAL_ALLOC
Typical case: profile a Python script that uses CUDA
nsys profile --trace=cuda,cudnn,cublas,osrt,nvtx
    --delay=60 python my_dnn_script.py
Effect: Launch a Python script and start profiling it 60 seconds after the launch, tracing CUDA, cuDNN, cuBLAS, OS runtime APIs, and NVTX as well as collecting thread schedule information.
Typical case: profile an app that uses Vulkan
nsys profile --trace=vulkan,osrt,nvtx
    --delay=60 ./myapp
Effect: Launch an app and start profiling it 60 seconds after the launch, tracing Vulkan, OS runtime APIs, and NVTX as well as collecting CPU sampling and thread schedule information.
Example Interactive CLI Command Sequences
Collect from beginning of application, end manually
nsys start --stop-on-exit=false
nsys launch --trace=cuda,nvtx --sample=none <application> [application-arguments]
nsys stop
Effect: Create interactive CLI process and set it up to begin collecting as soon as an application is launched. Launch the application, set up to allow tracing of CUDA and NVTX as well as collection of thread schedule information. Stop only when explicitly requested. Generate the report#.nsys-rep in the default location.
Note
If you start a collection and fail to stop the collection (or if you are allowing it to stop on exit, and the application runs for too long) your system’s storage space may be filled with collected data causing significant issues for the system. Nsight Systems will collect a different amount of data/sec depending on options, but in general Nsight Systems does not support runs of more than 5 minutes duration.
Run application, begin collection manually, run until process ends
nsys launch -w true <application> [application-arguments]
nsys start
Effect: Create interactive CLI and launch an application set up for default analysis. Send application output to the terminal. No data is collected until you manually start collection at area of interest. Profile until the application ends. Generate the report#.nsys-rep in the default location.
Note
If you launch an application and that application and any descendants exit before start is called Nsight Systems will create a fully formed .nsys-rep file containing no data.
Run application, start/stop collection using cudaProfilerStart/Stop
nsys start -c cudaProfilerApi
nsys launch -w true <application> [application-arguments]
Effect: Create interactive CLI process and set it up to begin collecting as soon as a cudaProfileStart() is detected. Launch application for default analysis, sending application output to the terminal. Stop collection at next call to cudaProfilerStop, when the user calls nsys stop, or when the root process terminates. Generate the report#.nsys-rep in the default location.
Note
If you call nsys launch before nsys start -c cudaProfilerApi and the code contains a large number of short duration cudaProfilerStart/Stop pairs, Nsight Systems may be unable to process them correctly, causing a fault. This will be corrected in a future version.
Note
The Nsight Systems CLI does not support multiple calls to the cudaProfilerStart/Stop API at this time.
Run application, start/stop collection using NVTX
nsys start -c nvtx
nsys launch -w true -p MESSAGE@DOMAIN <application> [application-arguments]
Effect: Create interactive CLI process and set it up to begin collecting as soon as an NVTX range with given message in given domain (capture range) is opened. Launch application for default analysis, sending application output to the terminal. Stop collection when all capture ranges are closed, when the user calls nsys stop, or when the root process terminates. Generate the report#.nsys-rep in the default location.
Note
The Nsight Systems CLI only triggers the profiling session for the first capture range.
NVTX capture range can be specified:
Message@Domain: All ranges with given message in given domain are capture ranges. For example:
nsys launch -w true -p profiler@service ./app
This would make the profiling start when the first range with message “profiler” is opened in domain “service”.
Message@*: All ranges with given message in all domains are capture ranges. For example:
nsys launch -w true -p profiler@* ./app
This would make the profiling start when the first range with message “profiler” is opened in any domain.
Message: All ranges with given message in default domain are capture ranges. For example:
nsys launch -w true -p profiler ./app
This would make the profiling start when the first range with message “profiler” is opened in the default domain.
By default only messages, provided by NVTX registered strings are considered to avoid additional overhead. To enable non-registered strings check please launch your application with
NSYS_NVTX_PROFILER_REGISTER_ONLY=0environment:nsys launch -w true -p profiler@service -e NSYS_NVTX_PROFILER_REGISTER_ONLY=0 ./app
Note
The separator ‘@’ can be escaped with backslash ‘\’. If multiple separators without escape character are specified, only the last one is applied, all others are discarded.
Run application, start/stop collection multiple times
The interactive CLI supports multiple sequential collections per launch.
nsys launch <application> [application-arguments]
nsys start
nsys stop
nsys start
nsys stop
nsys shutdown --kill sigkill
Effect: Create interactive CLI and launch an application set up for default analysis. Send application output to the terminal. No data is collected until the start command is executed. Collect data from start until stop requested, generate report#.qstrm in the current working directory. Collect data from second start until the second stop request, generate report#.nsys-rep (incremented by one) in the current working directory. Shutdown the interactive CLI and send sigkill to the target application’s process group.
Note
Calling nsys cancel after nsys start will cancel the collection without generating a report.
Example Stats Command Sequences
Display default statistics
nsys stats report1.nsys-rep
Effect: Export an SQLite file named report1.sqlite from report1.nsys-rep (assuming it does not already exist). Print the default reports in column format to the console.
Note: The following two command sequences should present very similar information:
nsys profile --stats=true <application>
or
nsys profile <application>
nsys stats report1.nsys-rep
Display specific data from a report
nsys stats --report cuda_gpu_trace report1.nsys-rep
Effect: Export an SQLite file named report1.sqlite from report1.nsys-rep (assuming it does not already exist). Print the report generated by the cuda_gpu_trace script to the console in column format.
Generate multiple reports, in multiple formats, output multiple places
nsys stats --report cuda_gpu_trace --report cuda_gpu_kern_sum --report cuda_api_sum --format csv,column --output .,- report1.nsys-rep
Effect: Export an SQLite file named report1.sqlite from report1.nsys-rep (assuming it does not already exist). Generate three reports. The first, the cuda_gpu_trace report, will be output to the file report1_cuda_gpu_trace.csv in CSV format. The other two reports, cuda_gpu_kern_sum and cuda_api_sum, will be output to the console as columns of data. Although three reports were given, only two formats and outputs are given. To reconcile this, both the list of formats and outputs is expanded to match the list of reports by repeating the last element.
Submit report data to a command
nsys stats --report cuda_api_sum --format table \ --output @“grep -E (-|Name|cudaFree” test.sqlite
Effect: Open test.sqlite and run the cuda_api_sum script on that file. Generate table data and feed that into the command grep -E (-|Name|cudaFree). The grep command will filter out everything but the header, formatting, and the cudaFree data, and display the results to the console.
Note: When the output name starts with @, it is defined as a command. The command is run, and the output of the report is piped to the command’s stdin (standard-input). The command’s stdout and stderr remain attached to the console, so any output will be displayed directly to the console.
Be aware there are some limitations in how the command string is parsed. No shell expansions (including *, ?, [], and ~) are supported. The command cannot be piped to another command, nor redirected to a file using shell syntax. The command and command arguments are split on whitespace, and no quotes (within the command syntax) are supported. For commands that require complex command line syntax, it is suggested that the command be put into a shell script file, and the script designated as the output command
Example Output from --stats Option
The nsys stats command can be used post analysis to generate specific or personalized reports. For a default fixed set of summary statistics to be automatically generated, you can use the --stats option with the nsys profile or nsys start command to generate a fixed set of useful summary statistics.
If your run traces CUDA, these include CUDA API, Kernel, and Memory Operation statistics:
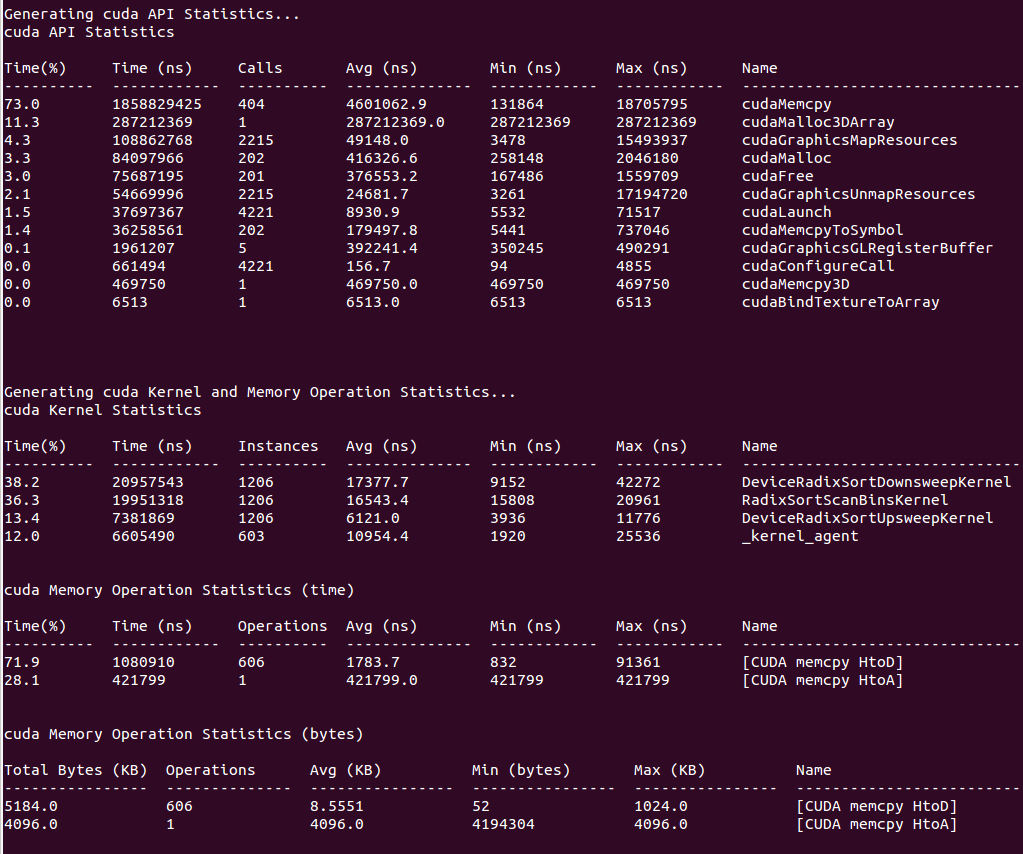
If your run traces OS runtime events or NVTX push-pop ranges:
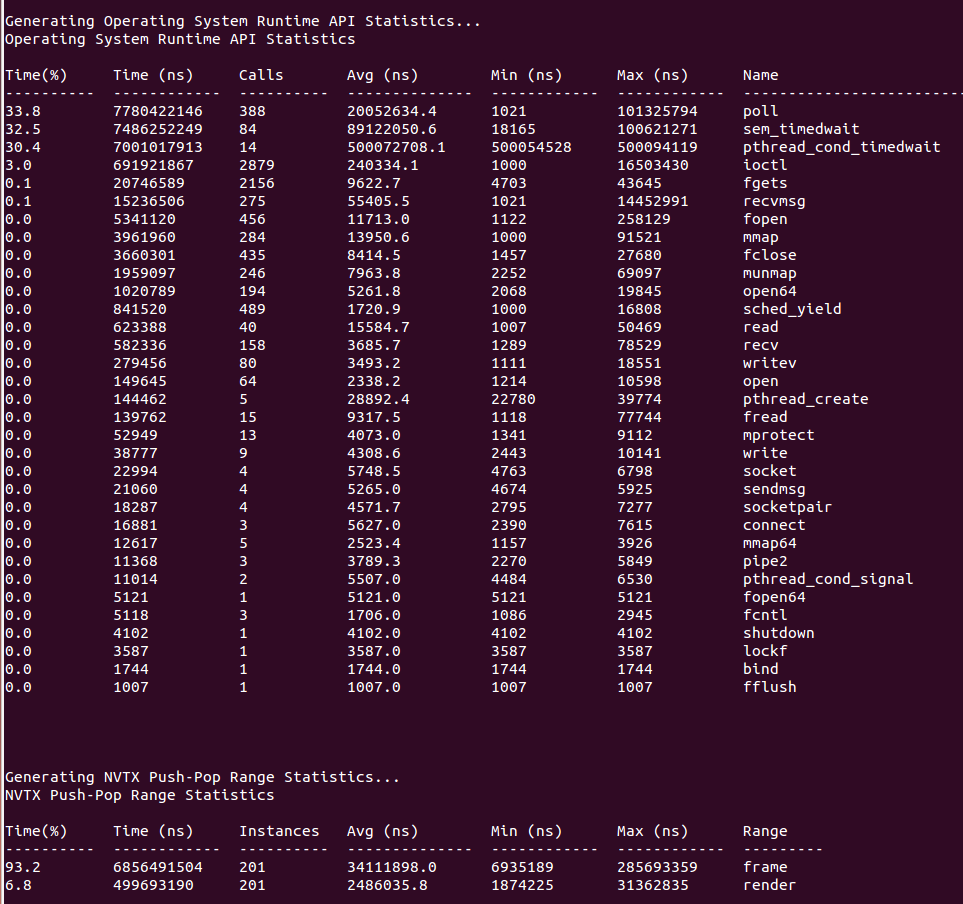
If your run traces graphics debug markers these include DX11 debug markers, DX12 debug markers, Vulkan debug markers or KHR debug markers:
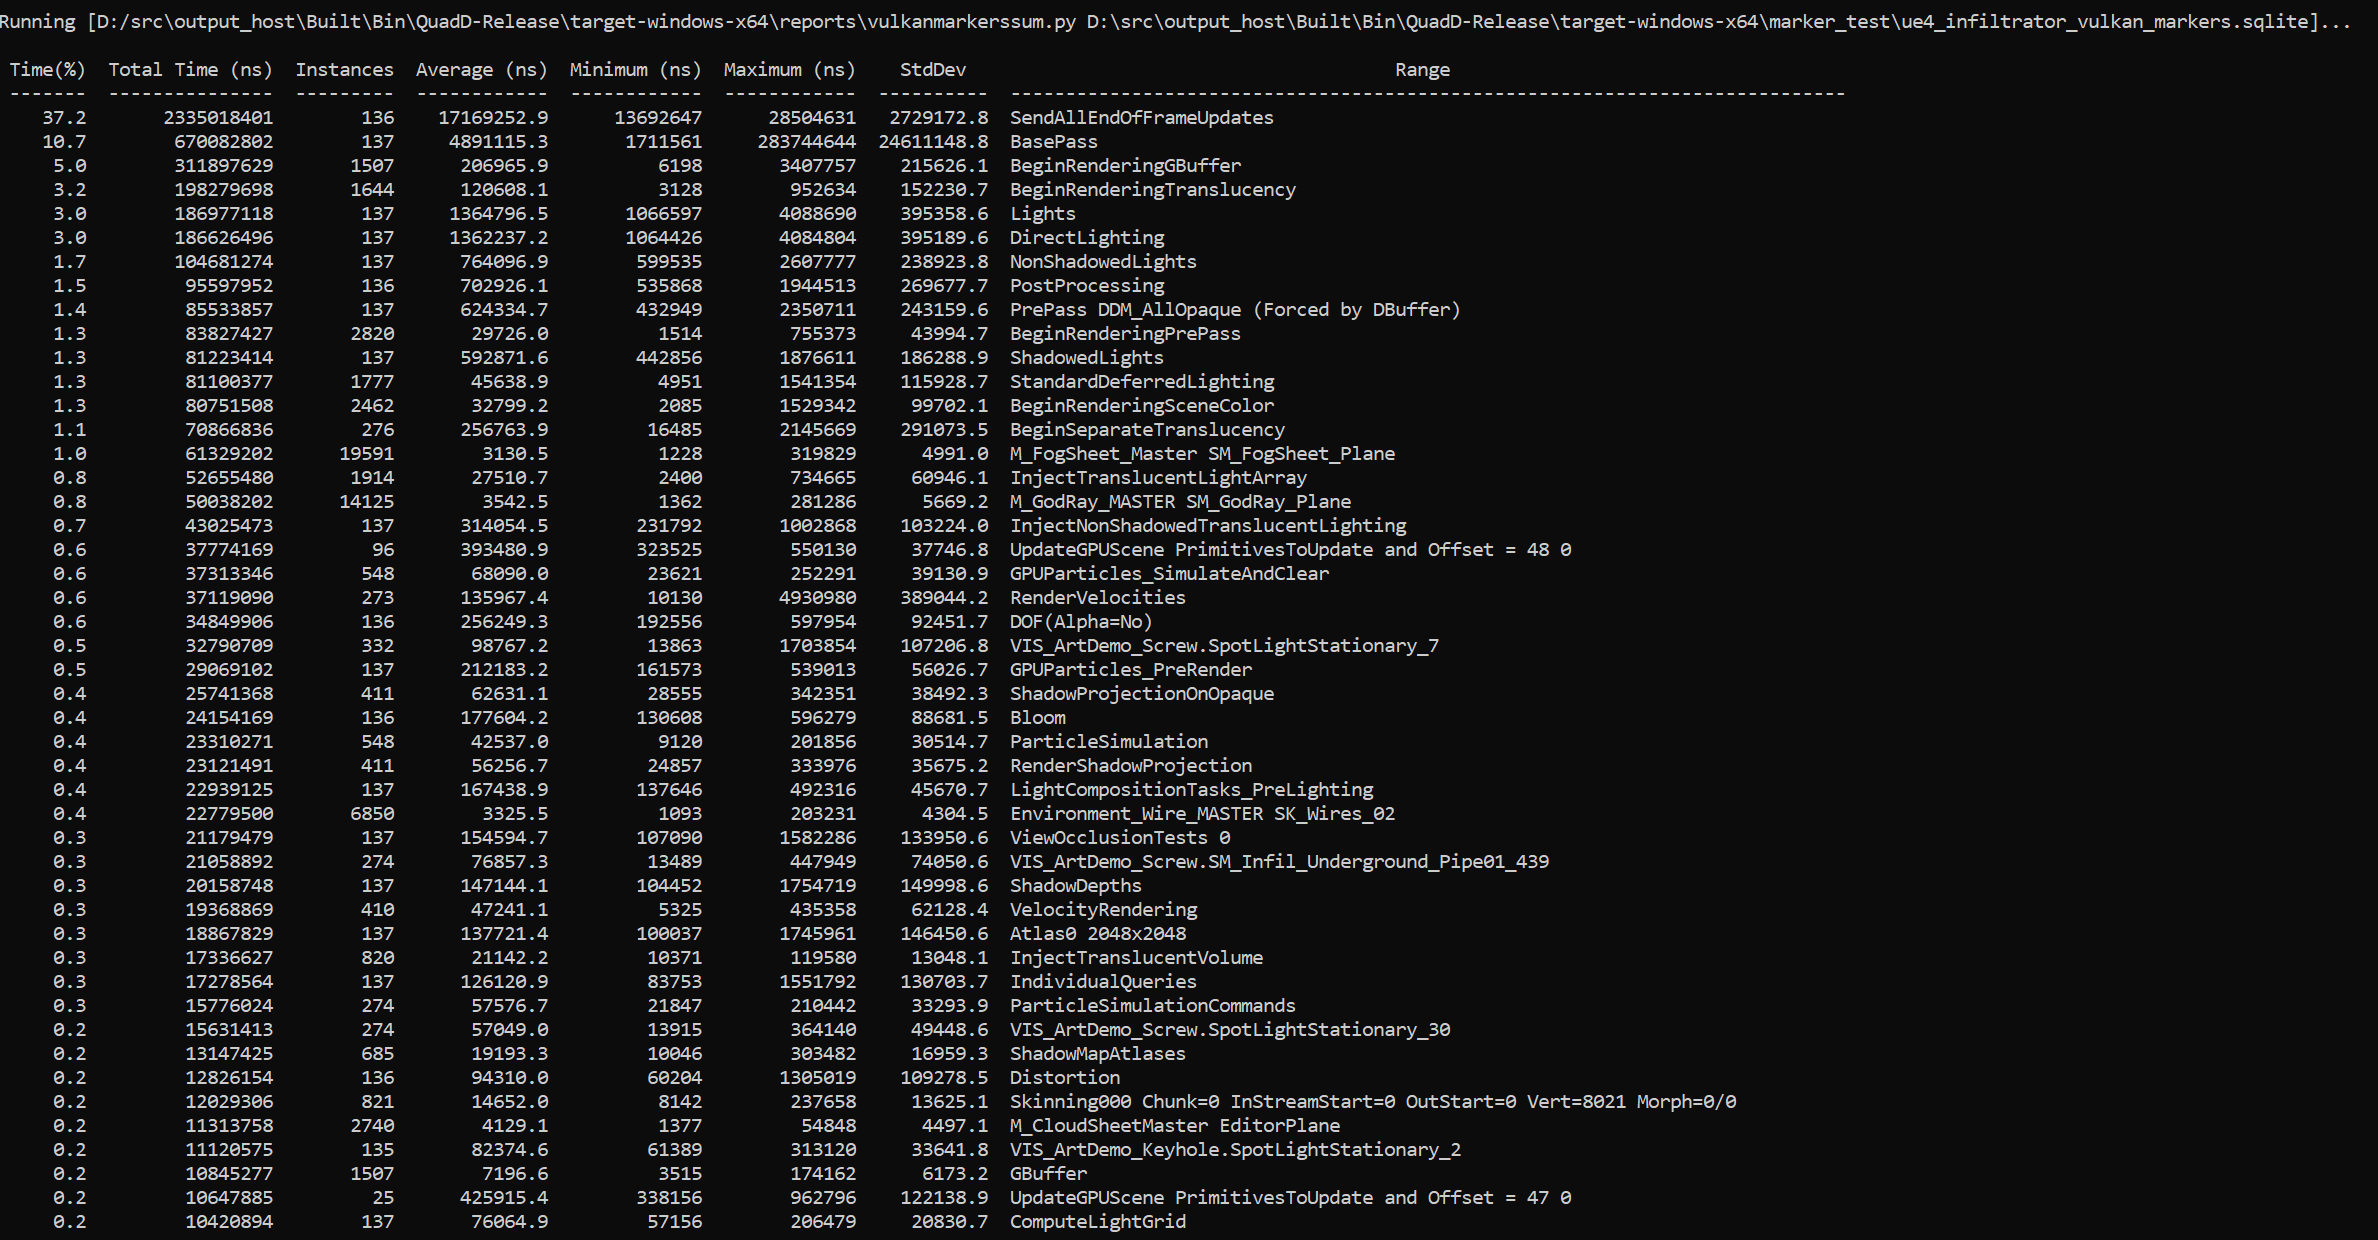
Recipes for these statistics as well as documentation on how to create your own metrics will be available in a future version of the tool.
Importing and Viewing Command Line Results Files
The CLI generates a .qdstrm file. The .qdstrm file is an intermediate result file, not intended for multiple imports. It needs to be processed, either by importing it into the GUI or by using the standalone QdstrmImporter to generate an optimized .nsys-rep file. Use this .nsys-rep file when re-opening the result on the same machine, opening the result on a different machine, or sharing results with teammates.
This version of Nsight Systems will attempt to automatically convert the .qdstrm file to a .nsys-rep file with the same name after the run finishes if the required libraries are available. The ability to turn off auto-conversion will be added in a later version.
Import Into the GUI
The CLI and host GUI versions must match to import a .qdstrm file successfully. The host GUI is backward compatible only with .nsys-rep files.
Copy the .qdstrm file you are interested in viewing to a system where the Nsight Systems host GUI is installed. Launch the Nsight Systems GUI. Select File->Import… and choose the .qdstrm file you wish to open.
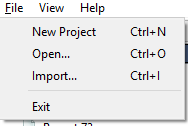
The import of really large, multi-gigabyte, .qdstrm files may take up all of the memory on the host computer and lock up the system. This will be fixed in a later version.
Importing Windows ETL files
For Windows targets, ETL files captured with Xperf or the log.cmd command supplied with GPUView in the Windows Performance Toolkit can be imported to create reports as if they were captured with Nsight Systems’s “WDDM trace” and “Custom ETW trace” features. Simply choose the .etl file from the Import dialog to convert it to a .nsys-rep file.
Create .nsys-rep Using QdstrmImporter
The CLI and QdstrmImporter versions must match to convert a .qdstrm file into a .nsys-rep file. This .nsys-rep file can then be opened in the same version or more recent versions of the GUI.
To run QdstrmImporter on the host system, find the QdstrmImporter binary in the Host-x86_64 directory in your installation. QdstrmImporter is available for all host platforms. See options below.
To run QdstrmImporter on the target system, copy the Linux Host-x86_64 directory to the target Linux system or install Nsight Systems for Linux host directly on the target. The Windows or macOS host QdstrmImporter will not work on a Linux Target. See options below.
Short |
Long |
Parameter |
Description |
|---|---|---|---|
-h |
|
Help message providing information about available options and their parameters. |
|
-v |
|
Output QdstrmImporter version information |
|
-i |
|
filename or path |
Import .qdstrm file from this location. |
-o |
|
filename or path |
Provide a different file name or path for the resulting .nsys-rep file. Default is the same name and path as the .qdstrm file |
Using the CLI to Analyze MPI Codes
Tracing MPI API calls
The Nsight Systems CLI has built-in API trace support for Open MPI and MPICH based MPI implementations via --trace=mpi. It traces a subset of the MPI API, including blocking and non-blocking point-to-point and collective communication as well as MPI one-sided communication, file I/O and pack operations (see MPI functions traced).
If you require more control over the list of traced APIs or if you are using a different MPI implementation, you can use the NVTX wrappers for MPI on GitHub. Choose an NVTX domain name other than “MPI”, since it is filtered out by Nsight Systems when MPI tracing is not enabled. Use the NVTX-instrumented MPI wrapper library as follows:
nsys profile -e LD_PRELOAD=${PATH_TO_YOUR_NVTX_MPI_LIB} --trace=nvtx
Using the CLI to Profile Applications Launched with mpirun
The Nsight Systems CLI supports concurrent use of the nsys profile command. Each instance will create a separate report file. You cannot use multiple instances of the interactive CLI concurrently, or use the interactive CLI concurrently with nsys profile in this version.
Nsight Systems can be used to profile applications launched with mpirun or mpiexec. Since concurrent use of the CLI is supported only when using the nsys profile command, Nsight Systems cannot profile each node from the GUI or from the interactive CLI.
Profile all MPI ranks on a single node:nsys can be prefixed before mpirun/mpiexec. Only a single report file will be created.
nsys [nsys options] mpirun [mpirun options]
Profile multi-node runs:nsys profile has to be prefixed before the program to be profiled. One report file will be created for each MPI rank. This works also for single-node runs.
mpirun [mpirun options] nsys profile [nsys options]
You can use %q{OMPI_COMM_WORLD_RANK} (Open MPI), %q{PMI_RANK} (MPICH) or %q{SLURM_PROCID} (Slurm) with the -o option to appropriately name the report files.
Profile a single MPI process or a subset of MPI processes: Use a wrapper script similar to the following script (called “profile_rank0.sh”).
#!/bin/bash

# Use $PMI_RANK for MPICH and $SLURM_PROCID with srun.
if [ $OMPI_COMM_WORLD_RANK -eq 0 ]; then
  nsys profile -e NSYS_MPI_STORE_TEAMS_PER_RANK=1 -t mpi "$@"
else
  "$@"
fi
The script runs nsys on rank 0 only. Add appropriate profiling options to the script and execute it with mpirun [mpirun options] ./profile_rank0.sh ./myapp [app options].
Note
If only a subset of MPI ranks is profiled, set the environment variable NSYS_MPI_STORE_TEAMS_PER_RANK=1 to store all members of custom MPI communicators per MPI rank. Otherwise, the execution might hang or fail with an MPI error.
Avoid redundant GPU and NIC metrics collection: If multiple instances of nsys profile are executed concurrently on the same node and GPU and/or NIC metrics collection is enabled, each process will collect metrics for all available NICs and tries to collect GPU metrics for the specified devices. This can be avoided with a simple bash script similar to the following:
#!/bin/bash

# Use $SLURM_LOCALID with srun.
if [ $OMPI_COMM_WORLD_LOCAL_RANK -eq 0 ]; then
  nsys profile --nic-metrics=true --gpu-metrics-device=all "$@"
else
  nsys profile "$@"
fi
This above script will collect NIC and GPU metrics only for one rank, the node-local rank 0. Alternatively, if one rank per GPU is used, the GPU metrics devices can be specified based on the node-local rank in a wrapper script as follows:
#!/bin/bash

# Use $SLURM_LOCALID with srun.
nsys profile -e CUDA_VISIBLE_DEVICES=${OMPI_COMM_WORLD_LOCAL_RANK} \
  --gpu-metrics-device=${OMPI_COMM_WORLD_LOCAL_RANK} "$@"
Profiling from the GUI
Profiling Linux Targets from the GUI
Connecting to the Target Device
Nsight Systems provides a simple interface to profile on localhost or manage multiple connections to Linux or Windows based devices via SSH. The network connections manager can be launched through the device selection dropdown:
On x86_64:
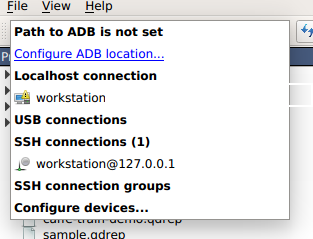
On Tegra:
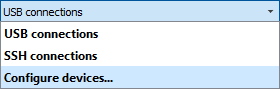
The dialog has simple controls that allow adding, removing, and modifying connections:
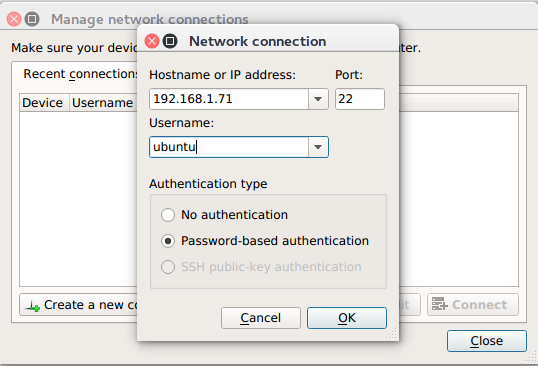
Security notice: SSH is only used to establish the initial connection to a target device, perform checks, and upload necessary files. The actual profiling commands and data are transferred through a raw, unencrypted socket. Nsight Systems should not be used in a network setup where attacker-in-the-middle attack is possible, or where untrusted parties may have network access to the target device.
While connecting to the target device, you will be prompted to input the user’s password. Please note that if you choose to remember the password, it will be stored in plain text in the configuration file on the host. Stored passwords are bound to the public key fingerprint of the remote device.
The No authentication option is useful for devices configured for passwordless login using root username. To enable such a configuration, edit the file /etc/ssh/sshd_config on the target and specify the following option:
PermitRootLogin yes
Then set empty password using passwd and restart the SSH service with service ssh restart.
Open ports: The Nsight Systems daemon requires port 22 and port 45555 to be open for listening. You can confirm that these ports are open with the following command:
sudo firewall-cmd --list-ports --permanent
sudo firewall-cmd --reload
To open a port use the following command, skip --permanent option to open only for this session:
sudo firewall-cmd --permanent --add-port 45555/tcp
sudo firewall-cmd --reload
Likewise, if you are running on a cloud system, you must open port 22 and port 45555 for ingress.
Kernel Version Number - To check for the version number of the kernel support of Nsight Systems on a target device, run the following command on the remote device:
cat /proc/quadd/version
Minimal supported version is 1.82.
Additionally, presence of Netcat command (nc) is required on the target device. For example, on Ubuntu this package can be installed using the following command:
sudo apt-get install netcat-openbsd
System-Wide Profiling Options
Target Sampling Options
Target sampling behavior is somewhat different for Nsight Systems Workstation Edition and Nsight Systems Embedded Platforms Edition.
Hotkey Trace Start/Stop
Nsight Systems Workstation Edition can use hotkeys to control profiling. Press the hotkey to start and/or stop a trace session from within the target application’s graphic window. This is useful when tracing games and graphic applications that use fullscreen display. In these scenarios switching to Nsight Systems’ UI would unnecessarily introduce the window manager’s footprint into the trace. To enable the use of Hotkey check the Hotkey checkbox in the project settings page:
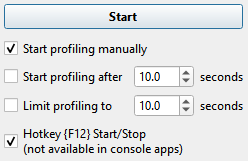
The default hotkey is F12.
Launching Processes
Nsight Systems can launch new processes for profiling on target devices. Profiler ensures that all environment variables are set correctly to successfully collect trace information
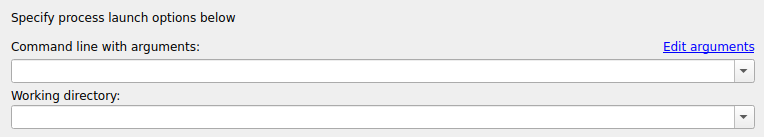
The Edit arguments… link will open an editor window, where every command line argument is edited on a separate line. This is convenient when arguments contain spaces or quotes.
Profiling Windows Targets from the GUI
Profiling on Windows devices is similar to the profiling on Linux devices. Please refer to the Profiling Linux Targets from the GUI section for the detailed documentation and connection information. The major differences on the platforms are listed below:
Remoting to a Windows Based Machine
To perform remote profiling to a target Windows based machines, install and configure an OpenSSH Server on the target machine.
Hotkey Trace Start/Stop
Nsight Systems Workstation Edition can use hotkeys to control profiling. Press the hotkey to start and/or stop a trace session from within the target application’s graphic window. This is useful when tracing games and graphic applications that use fullscreen display. In these scenarios switching to Nsight Systems’ UI would unnecessarily introduce the window manager’s footprint into the trace. To enable the use of Hotkey check the Hotkey checkbox in the project settings page:
The default hotkey is F12.
Changing the Default Hotkey Binding - A different hotkey binding can be configured by setting the HotKeyIntValue configuration field in the config.ini file.
Set the decimal numeric identifier of the hotkey you would like to use for triggering start/stop from the target app graphics window. The default value is 123 which corresponds to 0x7B, or the F12 key.
Virtual key identifiers are detailed in MSDN’s Virtual-Key Codes.
Note that you must convert the hexadecimal values detailed in this page to their decimal counterpart before using them in the file. For example, to use the F1 key as a start/stop trace hotkey, use the following settings in the config.ini file:
HotKeyIntValue=112
Target Sampling Options on Windows
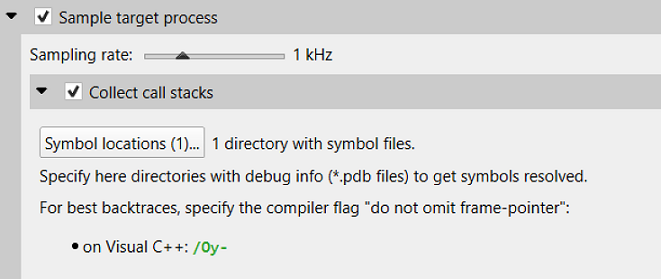
Nsight Systems can sample one process tree. Sampling here means interrupting each processor periodically. The sampling rate is defined in the project settings and is either 100Hz, 1KHz (default value), 2Khz, 4KHz, or 8KHz.
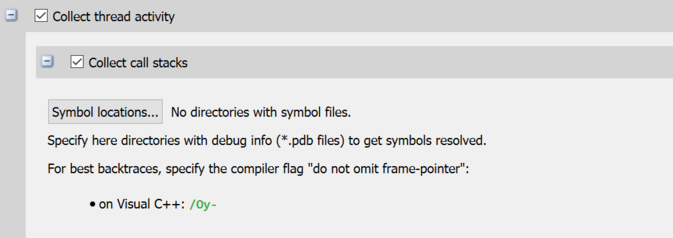
On Windows, Nsight Systems can collect thread activity of one process tree. Collecting thread activity means that each thread context switch event is logged and (optionally) a backtrace is collected at the point that the thread is scheduled back for execution. Thread states are displayed on the timeline.
If it was collected, the thread backtrace is displayed when hovering over a region where the thread execution is blocked.
Symbol Locations
Symbol resolution happens on host, and therefore does not affect performance of profiling on the target.
Press the Symbol locations… button to open the Configure debug symbols location dialog.
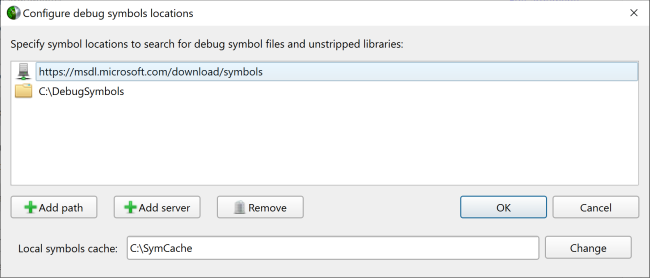
Use this dialog to specify:
Paths of PDB files
Symbols servers
The location of the local symbol cache
To use a symbol server:
Install Debugging Tools for Windows, a part of the Windows 10 SDK.
Add the symbol server URL using the Add Server button.
Information about Microsoft’s public symbol server, which enables getting Windows operating system related debug symbols can be found here.
Profiling QNX Targets from the GUI
Profiling on QNX devices is similar to the profiling on Linux devices. Please refer to the Profiling Linux Targets from the GUI section for the detailed documentation. The major differences on the platforms are listed below:
Backtrace sampling is not supported. Instead backtraces are collected for long OS runtime libraries calls. Please refer to the OS Runtime Libraries Trace section for the detailed documentation.
CUDA support is limited to CUDA 9.0+
Filesystem on QNX device might be mounted read-only. In that case Nsight Systems is not able to install target-side binaries, required to run the profiling session. Please make sure that target filesystem is writable before connecting to QNX target. For example, make sure the following command works:
echo XX > /xx && ls -l /xx
Container Support on Linux Servers
Collecting data within a Docker container
While examples in this section use Docker container semantics, other containers work much the same.
The following information assumes the reader is knowledgeable regarding Docker containers. For further information about Docker use in general, see the Docker documentation.
We strongly recommend using the CLI to profile in a container. Best container practice is to split services across containers when they do not require colocation. The Nsight Systems GUI is not needed to profile and brings in many dependencies, so the CLI is recommended. If you wish the GUI can be in a separate side-car container you use after to view your report. All you need is a shared folder between the containers. See section on GUI VNC Container below for more information.
Enable Docker Collection
When starting the Docker to perform a Nsight Systems collection, additional steps are required to enable the perf_event_open system call. This is required in order to utilize the Linux kernel’s perf subsystem which provides sampling information to Nsight Systems.
There are three ways to enable the perf_event_open syscall. You can enable it by using the --privileged=true switch, adding --cap-add=SYS_ADMIN switch to your docker run command file, or you can enable it by setting the seccomp security profile if your system meets the requirements.
Secure computing mode (seccomp) is a feature of the Linux kernel that can be used to restrict an application’s access. This feature is available only if the kernel is enabled with seccomp support. To check for seccomp support:
$ grep CONFIG_SECCOMP= /boot/config-$(uname -r)
The official Docker documentation says:
"Seccomp profiles require seccomp 2.2.1 which is not available on Ubuntu 14.04, Debian Wheezy, or Debian Jessie. To use seccomp on these distributions, you must download the latest static Linux binaries (rather than packages)."
Download the default seccomp profile file, default.json, relevant to your Docker version. If perf_event_open is already listed in the file as guarded by CAP_SYS_ADMIN, then remove the perf_event_open line. Add the following lines under “syscalls” and save the resulting file as default_with_perf.json.
{
    "name": "perf_event_open",
    "action": "SCMP_ACT_ALLOW",
    "args": []
},
Then you will be able to use the following switch when starting the Docker to apply the new seccomp profile.
--security-opt seccomp=default_with_perf.json
Launch Docker Collection
Here is an example command that has been used to launch a Docker for testing with Nsight Systems:
sudo nvidia-docker run --network=host --security-opt seccomp=default_with_perf.json --rm -ti caffe-demo2 bash
There is a known issue where Docker collections terminate prematurely with older versions of the driver and the CUDA Toolkit. If collection is ending unexpectedly, please update to the latest versions.
After the Docker has been started, use the Nsight Systems CLI to launch a collection within the Docker. The resulting .qdstrm file can be imported into the Nsight Systems host like any other CLI result.
GUI VNC container
Nsight Systems provides a build script to build a self isolated Docker container with the Nsight Systems GUI and VNC server.
You can find the build.py script in the host-linux-x64/Scripts/VncContainer directory (or similar on other architectures) under your Nsight Systems installation directory. You will need to have Docker, and Python 3.5 or later.
Available Parameters
Short Name |
Full Name |
Description |
|---|---|---|
|
(optional) Default password for VNC access (at least 6 characters). If it is specified and empty - will be asked during the build. Can be changed when running a container. |
|
-aba |
|
(optional) Additional arguments, which will be passed to the “docker build” command. |
-hd |
|
(optional) The directory with Nsight Systems host binaries (with GUI). |
-td |
|
(optional, repeatable) The directory with Nsight Systems target binaries (can be specified multiple times). |
|
(optional) Use TigerVNC instead of x11vnc. |
|
|
(optional) Install noVNC in the Docker container for HTTP access. |
|
|
(optional) Install xRDP in the Docker for RDP access. |
|
|
(optional) Default VNC server resolution in the format WidthxHeight (default 1920x1080). |
|
|
(optional) The directory to save temporary files (with the write access for the current user). By default, script or tmp directory will be used. |
Ports
These ports can be published from the container to provide access to the Docker container:
Port |
Purpose |
Condition |
|---|---|---|
TCP 5900 |
Port for VNC access |
|
TCP 80 (optional) |
Port for HTTP access to noVNC server |
Container is build with |
TCP 3389 (optional) |
Port for RDP access |
Container is build with |
Volumes
Docker folder |
Purpose |
Description |
|---|---|---|
/mnt/host |
Root path for shared folders |
Folder owned by the Docker user (inner content can be accessed from Nsight Systems GUI) |
/mnt/host/Projects |
Folder with projects and reports, created by Nsight Systems UI in container |
|
/mnt/host/logs |
Folder with inner services logs |
May be useful to send reports to developers |
Environment variables
Variable Name |
Purpose |
|---|---|
VNC_PASSWORD |
Password for VNC access (at least 6 characters) |
NSYS_WINDOW_WIDTH |
Width of VNC server display (in pixels) |
NSYS_WINDOW_HEIGHT |
Height of VNC server display (in pixels) |
Examples
With VNC access on port 5916:
sudo docker run -p 5916:5900/tcp -ti nsys-ui-vnc:1.0
With VNC access on port 5916 and HTTP access on port 8080:
sudo docker run -p 5916:5900/tcp -p 8080:80/tcp -ti nsys-ui-vnc:1.0
With VNC access on port 5916, HTTP access on port 8080 and RDP access on port 33890:
sudo docker run -p 5916:5900/tcp -p 8080:80/tcp -p 33890:3389/tcp -ti nsys-ui-vnc:1.0
With VNC access on port 5916, shared “HOME” folder from the host, VNC server resolution 3840x2160, and custom VNC password
sudo docker run -p 5916:5900/tcp -v $HOME:/mnt/host/home -e NSYS_WINDOW_WIDTH=3840 -e NSYS_WINDOW_HEIGHT=2160 -e VNC_PASSWORD=7654321 -ti nsys-ui-vnc:1.0
With VNC access on port 5916, shared “HOME” folder from the host, and the projects folder to access reports created by Nsight Systems GUI in container
sudo docker run -p 5916:5900/tcp -v $HOME:/mnt/host/home -v /opt/NsysProjects:/mnt/host/Projects -ti nsys-ui-vnc:1.0
GUI WebRTC container
Instructions for creating a self-isolated Docker container for accessing Nsight Systems through browser using WebRTC.
Prerequisites
x86_64 Linux
Internet access for downloading Ubuntu packages inside the container.
Build
To build the docker container use the follwing command:
$ sudo ./setup/build-docker.sh
The above command will create a docker image, which can be run using ./start-nsys.sh
Build environment variables
Following environment variables can be used to configure build parameters.
Variable |
Description |
Default Value |
|---|---|---|
USERNAME |
User name for NVIDIA Nsight Systems GUI. Password can be set on container start |
nvidia |
Additional docker build arguments
Additional Docker Build arguments may be passed to the build-docker.sh. For example:
$ sudo ./setup/build-docker.sh --network=host
Run
To run the docker container:
$ sudo ./start-nsys.sh
At the end of start-nsys.sh it will provide you with a URL to connect to the WebRTC client. It will look something like http://$HOST_IP:8080/. You can use this address in your browser to access Nsight Systems GUI interface.
Additional docker run arguments
Additional Docker Run arguments may be passed to the start-nsys.sh. These argument can be used to mount host directories with Nsight Systems reports to the docker container. For example:
$ sudo ./start-nsys.sh -v $HOME:/mnt/host/home -v /myawesomereports:/mnt/host/myawesomereports
Runtime environment variables
Runtime environment variables can be used to configure runtime parameters.
Variable |
Description |
Default Value |
|---|---|---|
PASSWORD |
Password for WebUI. Username can be set only on the build step |
nvidia |
HOST_IP |
IP of the server that will be sent to client. This IP should be accessible from the client side to establish client/server connection. |
The IP address of the first available network interface. |
HTTP_PORT |
Port for HTTP access to Nsight Systems user interface. |
8080 |
CONNECTION_UDP_PORT |
UDP port which will be used for handling the incoming connection. |
8081 |
FALLBACK_CONNECTION_TCP_PORT |
TCP port which will be used for handling the incoming connection in case of connection failure over TCP (can be the same port number as CONNECTION_UDP_PORT). |
8081 |
SCREEN |
Resolution and refresh rate of the screen used for rendering. |
1920x1080@30 |
USE_OPENH264_BUILD_CACHE |
Setting this option to false disables caching of openh264 binaries. It should be reenabled on each container start. |
true |
OPENH264_BUILD_CACHE_VOLUME_NAME |
Directory or docker volume name for openh264 binaries cache. |
nvidia-devtools-streamer-openh264-volume |
Video encoding
By default, the container uses the VP8 codec for video streaming. For an improved experience, the H.264 codec can be enabled.
If internet is available to download the required libraries:
$ sudo docker exec nvidia-devtools-streamer /setup/enable-h264-streaming.sh
If USE_OPENH264_BUILD_CACHE was not set to false, openh264 binaries will be cached in OPENH264_BUILD_CACHE_VOLUME_NAME and H.264 codec will be used during future launches of the container.
Currently, only software encoding is supported.
If internet is not available:
$ sudo -- sh -c 'MY_IMAGE_NAME=my-openh264-nsys-streamer:1.0 USE_OPENH264_BUILD_CACHE=false ./start-nsys.sh && docker exec nvidia-devtools-streamer /setup/enable-h264-streaming.sh && docker commit nvidia-devtools-streamer $MY_IMAGE_NAME && docker save -o my-openh264-nsys-streamer.tar $MY_IMAGE_NAME'
As a result,
my-openh264-nsys-streamer.tarwill contain the image with enabled H.264 codec. This file should be transferred to the target machine without internet access. Then, on a machine without internet access, the container can be started using the following command:$ sudo -- sh -c 'CONTAINER_IMAGE=my-openh264-nsys-streamer:1.0 USE_OPENH264_BUILD_CACHE=false docker load -i my-openh264-nsys-streamer.tar && ./start-nsys.sh'
Volumes
Docker folder |
Purpose |
Description |
|---|---|---|
/mnt/host/logs |
Folder with inner services logs |
May be useful to send reports to NVIDIA developer |
Example
To run the container on 10.10.10.10 network interface, using 8000 HTTP port, 8888 connection port, without caching openh264 binaries:
$ sudo HOST_IP=10.10.10.10 HTTP_PORT=8000 CONNECTION_UDP_PORT=8888 USE_OPENH264_BUILD_CACHE=false ./start-nsys.sh
Migrating from NVIDIA nvprof
Using the Nsight Systems CLI nvprof Command
The nvprof command of the Nsight Systems CLI is intended to help former nvprof users transition to nsys. Many nvprof switches are not supported by nsys, often because they are now part of NVIDIA Nsight Compute.
The full nvprof documentation can be found at https://docs.nvidia.com/cuda/profiler-users-guide.
The nvprof transition guide for Nsight Compute can be found at https://docs.nvidia.com/nsight-compute/NsightComputeCli/index.html#nvprof-guide.
Any nvprof switch not listed below is not supported by the nsys nvprof command. No additional nsys functionality is available through this command. New features will not be added to this command in the future.
CLI nvprof Command Switch Options
After choosing the nvprof command switch, the following options are available. When you are ready to move to using Nsight Systems CLI directly, see Command Line Options documentation for the nsys switch(es) given below. Note that the nsys implementation and output may vary from nvprof.
Usage.
nsys nvprof [options]
Switch |
Parameters (Default in Bold) |
nsys switch |
Switch Description |
|---|---|---|---|
|
off, openmpi, mpich |
|
Automatically annotate MPI calls with NVTX markers. Specify the MPI implementation installed on your machine. Only OpenMPI and MPICH implementations are supported. |
|
on, off |
|
Collect information about CPU thread API activity. |
|
none, runtime, driver,all |
|
Turn on/off CUDA runtime and driver API tracing. For Nsight Systems there is no separate CUDA runtime and CUDA driver trace, so selecting |
|
on, off |
if off use |
Enable/disable profiling from the start of the application. If disabled, the application can use {cu,cuda}Profiler{Start,Stop} to turn on/off profiling. |
|
<nanoseconds> default=0 |
|
If greater than 0, stop the collection and kill the launched application after timeout seconds. nvprof started counting when the CUDA driver is initialized. nsys starts counting immediately. |
|
on, off |
|
Turn on/off CPU profiling |
|
on, off |
|
Enable/disable recording information from the OpenACC profiling interface. Note: OpenACC profiling interface depends on the presence of the OpenACC runtime. For supported runtimes, see CUDA Trace section of documentation |
|
<filename> |
|
Export named file to be imported or opened in the Nsight Systems GUI. %q{ENV_VAR} in string will be replaced with the set value of the environment variable. If not set this is an error. %h in the string is replaced with the system hostname. %% in the string is replaced with %. %p in the string is not supported currently. Any other character following % is illegal. The default is report1, with the number incrementing to avoid overwriting files, in users working directory. |
|
|
Force overwriting all output files with same name. |
|
|
|
Print Nsight Systems CLI help |
|
|
|
Print Nsight Systems CLI version information |
Next Steps
NVIDIA Visual Profiler (NVVP) and NVIDIA nvprof are deprecated. New GPUs and features will not be supported by those tools. We encourage you to make the move to Nsight Systems now. For additional information, suggestions, and rationale, see the blog series in Other Resources.
Direct3D Trace
Nsight Systems has the ability to trace both the Direct3D 11 API and the Direct3D 12 API on Windows targets.
D3D11 API trace
Nsight Systems can capture information about Direct3D 11 API calls made by the profiled process. This includes capturing the execution time of D3D11 API functions, performance markers, and frame durations.
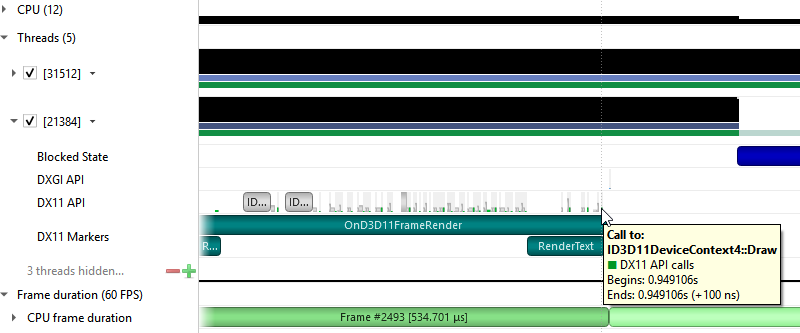
SLI Trace
Trace SLI queries and peer-to-peer transfers of D3D11 applications. Requires SLI hardware and an active SLI profile definition in the NVIDIA console.
D3D12 API Trace
Direct3D 12 is a low-overhead 3D graphics and compute API for Microsoft Windows. Information about Direct3D 12 can be found at the Direct3D 12 Programming Guide.
Nsight Systems can capture information about Direct3D 12 usage by the profiled process. This includes capturing the execution time of D3D12 API functions, corresponding workloads executed on the GPU, performance markers, and frame durations.
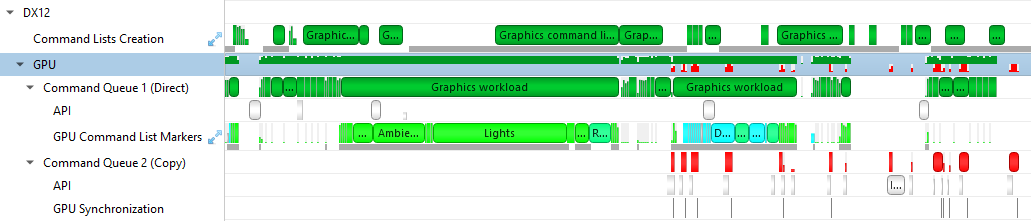
The Command List Creation row displays time periods when command lists were being created. This enables developers to improve their application’s multi-threaded command list creation. Command list creation time period is measured between the call to ID3D12GraphicsCommandList::Reset and the call to ID3D12GraphicsCommandList::Close.
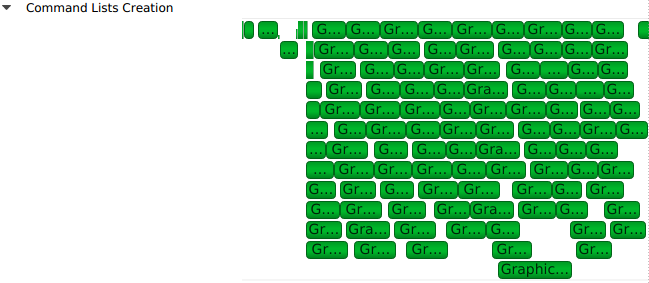
The GPU row shows a compressed view of the D3D12 queue activity, color-coded by the queue type. Expanding it will show the individual queues and their corresponding API calls.
A Command Queue row is displayed for each D3D12 command queue created by the profiled application. The row’s header displays the queue’s running index and its type (Direct, Compute, Copy).
The DX12 API Memory Ops row displays all API memory operations and non-persistent resource mappings. Event ranges in the row are color-coded by the heap type they belong to (Default, Readback, Upload, Custom, or CPU-Visible VRAM), with usage warnings highlighted in yellow. A breakdown of the operations can be found by expanding the row to show rows for each individual heap type.
The following operations and warnings are shown:
Calls to
ID3D12Device::CreateCommittedResource,ID3D12Device4::CreateCommittedResource1, andID3D12Device8::CreateCommittedResource2A warning will be reported if
D3D12_HEAP_FLAG_CREATE_NOT_ZEROEDis not set in the method’sHeapFlagsparameter
Calls to
ID3D12Device::CreateHeapandID3D12Device4::CreateHeap1A warning will be reported if
D3D12_HEAP_FLAG_CREATE_NOT_ZEROEDis not set in theFlagsfield of the method’spDescparameter
Calls to
ID3D12Resource::ReadFromSubResourceA warning will be reported if the read is to a
D3D12_CPU_PAGE_PROPERTY_WRITE_COMBINECPU page or from aD3D12_HEAP_TYPE_UPLOADresource
Calls to
ID3D12Resource::WriteToSubResourceA warning will be reported if the write is from a
D3D12_CPU_PAGE_PROPERTY_WRITE_BACKCPU page or to aD3D12_HEAP_TYPE_READBACKresource
Calls to
ID3D12Resource::MapandID3D12Resource::Unmapwill be matched into [Map, Unmap] ranges for non-persistent mappings. If a mapping range is nested, only the most external range (reference count = 1) will be shown.
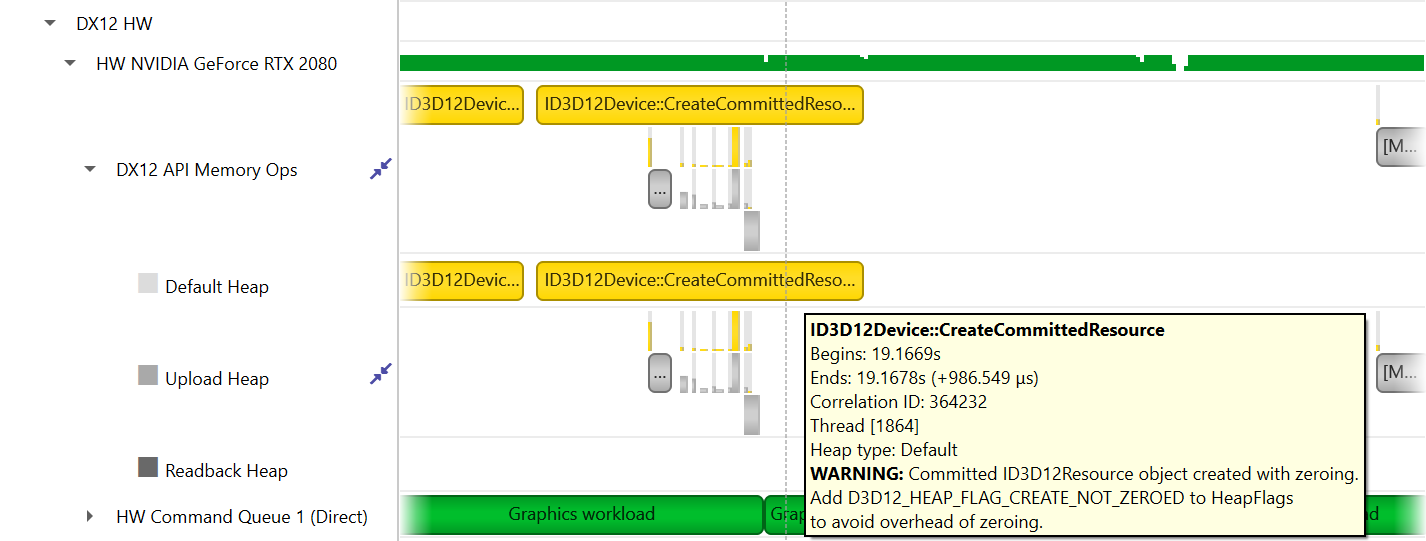
The API row displays time periods where ID3D12CommandQueue::ExecuteCommandLists was called. The GPU Workload row displays time periods where workloads were executed by the GPU. The workload’s type (Graphics, Compute, Copy, etc.) is displayed on the bar representing the workload’s GPU execution.
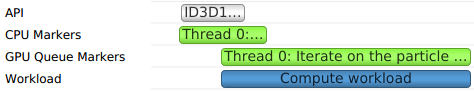
In addition, you can see the PIX command queue CPU-side performance markers, GPU-side performance markers and the GPU Command List performance markers, each in their row.


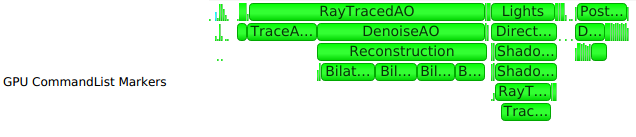
Clicking on a GPU workload highlights the corresponding ID3D12CommandQueue::ExecuteCommandLists, ID3D12GraphicsCommandList::Reset and ID3D12GraphicsCommandList::Close API calls, and vice versa.
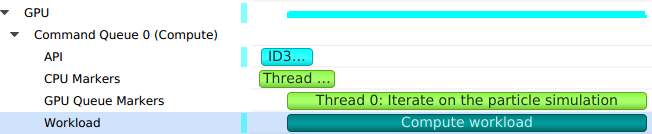
Detecting which CPU thread was blocked by a fence can be difficult in complex apps that run tens of CPU threads. The timeline view displays the 3 operations involved:
The CPU thread pushing a signal command and fence value into the command queue. This is displayed on the DX12 Synchronization sub-row of the calling thread.
The GPU executing that command, setting the fence value and signaling the fence. This is displayed on the GPU Queue Synchronization sub-row.
The CPU thread calling a Win32 wait API to block-wait until the fence is signaled. This is displayed on the Thread’s OS runtime libraries row.
Clicking one of these will highlight it and the corresponding other two calls.
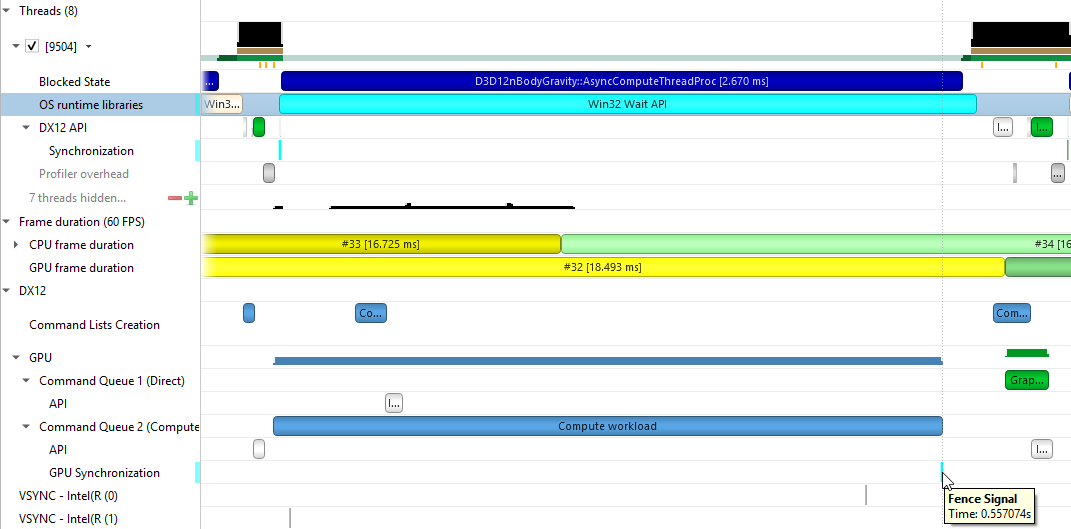
WDDM Queues
The Windows Display Driver Model (WDDM) architecture uses queues to send work packets from the CPU to the GPU. Each D3D device in each process is associated with one or more contexts. Graphics, compute, and copy commands that the profiled application uses are associated with a context, batched in a command buffer, and pushed into the relevant queue associated with that context.
Nsight Systems can capture the state of these queues during the trace session.
Enabling the “Collect additional range of ETW events” option will also capture extended DxgKrnl events from the Microsoft-Windows-DxgKrnl provider, such as context status, allocations, sync wait, signal events, etc.
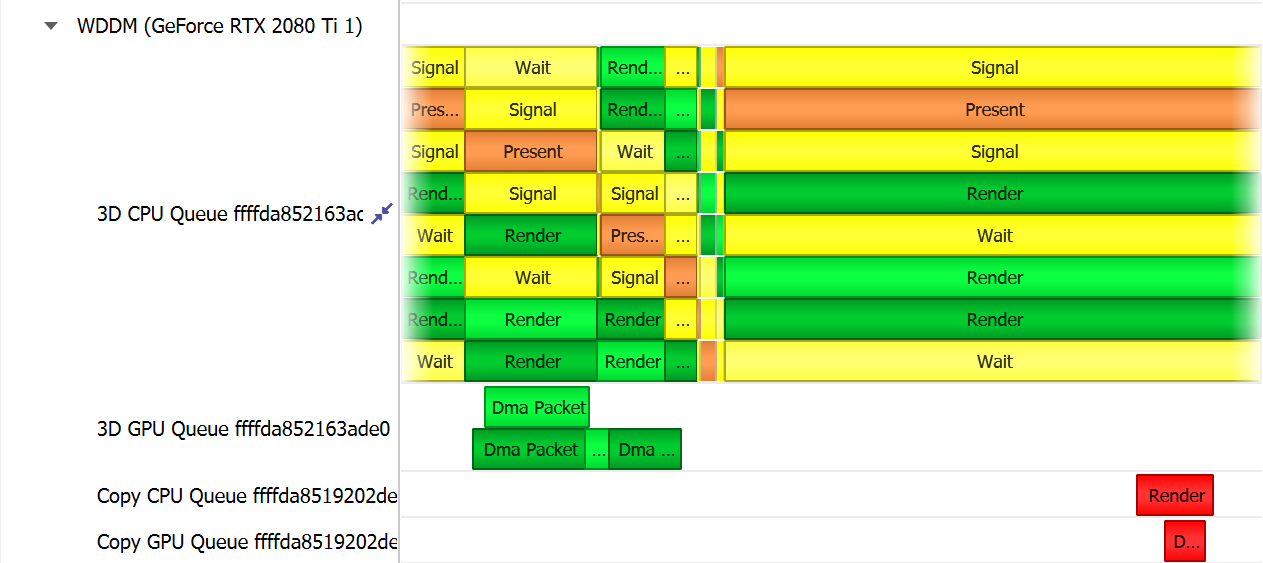
A command buffer in a WDDM queues may have one the following types:
Render
Deferred
System
MMIOFlip
Wait
Signal
Device
Software
It may also be marked as a Present buffer, indicating that the application has finished rendering and requests to display the source surface.
See the Microsoft documentation for the WDDM architecture and the DXGKETW_QUEUE_PACKET_TYPE enumeration.
To retain the .etl trace files captured, so that they can be viewed in other tools (e.g. GPUView), change the “Save ETW log files in project folder” option under “Profile Behavior” in Nsight Systems’s global Options dialog. The .etl files will appear in the same folder as the .nsys-rep file, accessible by right-clicking the report in the Project Explorer and choosing “Show in Folder…”. Data collected from each ETW provider will appear in its own .etl file, and an additional .etl file named “Report XX-Merged-*.etl”, containing the events from all captured sources, will be created as well.
WDDM HW Scheduler
When GPU Hardware Scheduling is enabled in Windows 10 or newer version, the Windows Display Driver Model (WDDM) uses the DxgKrnl ETW provider to expose report of NVIDIA GPUs’ hardware scheduling context switches.
Nsight Systems can capture these context switch events, and display under the GPUs in the timeline rows titled WDDM HW Scheduler - [HW Queue type]. The ranges under each queue will show the process name and PID assoicated with the GPU work during the time period.
The events will be captured if GPU Hardware Scheduling is enabled in the Windows System Display settings, and “Collect WDDM Trace” is enabled in the Nsight Systems Project Settings.

Vulkan API Trace
Vulkan Overview
Vulkan is a low-overhead, cross-platform 3D graphics and compute API, targeting a wide variety of devices from PCs to mobile phones and embedded platforms. The Vulkan API is defined by the Khronos Group. Information about Vulkan and the Khronos Group can be found at the Khronos Vulkan Site.
Nsight Systems can capture information about Vulkan usage by the profiled process. This includes capturing the execution time of Vulkan API functions, corresponding GPU workloads, debug util labels, and frame durations. Vulkan profiling is supported on both Windows and x86 Linux operating systems.
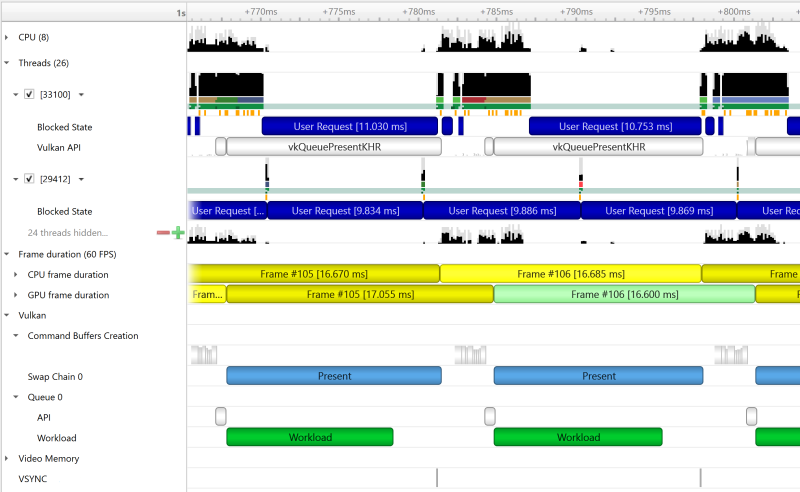
The Command Buffer Creation row displays time periods when command buffers were being created. This enables developers to improve their application’s multi-threaded command buffer creation. Command buffer creation time period is measured between the call to vkBeginCommandBuffer and the call to vkEndCommandBuffer.

A Queue row is displayed for each Vulkan queue created by the profiled application. The API sub-row displays time periods where vkQueueSubmit was called. The GPU Workload sub-row displays time periods where workloads were executed by the GPU.

In addition, you can see Vulkan debug util labels on both the CPU and the GPU.
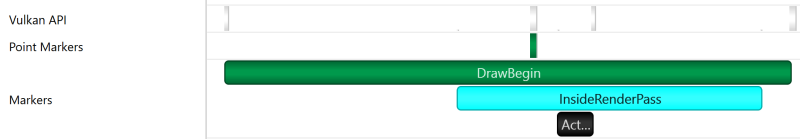
Clicking on a GPU workload highlights the corresponding vkQueueSubmit call, and vice versa.
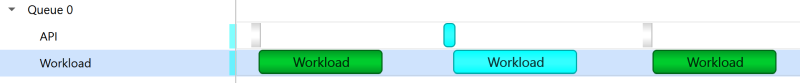
The Vulkan Memory Operations row contains an aggregation of all the Vulkan host-side memory operations, such as host-blocking writes and reads or non-persistent map-unmap ranges.
The row is separated into sub-rows by heap index and memory type - the tooltip for each row and the ranges inside show the heap flags and the memory property flags.
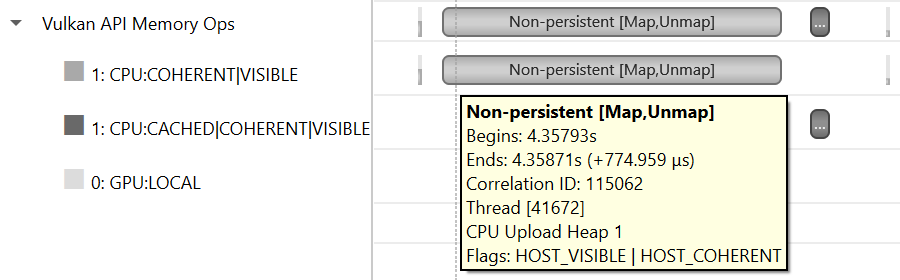
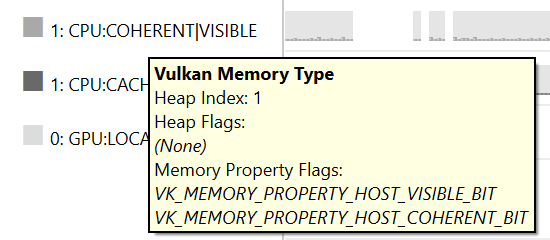
Pipeline Creation Feedback
When tracing target application calls to Vulkan pipeline creation APIs, Nsight Systems leverages the Pipeline Creation Feedback extension to collect more details about the duration of individual pipeline creation stages.
See Pipeline Creation Feedback extension for details about this extension.
Vulkan pipeline creation feedback is available on NVIDIA driver release 435 or later.
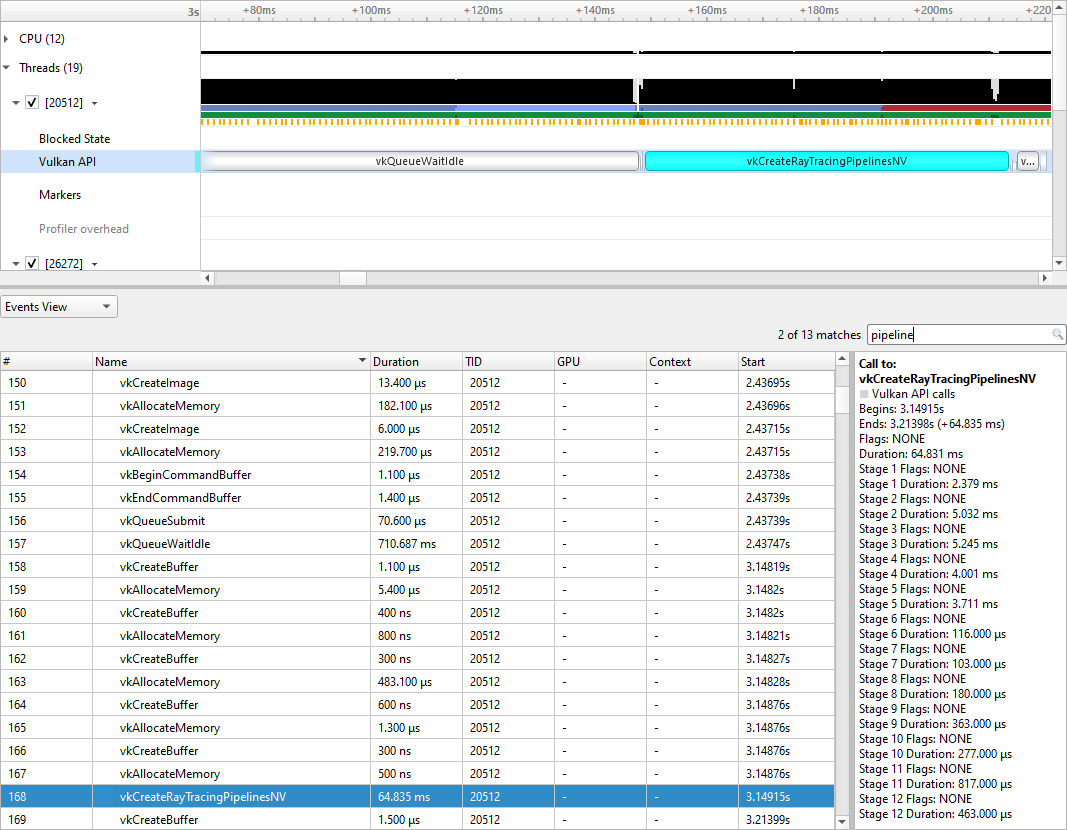
Vulkan GPU Trace Notes
Vulkan GPU trace is available only when tracing apps that use NVIDIA GPUs.
The endings of Vulkan Command Buffers execution ranges on Compute and Transfer queues may appear earlier on the timeline than their actual occurrence.
Stutter Analysis
Stutter Analysis Overview
Nsight Systems on Windows targets displays stutter analysis visualization aids for profiled graphics applications that use either OpenGL, D3D11, D3D12 or Vulkan, as detailed below in the following sections.
FPS Overview
The Frame Duration section displays frame durations on both the CPU and the GPU.
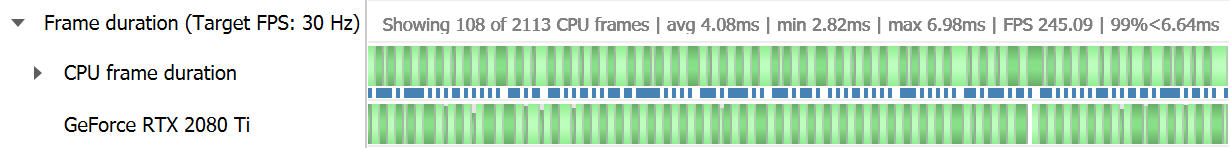
The frame duration row displays live FPS statistics for the current timeline viewport. Values shown are:
Number of CPU frames shown of the total number captured
Average, minimal, and maximal CPU frame time of the currently displayed time range
Average FPS value for the currently displayed frames
The 99th percentile value of the frame lengths (such that only 1% of the frames in the range are longer than this value).
The values will update automatically when scrolling, zooming or filtering the timeline view.
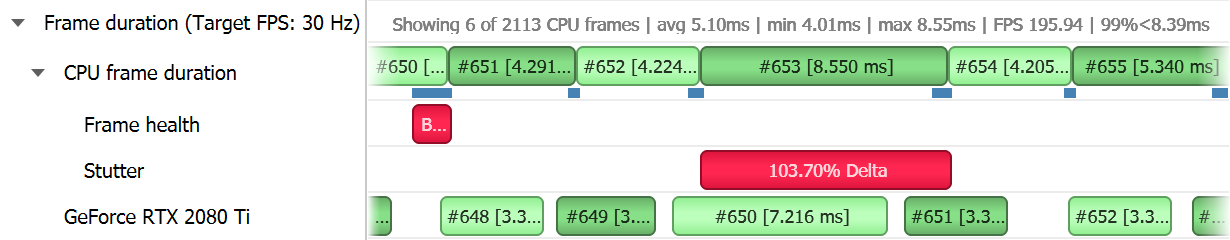
The stutter row highlights frames that are significantly longer than the other frames in their immediate vicinity.
The stutter row uses an algorithm that compares the duration of each frame to the median duration of the surrounding 19 frames. Duration difference under 4 milliseconds is never considered a stutter, to avoid cluttering the display with frames whose absolute stutter is small and not noticeable to the user.
For example, if the stutter threshold is set at 20%:
Median duration is 10 ms. Frame with 13 ms time will not be reported (relative difference > 20%, absolute difference < 4 ms)
Median duration is 60 ms. Frame with 71 ms time will not be reported (relative difference < 20%, absolute difference > 4 ms)
Median duration is 60 ms. Frame with 80 ms is a stutter (relative difference > 20%, absolute difference > 4 ms, both conditions met)
OSC detection
The “19 frame window median” algorithm by itself may not work well with some cases of “oscillation” (consecutive fast and slow frames), resulting in some false positives. The median duration is not meaningful in cases of oscillation and can be misleading.
To address the issue and identify if oscillating frames, the following method is applied:
For every frame, calculate the median duration, 1st and 3rd quartiles of 19-frames window.
Calculate the delta and ratio between 1st and 3rd quartiles.
If the 90th percentile of 3rd - 1st quartile delta array > 4 ms AND the 90th percentile of 3rd/1st quartile array > 1.2 (120%) then mark the results with “OSC” text.
Right-clicking the Frame Duration row caption lets you choose the target frame rate (30, 60, 90 or custom frames per second).
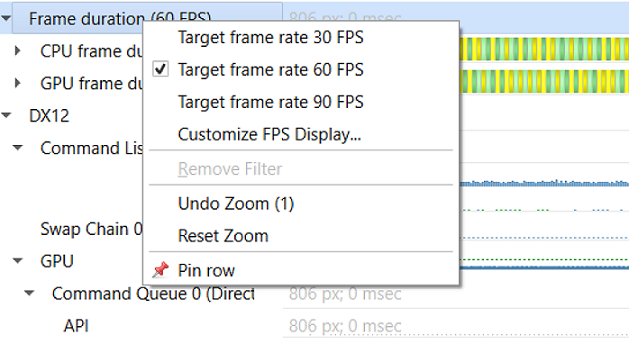
By clicking the Customize FPS Display option, a customization dialog pops up. In the dialog, you can now define the frame duration threshold to customize the view of the potentially problematic frames. In addition, you can define the threshold for the stutter analysis frames.
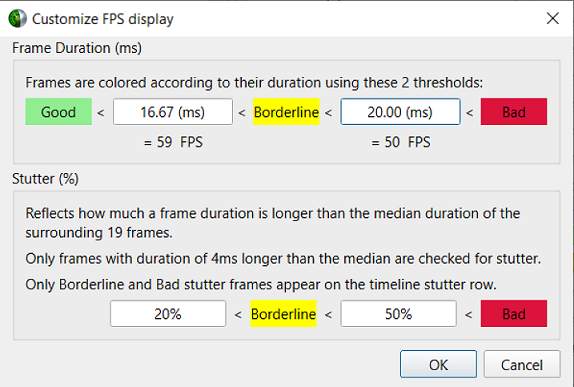
Frame duration bars are color coded:
Green, the frame duration is shorter than required by the target FPS ratio.
Yellow, duration is slightly longer than required by the target FPS rate.
Red, duration far exceeds that required to maintain the target FPS rate.

The CPU Frame Duration row displays the CPU frame duration measured between the ends of consecutive frame boundary calls:
The OpenGL frame boundaries are
eglSwapBuffers/glXSwapBuffers/SwapBufferscalls.The D3D11 and D3D12 frame boundaries are
IDXGISwapChainX::Presentcalls.The Vulkan frame boundaries are
vkQueuePresentKHRcalls.
The timing of the actual calls to the frame boundary calls can be seen in the blue bar at the bottom of the CPU frame duration row
The GPU Frame Duration row displays the time measured between
The start time of the first GPU workload execution of this frame.
The start time of the first GPU workload execution of the next frame.
Reflex SDK
NVIDIA Reflex SDK is a series of NVAPI calls that allow applications to integrate the Ultra Low Latency driver feature more directly into their game to further optimize synchronization between simulation and rendering stages and lower the latency between user input and final image rendering. For more details about Reflex SDK, see Reflex SDK Site.
Nsight Systems will automatically capture NVAPI functions when either Direct3D 11, Direct3D 12, or Vulkan API trace are enabled.
The Reflex SDK row displays timeline ranges for the following types of latency markers:
RenderSubmit.
Simulation.
Present.
Driver.
OS Render Queue.
GPU Render.
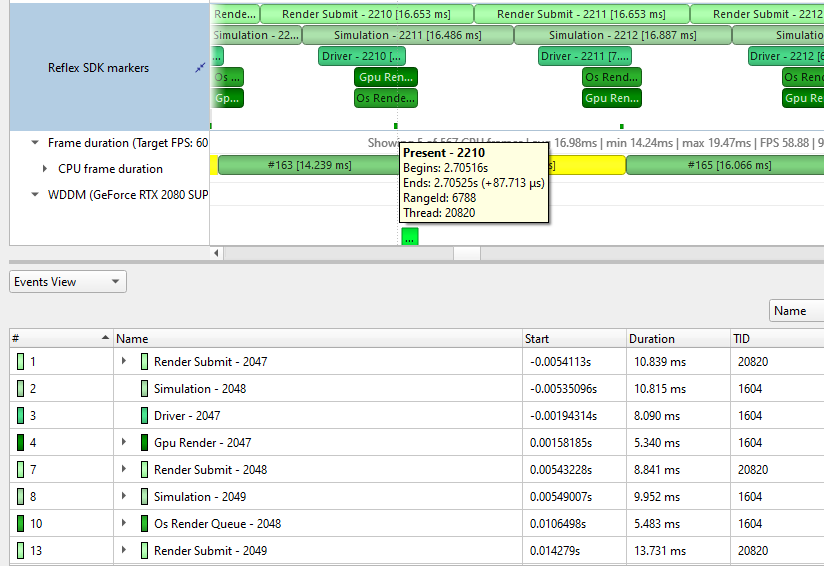
Performance Warnings row
This row shows performance warnings and common pitfalls that are automatically detected based on the enabled capture types. Warnings are reported for:
ETW performance warnings
Vulkan calls to
vkQueueSubmitand D3D12 calls toID3D12CommandQueue::ExecuteCommandListthat take a longer time to execute than the total time of the GPU workloads they generatedUsage of Vulkan API functions that may adversely affect performance
Creation of a Vulkan device with memory zeroing, whether by physical device default or manually
Vulkan command buffer barrier which can be combined or removed, such as subsequent barriers or read-to-read barriers

Frame Health
The Frame Health row displays actions that took significantly a longer time during the current frame, compared to the median time of the same actions executed during the surrounding 19-frames. This is a great tool for detecting the reason for frame time stuttering. Such actions may be: shader compilation, present, memory mapping, and more. Nsight Systems measures the accumulated time of such actions in each frame. For example: calculating the accumulated time of shader compilations in each frame and comparing it to the accumulated time of shader compilations in the surrounding 19 frames.
Example of a Vulkan frame health row:
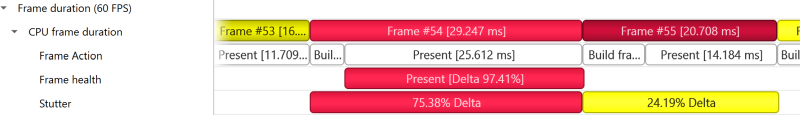
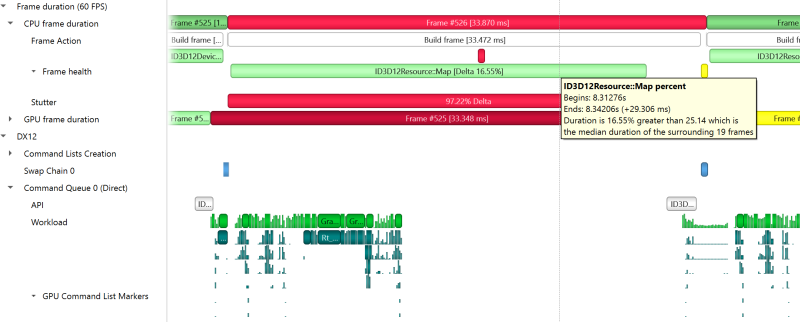
GPU Memory Utilization
The Memory Utilization row displays the amount of used local GPU memory and the commit limit for each GPU.
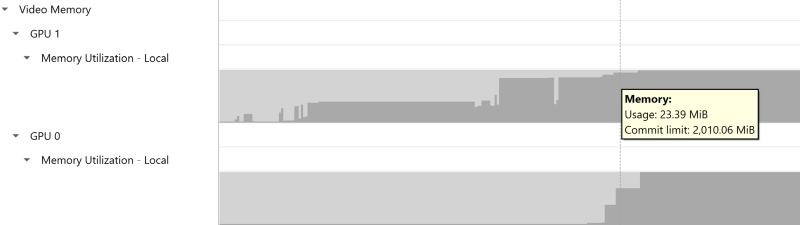
Note that this is not the same as the CUDA kernel memory allocation graph, see CUDA GPU Memory Graph for that functionality.
Vertical Synchronization
The VSYNC rows display when the monitor’s vertical synchronizations occur.

OpenMP Trace
Nsight Systems for Linux is capable of capturing information about OpenMP events. This functionality is built on the OpenMP Tools Interface (OMPT), full support is available only for runtime libraries supporting tools interface defined in OpenMP 5.0 or greater.
As an example, LLVM OpenMP runtime library partially implements tools interface. If you use PGI compiler <= 20.4 to build your OpenMP applications, add -mp=libomp switch to use LLVM OpenMP runtime and enable OMPT based tracing. If you use Clang, make sure the LLVM OpenMP runtime library you link to was compiled with tools interface enabled.
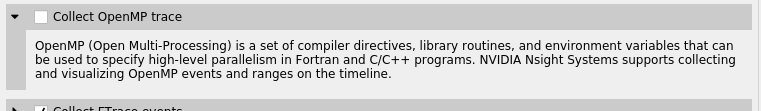
Only a subset of the OMPT callbacks are processed:
ompt_callback_parallel_begin
ompt_callback_parallel_end
ompt_callback_sync_region
ompt_callback_task_create
ompt_callback_task_schedule
ompt_callback_implicit_task
ompt_callback_master
ompt_callback_reduction
ompt_callback_task_create
ompt_callback_cancel
ompt_callback_mutex_acquire, ompt_callback_mutex_acquired
ompt_callback_mutex_acquired, ompt_callback_mutex_released
ompt_callback_mutex_released
ompt_callback_work
ompt_callback_dispatch
ompt_callback_flush
Note
The raw OMPT events are used to generate ranges indicating the runtime of OpenMP operations and constructs.
Example screenshot:
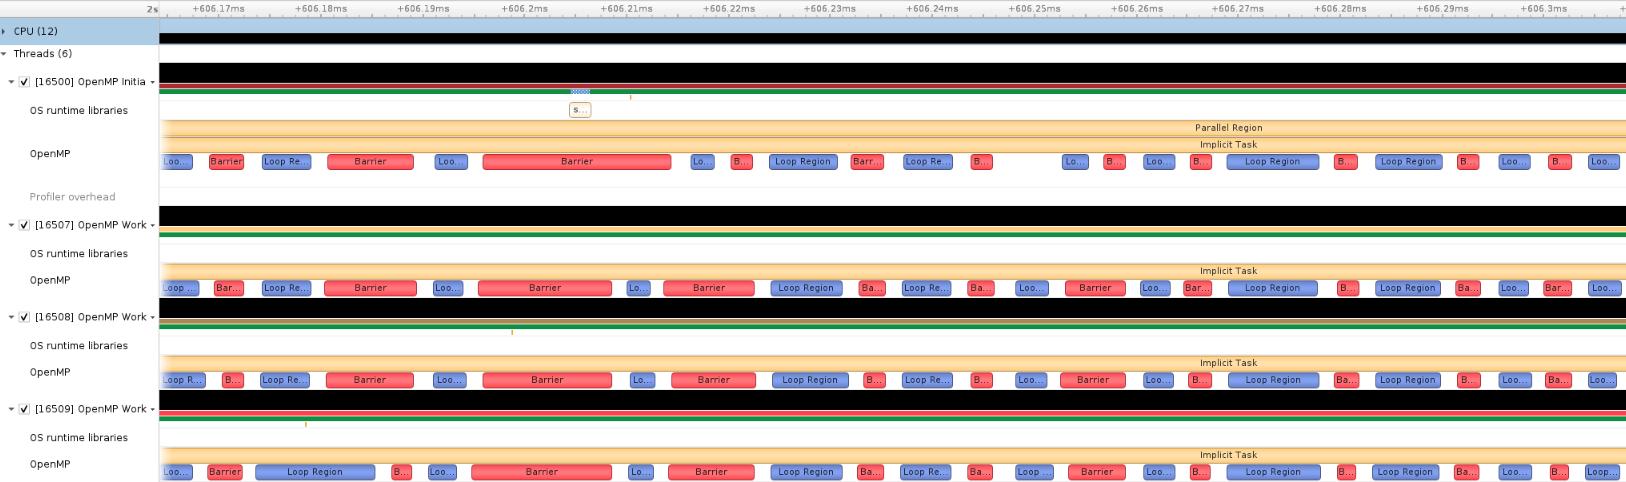
OS Runtime Libraries Trace
On Linux, OS runtime libraries can be traced to gather information about low-level userspace APIs. This traces the system call wrappers and thread synchronization interfaces exposed by the C runtime and POSIX Threads (pthread) libraries. This does not perform a complete runtime library API trace, but instead focuses on the functions that can take a long time to execute, or could potentially cause your thread be unscheduled from the CPU while waiting for an event to complete. OS runtime trace is not available for Windows targets.
OS runtime tracing complements and enhances sampling information by:
Visualizing when the process is communicating with the hardware, controlling resources, performing multi-threading synchronization or interacting with the kernel scheduler.
Adding additional thread states by correlating how OS runtime libraries traces affect the thread scheduling:
Waiting — the thread is not scheduled on a CPU, it is inside of an OS runtime libraries trace and is believed to be waiting on the firmware to complete a request.
In OS runtime library function — the thread is scheduled on a CPU and inside of an OS runtime libraries trace. If the trace represents a system call, the process is likely running in kernel mode.
Collecting backtraces for long OS runtime libraries call. This provides a way to gather blocked-state backtraces, allowing you to gain more context about why the thread was blocked so long, yet avoiding unnecessary overhead for short events.
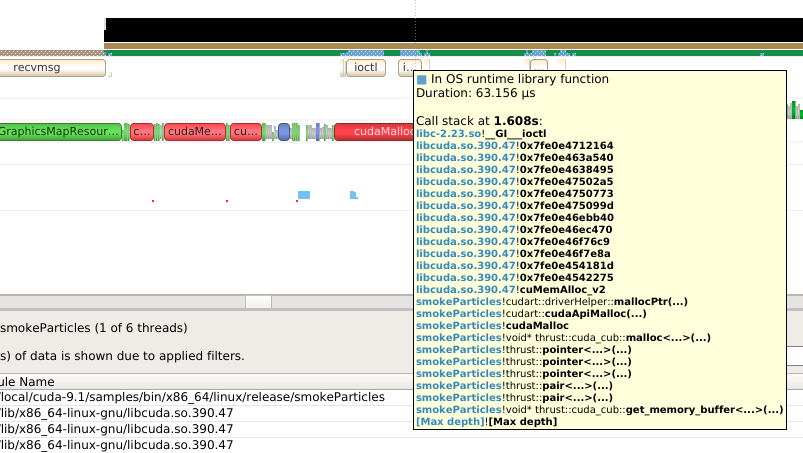
To enable OS runtime libraries tracing from Nsight Systems:
CLI — Use the -t, --trace option with the osrt parameter. See Command Line Options for more information.
GUI — Select the Collect OS runtime libraries trace checkbox.
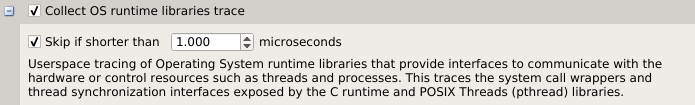
You can also use Skip if shorter than. This will skip calls shorter than the given threshold. Enabling this option will improve performances as well as reduce noise on the timeline. We strongly encourage you to skip OS runtime libraries call shorter than 1 μs.
Locking a Resource
The functions listed below receive a special treatment. If the tool detects that the resource is already acquired by another thread and will induce a blocking call, we always trace it. Otherwise, it will never be traced.
pthread_mutex_lock
pthread_rwlock_rdlock
pthread_rwlock_wrlock
pthread_spin_lock
sem_wait
Note that even if a call is determined as potentially blocking, there is a chance that it may not actually block after a few cycles have elapsed. The call will still be traced in this scenario.
Limitations
Nsight Systems only traces syscall wrappers exposed by the C runtime. It is not able to trace syscall invoked through assembly code.
Additional thread states, as well as backtrace collection on long calls, are only enabled if sampling is turned on.
It is not possible to configure the depth and duration threshold when collecting backtraces. Currently, only OS runtime libraries calls longer than 80 μs will generate a backtrace with a maximum of 24 frames. This limitation will be removed in a future version of the product.
It is required to compile your application and libraries with the
-funwind-tablescompiler flag in order for Nsight Systems to unwind the backtraces correctly.
OS Runtime Libraries Trace Filters
The OS runtime libraries tracing is limited to a select list of functions. It also depends on the version of the C runtime linked to the application.
OS Runtime Default Function List
Libc system call wrappers
accept
accept4
acct
alarm
arch_prctl
bind
bpf
brk
chroot
clock_nanosleep
connect
copy_file_range
creat
creat64
dup
dup2
dup3
epoll_ctl
epoll_pwait
epoll_wait
fallocate
fallocate64
fcntl
fdatasync
flock
fork
fsync
ftruncate
futex
ioctl
ioperm
iopl
kill
killpg
listen
membarrier
mlock
mlock2
mlockall
mmap
mmap64
mount
move_pages
mprotect
mq_notify
mq_open
mq_receive
mq_send
mq_timedreceive
mq_timedsend
mremap
msgctl
msgget
msgrcv
msgsnd
msync
munmap
nanosleep
nfsservctl
open
open64
openat
openat64
pause
pipe
pipe2
pivot_root
poll
ppoll
prctl
pread
pread64
preadv
preadv2
preadv64
process_vm_readv
process_vm_writev
pselect6
ptrace
pwrite
pwrite64
pwritev
pwritev2
pwritev64
read
readv
reboot
recv
recvfrom
recvmmsg
recvmsg
rt_sigaction
rt_sigqueueinfo
rt_sigsuspend
rt_sigtimedwait
sched_yield
seccomp
select
semctl
semget
semop
semtimedop
send
sendfile
sendfile64
sendmmsg
sendmsg
sendto
shmat
shmctl
shmdt
shmget
shutdown
sigaction
sigsuspend
sigtimedwait
socket
socketpair
splice
swapoff
swapon
sync
sync_file_range
syncfs
tee
tgkill
tgsigqueueinfo
tkill
truncate
umount2
unshare
uselib
vfork
vhangup
vmsplice
wait
wait3
wait4
waitid
waitpid
write
writev
_sysctl
POSIX Threads
pthread_barrier_wait
pthread_cancel
pthread_cond_broadcast
pthread_cond_signal
pthread_cond_timedwait
pthread_cond_wait
pthread_create
pthread_join
pthread_kill
pthread_mutex_lock
pthread_mutex_timedlock
pthread_mutex_trylock
pthread_rwlock_rdlock
pthread_rwlock_timedrdlock
pthread_rwlock_timedwrlock
pthread_rwlock_tryrdlock
pthread_rwlock_trywrlock
pthread_rwlock_wrlock
pthread_spin_lock
pthread_spin_trylock
pthread_timedjoin_np
pthread_tryjoin_np
pthread_yield
sem_timedwait
sem_trywait
sem_wait
I/O
aio_fsync
aio_fsync64
aio_suspend
aio_suspend64
fclose
fcloseall
fflush
fflush_unlocked
fgetc
fgetc_unlocked
fgets
fgets_unlocked
fgetwc
fgetwc_unlocked
fgetws
fgetws_unlocked
flockfile
fopen
fopen64
fputc
fputc_unlocked
fputs
fputs_unlocked
fputwc
fputwc_unlocked
fputws
fputws_unlocked
fread
fread_unlocked
freopen
freopen64
ftrylockfile
fwrite
fwrite_unlocked
getc
getc_unlocked
getdelim
getline
getw
getwc
getwc_unlocked
lockf
lockf64
mkfifo
mkfifoat
posix_fallocate
posix_fallocate64
putc
putc_unlocked
putwc
putwc_unlocked
Miscellaneous
forkpty
popen
posix_spawn
posix_spawnp
sigwait
sigwaitinfo
sleep
system
usleep
NVTX Trace
The NVIDIA Tools Extension Library (NVTX) is a powerful mechanism that allows users to manually instrument their application. Nsight Systems can then collect the information and present it on the timeline.
Nsight Systems supports version 3.0 of the NVTX specification.
The following features are supported:
Domains
nvtxDomainCreate(), nvtxDomainDestroy()
nvtxDomainRegisterString()
Push-pop ranges (nested ranges that start and end in the same thread).
nvtxRangePush(), nvtxRangePushEx()
nvtxRangePop()
nvtxDomainRangePushEx()
nvtxDomainRangePop()
Start-end ranges (ranges that are global to the process and are not restricted to a single thread)
nvtxRangeStart(), nvtxRangeStartEx()
nvtxRangeEnd()
nvtxDomainRangeStartEx()
nvtxDomainRangeEnd()
Marks
nvtxMark(), nvtxMarkEx()
nvtxDomainMarkEx()
Thread names
nvtxNameOsThread()
Categories
nvtxNameCategory()
nvtxDomainNameCategory()
To learn more about specific features of NVTX, please refer to the NVTX header file: nvToolsExt.h or the NVTX documentation.
To use NVTX in your application, follow these steps:
Add
#include "nvtx3/nvToolsExt.h"in your source code. The nvtx3 directory is located in the Nsight Systems package in the Target-<architecture>/nvtx/include directory and is available via github at http://github.com/NVIDIA/NVTX.Add the following compiler flag:
-ldlAdd calls to the NVTX API functions. For example, try adding
nvtxRangePush("main")in the beginning of themain()function, andnvtxRangePop()just before the return statement in the end.For convenience in C++ code, consider adding a wrapper that implements RAII (resource acquisition is initialization) pattern, which would guarantee that every range gets closed.
In the project settings, select the Collect NVTX trace checkbox.
In addition, by enabling the “Insert NVTX Marker hotkey” option it is possible to add NVTX markers to a running non-console applications by pressing the F11 key. These will appear in the report under the NVTX Domain named “HotKey markers”.
Typically calls to NVTX functions can be left in the source code even if the application is not being built for profiling purposes, since the overhead is very low when the profiler is not attached.
NVTX is not intended to annotate very small pieces of code that are being called very frequently. A good rule of thumb to use: if code being annotated usually takes less than 1 microsecond to execute, adding an NVTX range around this code should be done carefully.
Note
Range annotations should be matched carefully. If many ranges are opened but not closed, Nsight Systems has no meaningful way to visualize it. A rule of thumb is to not have more than a couple dozen ranges open at any point in time. Nsight Systems does not support reports with many unclosed ranges.
NVTX Domains and Categories
NVTX domains enable scoping of annotations. Unless specified differently, all events and annotations are in the default domain. Additionally, categories can be used to group events.
Nsight Systems gives the user the ability to include or exclude NVTX events from a particular domain. This can be especially useful if you are profiling across multiple libraries and are only interested in nvtx events from some of them.
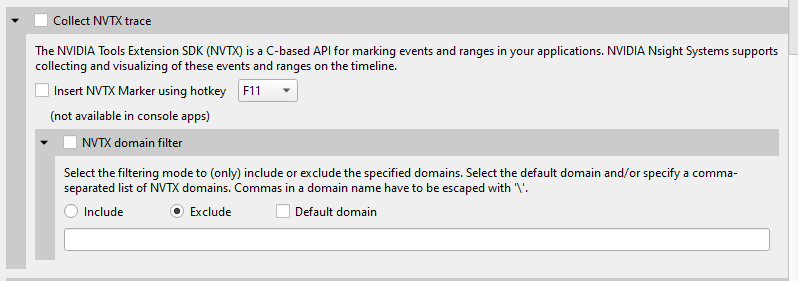
This functionality is also available from the CLI. See the CLI documentation for --nvtx-domain-include and --nvtx-domain-exclude for more details.
Categories that are set in by the user will be recognized and displayed in the GUI.
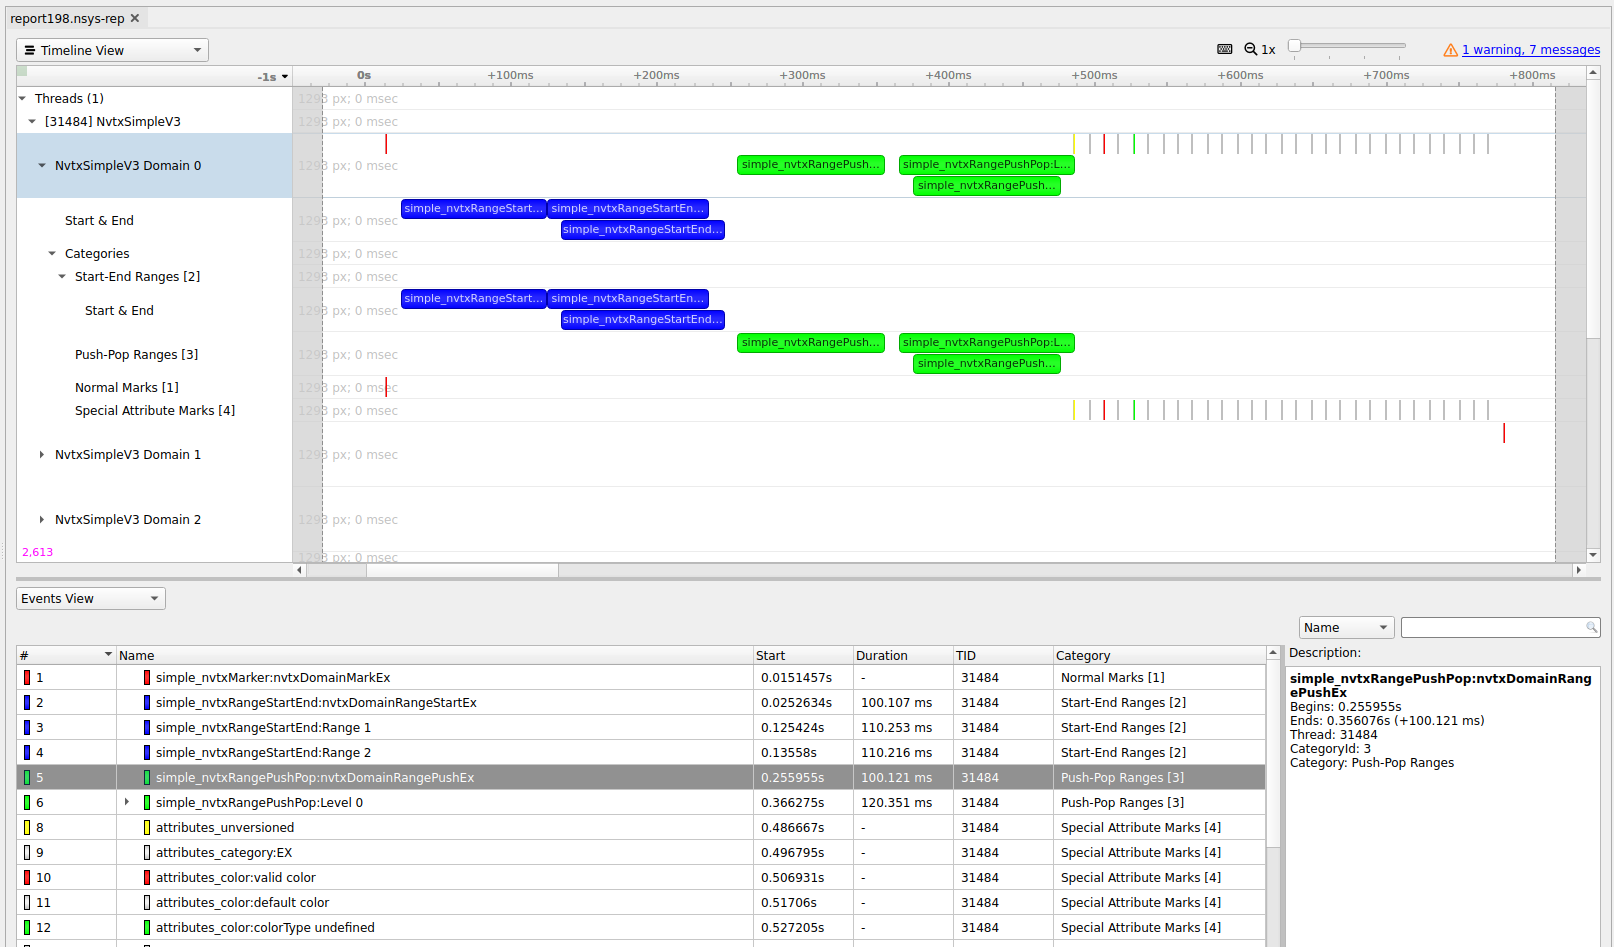
CUDA Trace
Nsight Systems is capable of capturing information about CUDA execution in the profiled process.
The following information can be collected and presented on the timeline in the report:
CUDA API trace — trace of CUDA Runtime and CUDA Driver calls made by the application.
CUDA Runtime calls typically start with
cudaprefix (e.g.cudaLaunch).CUDA Driver calls typically start with
cuprefix (e.g.cuDeviceGetCount).
CUDA workload trace — trace of activity happening on the GPU, which includes memory operations (e.g., Host-to-Device memory copies) and kernel executions. Within the threads that use the CUDA API, additional child rows will appear in the timeline tree.
On Nsight Systems Workstation Edition, cuDNN and cuBLAS API tracing and OpenACC tracing.
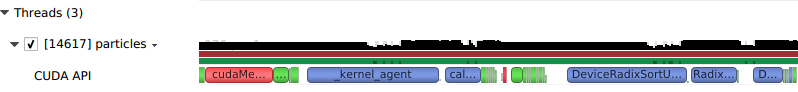
Near the bottom of the timeline row tree, the GPU node will appear and contain a CUDA node. Within the CUDA node, each CUDA context used within the process will be shown along with its corresponding CUDA streams. Steams will contain memory operations and kernel launches on the GPU. Kernel launches are represented by blue, while memory transfers are displayed in red.
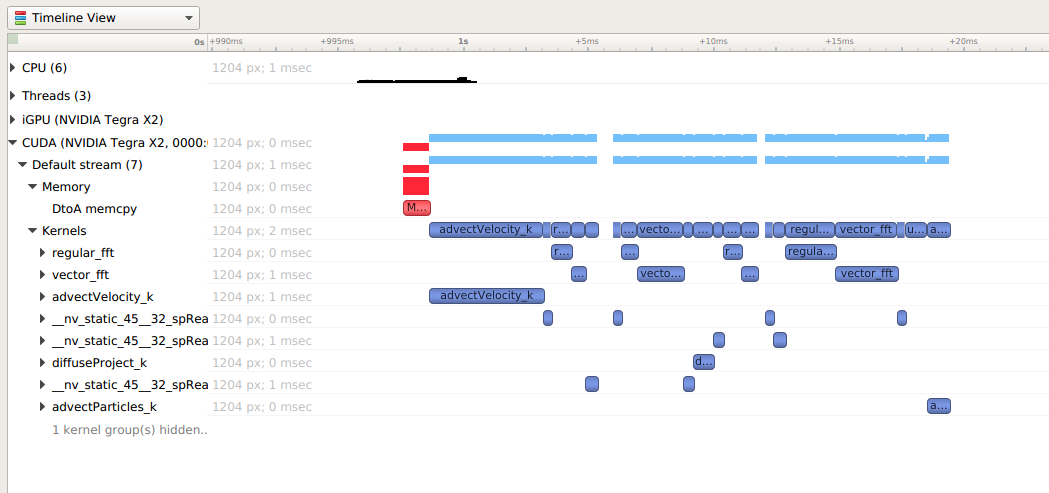
The easiest way to capture CUDA information is to launch the process from Nsight Systems, and it will setup the environment for you. To do so, simply set up a normal launch and select the Collect CUDA trace checkbox.
For Nsight Systems Workstation Edition this looks like:
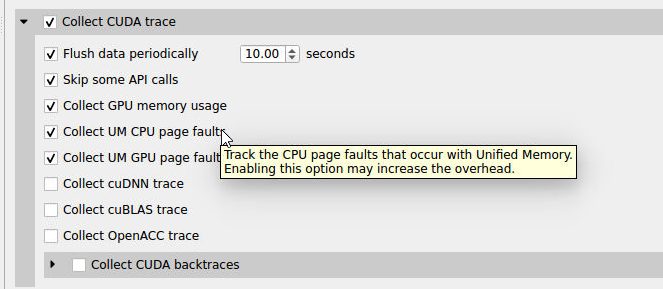
For Nsight Systems Embedded Platforms Edition this looks like:
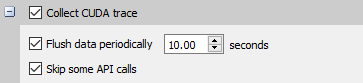
Additional configuration parameters are available:
Collect backtraces for API calls longer than X seconds - turns on collection of CUDA API backtraces and sets the minimum time a CUDA API event must take before its backtraces are collected. Setting this value too low can cause high application overhead and seriously increase the size of your results file.
Flush data periodically — specifies the period after which an attempt to flush CUDA trace data will be made. Normally, in order to collect full CUDA trace, the application needs to finalize the device used for CUDA work (call
cudaDeviceReset(), and then let the application gracefully exit (as opposed to crashing).This option allows flushing CUDA trace data even before the device is finalized. However, it might introduce additional overhead to a random CUDA Driver or CUDA Runtime API call.
Skip some API calls — avoids tracing insignificant CUDA Runtime API calls (namely,
cudaConfigureCall(),cudaSetupArgument(),cudaHostGetDevicePointers()). Not tracing these functions allows Nsight Systems to significantly reduce the profiling overhead, without losing any interesting data. (See CUDA Trace Filters, below)Collect GPU Memory Usage - collects information used to generate a graph of CUDA allocated memory across time. Note that this will increase overhead. See section on CUDA GPU Memory Allocation Graph below.
Collect Unified Memory CPU page faults - collects information on page faults that occur when CPU code tries to access a memory page that resides on the device. See section on Unified Memory CPU Page Faults in the Unified Memory Transfer Trace documentation below.
Collect Unified Memory GPU page faults - collects information on page faults that occur when GPU code tries to access a memory page that resides on the CPU. See section on Unified Memory GPU Page Faults in the Unified Memory Transfer Trace documentation below.
Collect CUDA Graph trace - by default, CUDA tracing will collect and expose information on a whole graph basis. The user can opt to collect on a node per node basis. See section on CUDA Graph Trace below.
For Nsight Systems Workstation Edition, Collect cuDNN trace, Collect cuBLAS trace, Collect OpenACC trace - selects which (if any) extra libraries that depend on CUDA to trace.
OpenACC versions 2.0, 2.5, and 2.6 are supported when using PGI runtime version 15.7 or greater and not compiling statically. In order to differentiate constructs, a PGI runtime of 16.1 or later is required. Note that Nsight Systems Workstation Edition does not support the GCC implementation of OpenACC at this time.
Note
If your application crashes before all collected CUDA trace data has been copied out, some or all data might be lost and not present in the report.
Note
Nsight Systems will not have information about CUDA events that were still in device buffers when analysis terminated. It is a good idea, if using cudaProfilerAPI to control analysis to call cudaDeviceReset before ending analysis.
CUDA GPU Memory Allocation Graph
When the Collect GPU Memory Usage option is selected from the Collect CUDA trace option set, Nsight Systems will track CUDA GPU memory allocations and deallocations and present a graph of this information in the timeline. This is not the same as the GPU memory graph generated during stutter analysis on the Windows target (see Stutter Memory Trace)
Below, in the report on the left, memory is allocated and freed during the collection. In the report on the right, memory is allocated, but not freed during the collection.
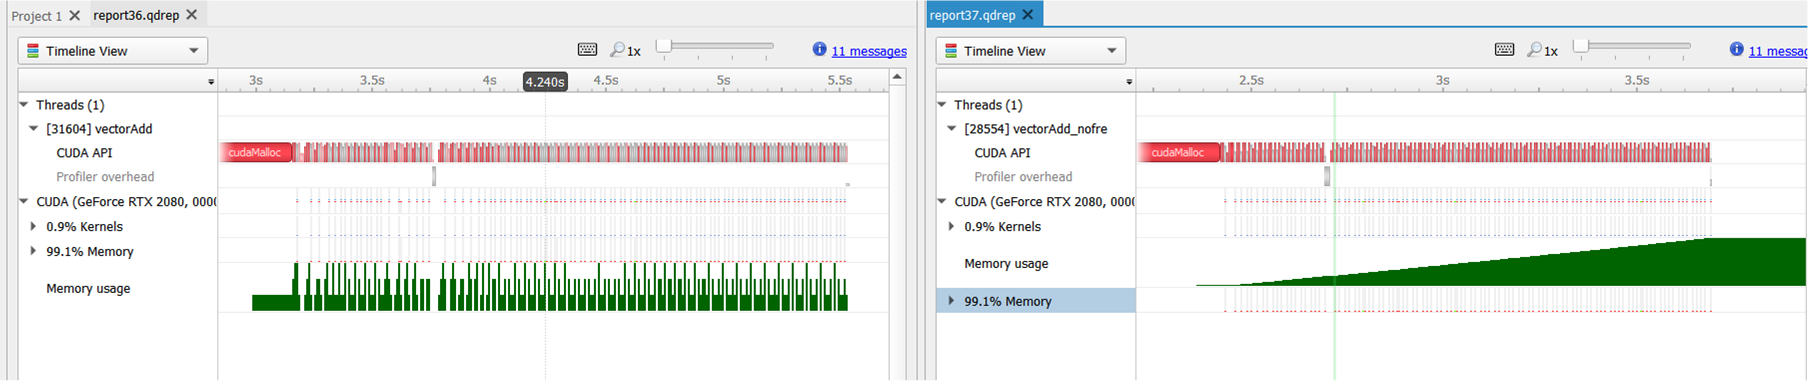
Here is another example, where allocations are happening on multiple GPUs
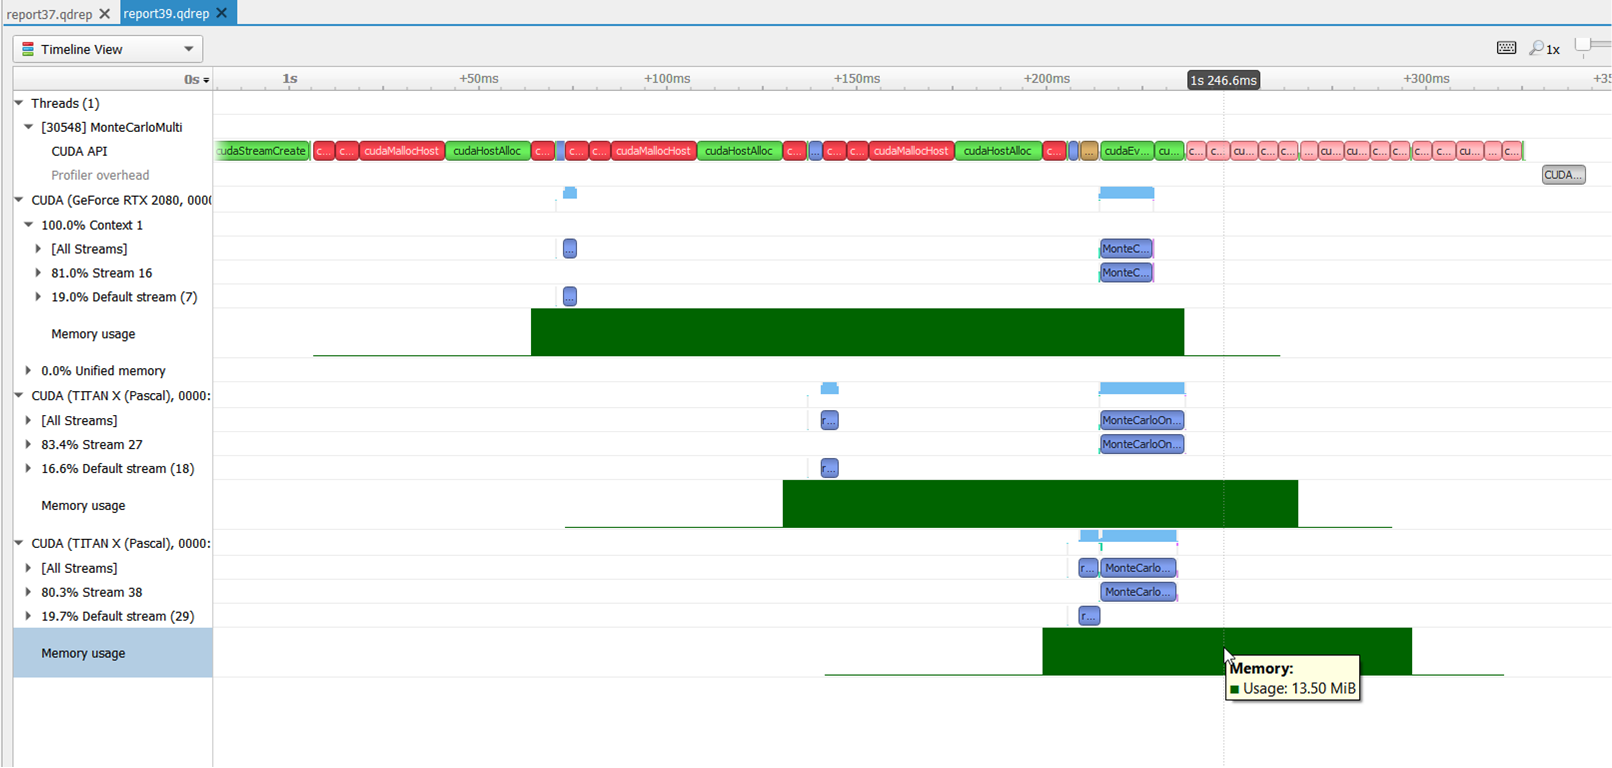
Unified Memory Transfer Trace
For Nsight Systems Workstation Edition, Unified Memory (also called Managed Memory) transfer trace is enabled automatically in Nsight Systems when CUDA trace is selected. It incurs no overhead in programs that do not perform any Unified Memory transfers. Data is displayed in the Managed Memory area of the timeline:
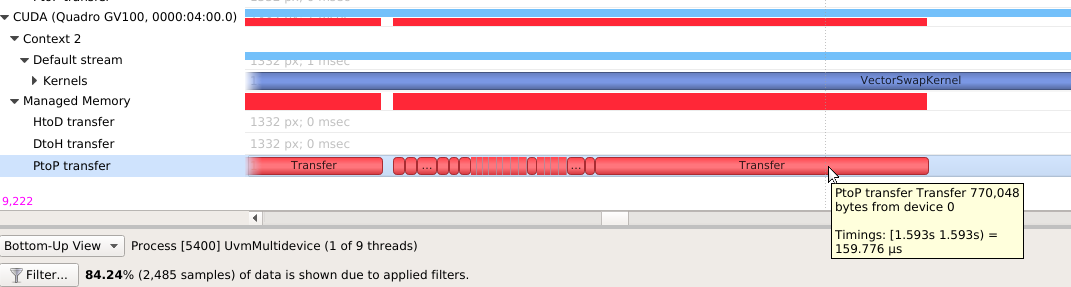
HtoD transfer indicates the CUDA kernel accessed managed memory that was residing on the host, so the kernel execution paused and transferred the data to the device. Heavy traffic here will incur performance penalties in CUDA kernels, so consider using manual cudaMemcpy operations from pinned host memory instead.
PtoP transfer indicates the CUDA kernel accessed managed memory that was residing on a different device, so the kernel execution paused and transferred the data to this device. Heavy traffic here will incur performance penalties, so consider using manual cudaMemcpyPeer operations to transfer from other devices’ memory instead. The row showing these events is for the destination device - the source device is shown in the tooltip for each transfer event.
DtoH transfer indicates the CPU accessed managed memory that was residing on a CUDA device, so the CPU execution paused and transferred the data to system memory. Heavy traffic here will incur performance penalties in CPU code, so consider using manual cudaMemcpy operations from pinned host memory instead.
Some Unified Memory transfers are highlighted with red to indicate potential performance issues:
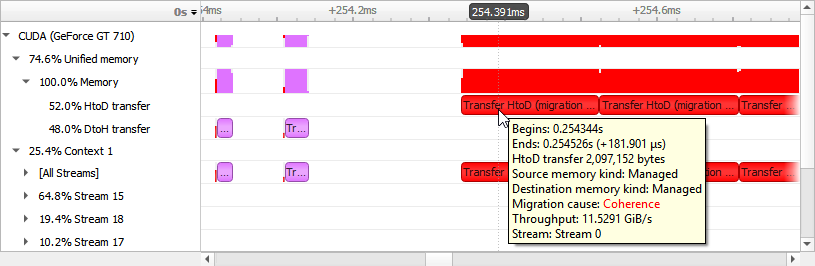
Transfers with the following migration causes are highlighted:
Coherence
Unified Memory migration occurred to guarantee data coherence. SMs (streaming multiprocessors) stop until the migration completes.
Eviction
Unified Memory migrated to the CPU because it was evicted to make room for another block of memory on the GPU. This happens due to memory overcommitment which is available on Linux with Compute Capability ≥ 6.
Unified Memory CPU Page Faults
The Unified Memory CPU page faults feature in Nsight Systems tracks the page faults that occur when CPU code tries to access a memory page that resides on the device.
Note
Collecting Unified Memory CPU page faults can cause overhead of up to 70% in testing. Please use this functionality only when needed.
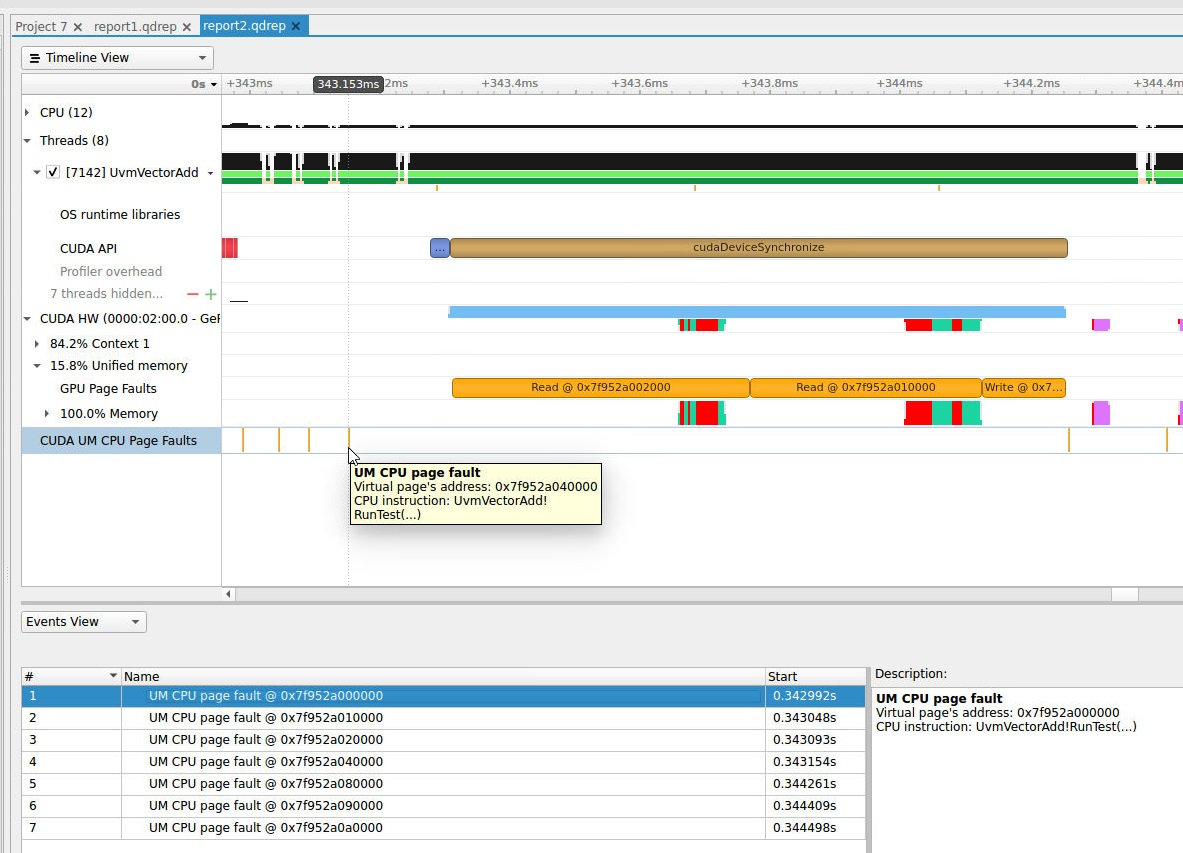
Unified Memory GPU Page Faults
The Unified Memory GPU page faults feature in Nsight Systems tracks the page faults that occur when GPU code tries to access a memory page that resides on the host.
Note
Collecting Unified Memory GPU page faults can cause overhead of up to 70% in testing. Please use this functionality only when needed.
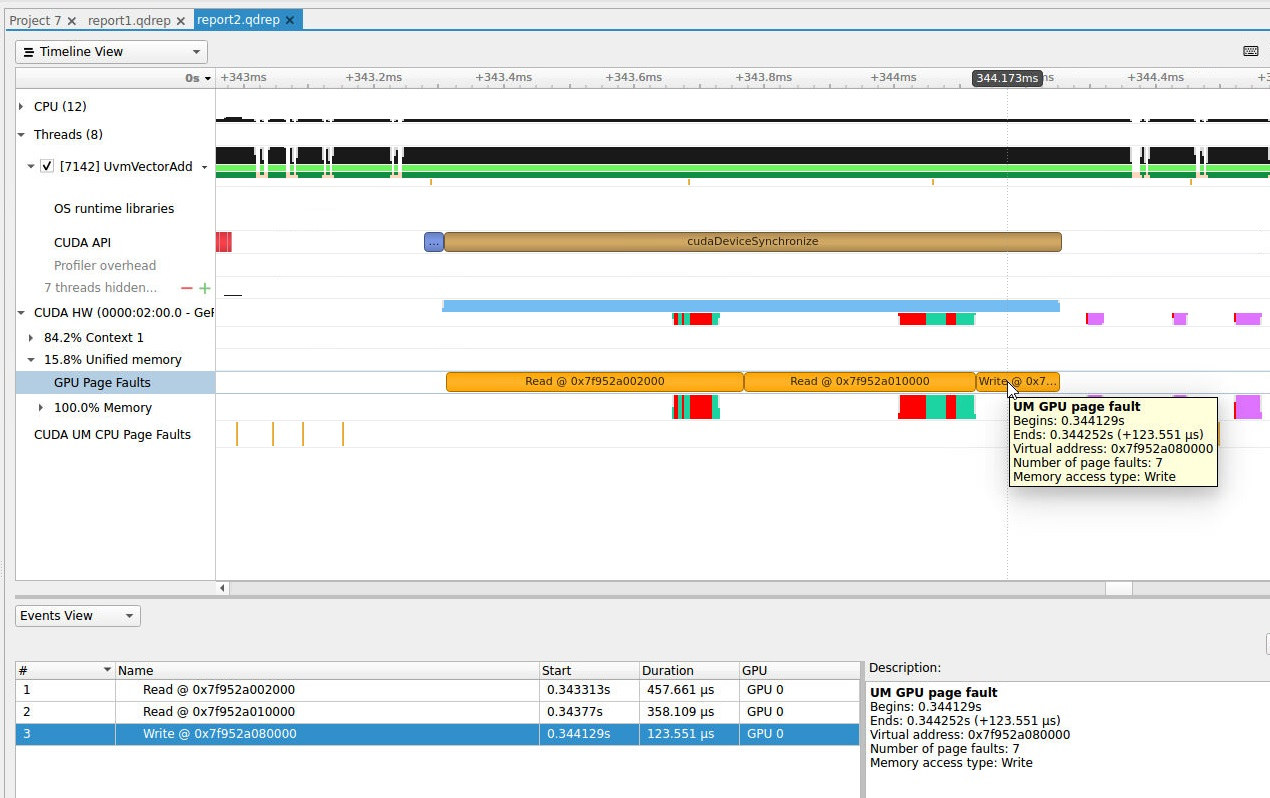
CUDA Graph Trace
Nsight Systems is capable of capturing information about CUDA graphs in your application at either the graph or node granularity. This can be set in the CLI using the --cuda-graph-trace option, or in the GUI by setting the appropriate drop down.
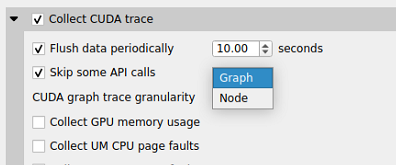
When CUDA graph trace is set to graph, the users sees each graph as one item on the timeline:
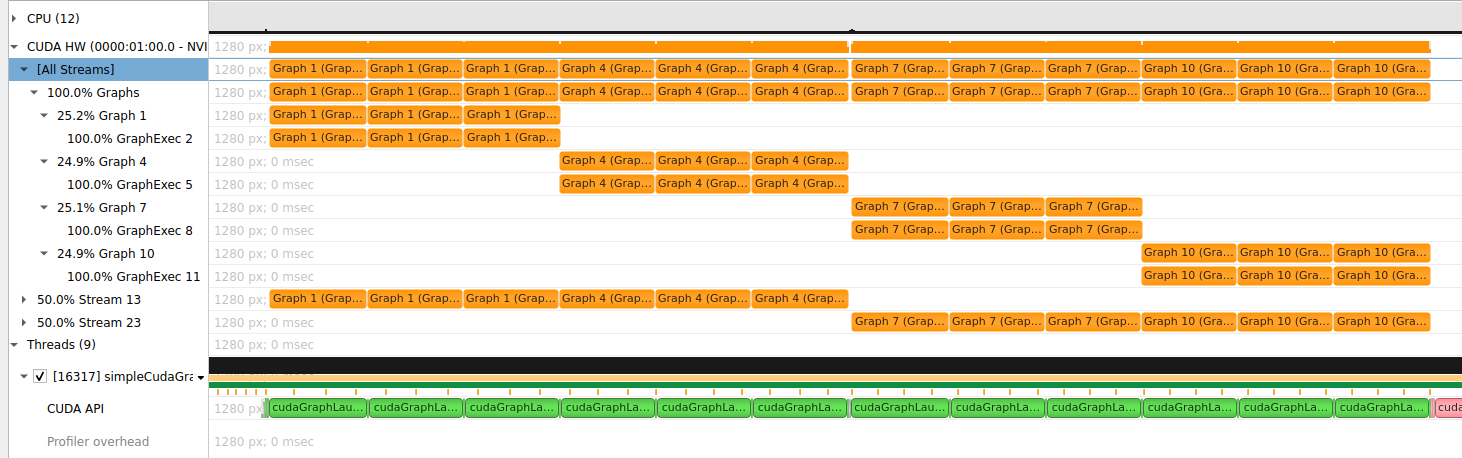
When CUDA graph trace is set to node, the users sees each graph as a set of nodes on the timeline:
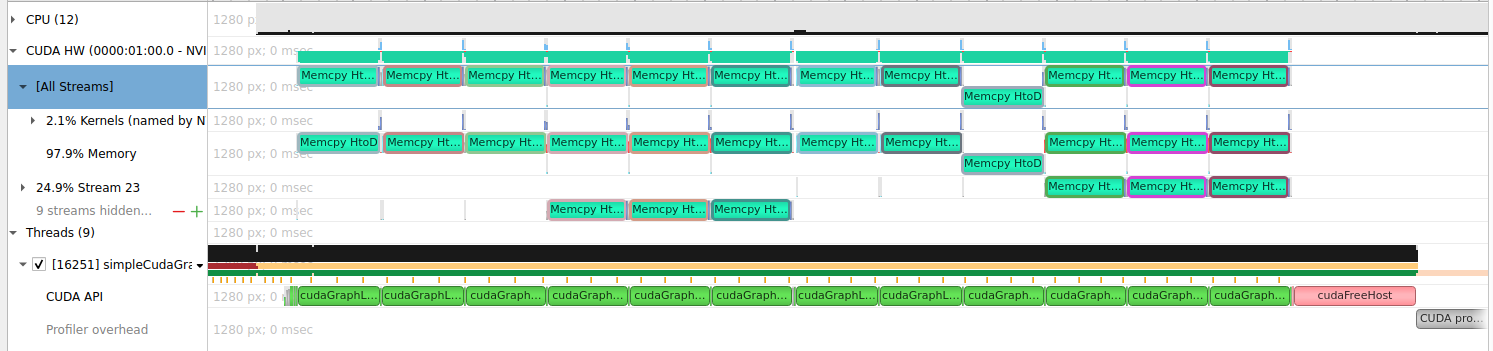
Tracing CUDA graphs at the graph level rather than the tracing the underlying nodes results in significantly less overhead. This option is only available with CUDA driver 515.43 or higher.
CUDA Python Backtrace
Nsight Systems for Arm server (SBSA) platforms and x86 Linux targets, is capable of capturing Python backtrace information when CUDA backtrace is being captured.
To enable CUDA Python backtrace from Nsight Systems:
CLI — Set --python-backtrace=cuda.
GUI — Select the Collect Python backtrace for selected API calls checkbox.
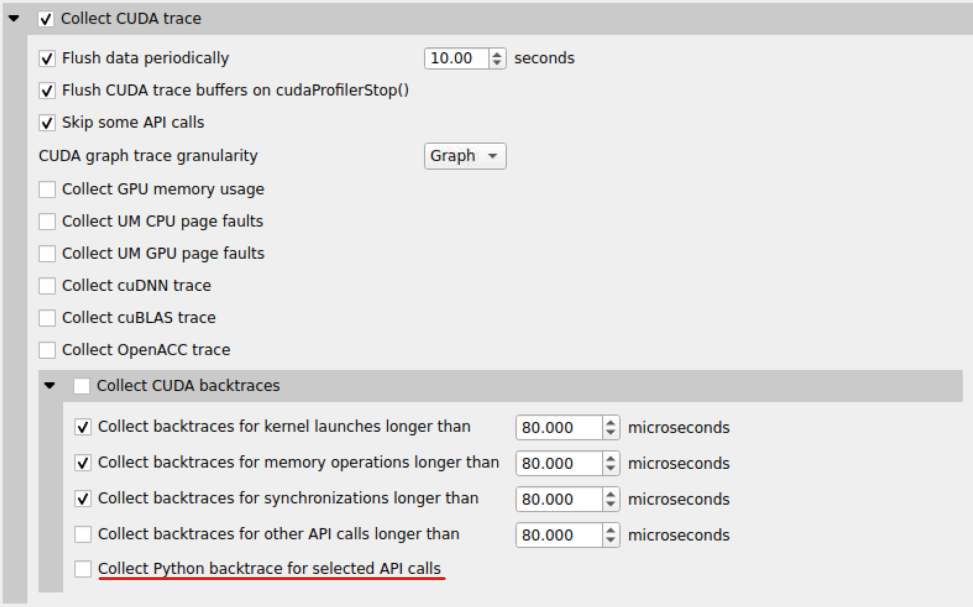
Example screenshot:
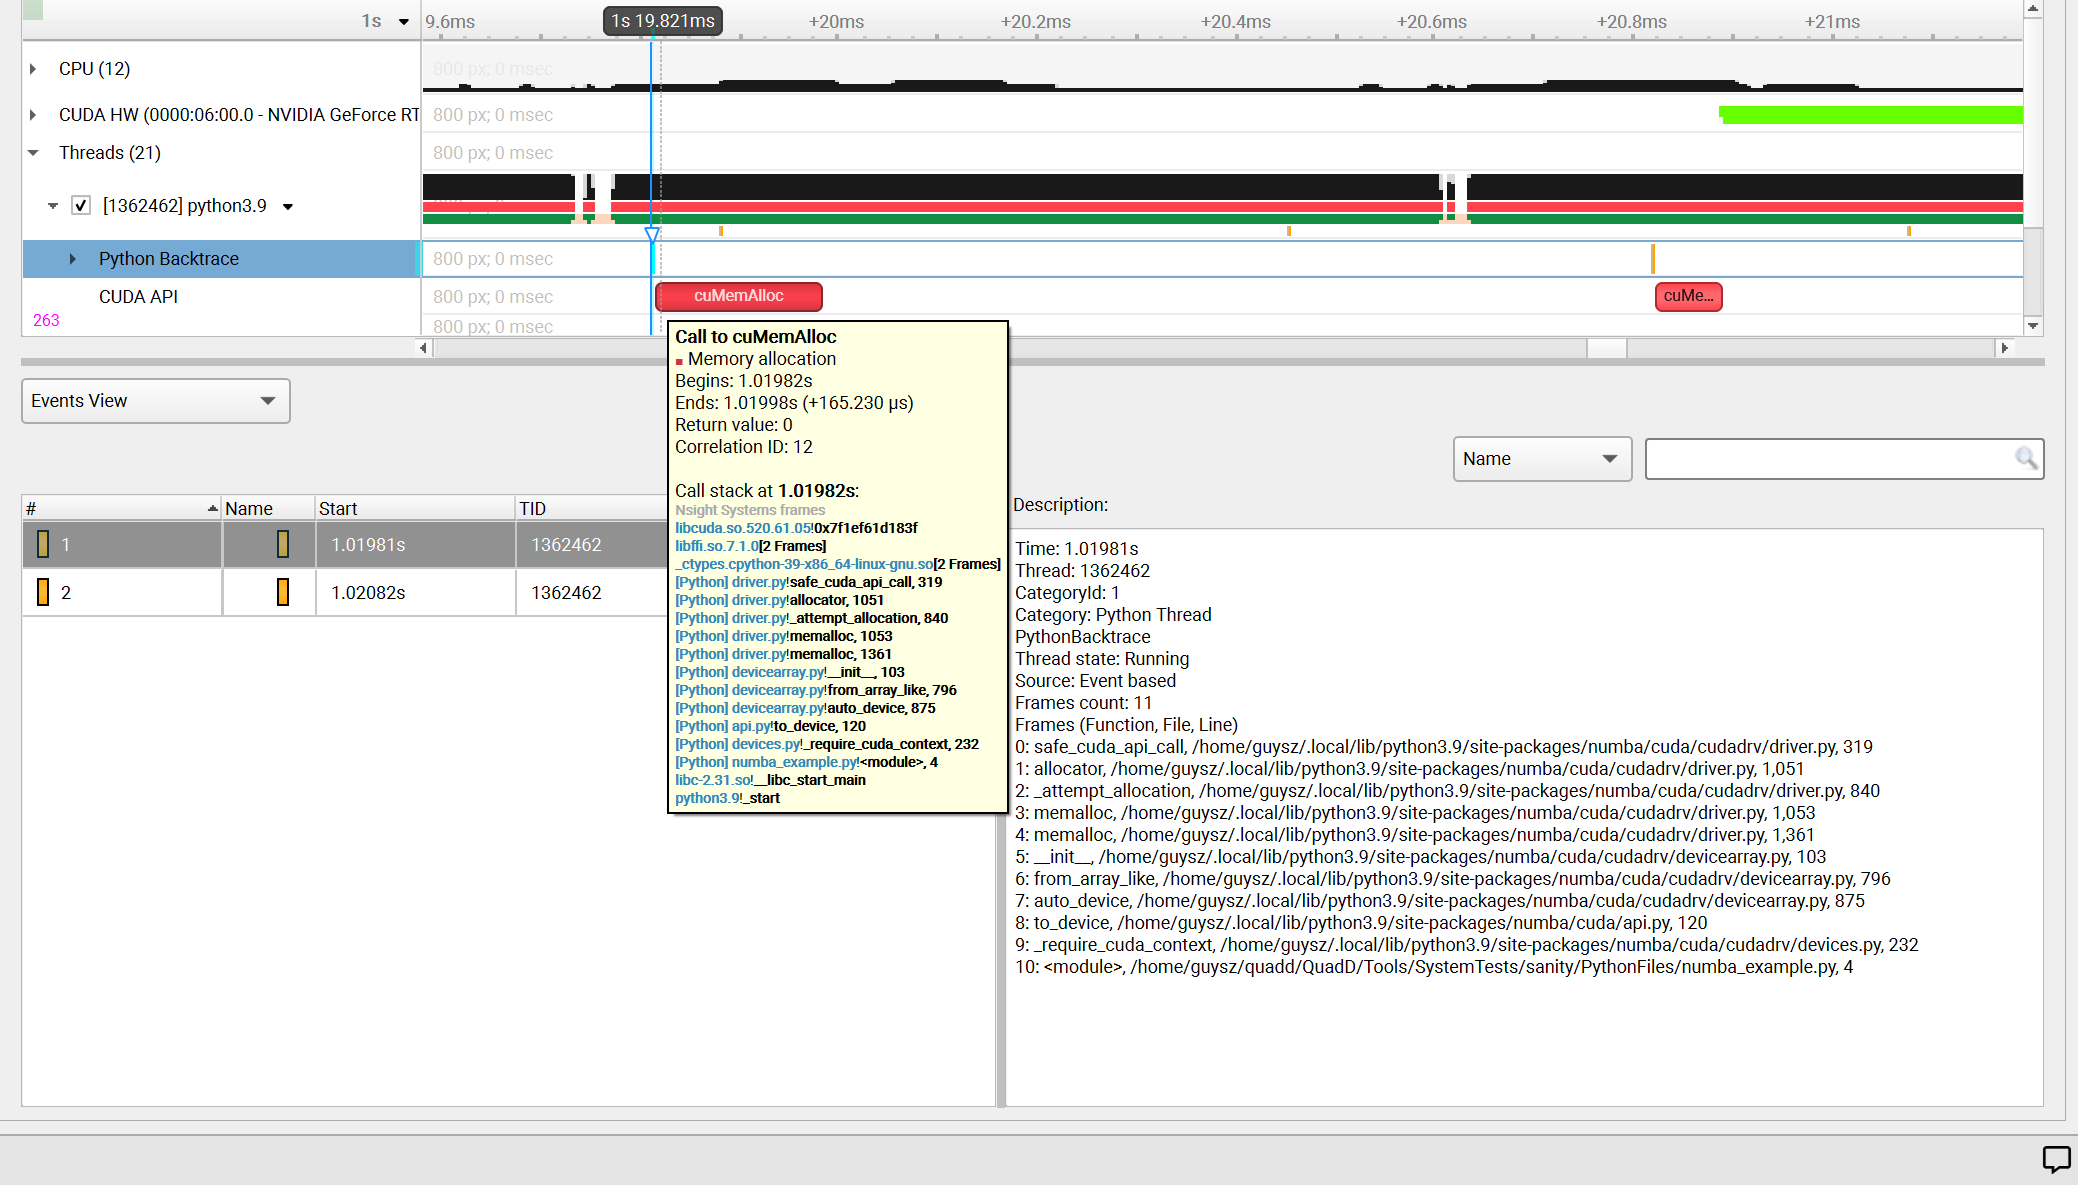
CUDA Default Function List for CLI
CUDA Runtime API
cudaBindSurfaceToArray
cudaBindTexture
cudaBindTexture2D
cudaBindTextureToArray
cudaBindTextureToMipmappedArray
cudaConfigureCall
cudaCreateSurfaceObject
cudaCreateTextureObject
cudaD3D10MapResources
cudaD3D10RegisterResource
cudaD3D10UnmapResources
cudaD3D10UnregisterResource
cudaD3D9MapResources
cudaD3D9MapVertexBuffer
cudaD3D9RegisterResource
cudaD3D9RegisterVertexBuffer
cudaD3D9UnmapResources
cudaD3D9UnmapVertexBuffer
cudaD3D9UnregisterResource
cudaD3D9UnregisterVertexBuffer
cudaDestroySurfaceObject
cudaDestroyTextureObject
cudaDeviceReset
cudaDeviceSynchronize
cudaEGLStreamConsumerAcquireFrame
cudaEGLStreamConsumerConnect
cudaEGLStreamConsumerConnectWithFlags
cudaEGLStreamConsumerDisconnect
cudaEGLStreamConsumerReleaseFrame
cudaEGLStreamConsumerReleaseFrame
cudaEGLStreamProducerConnect
cudaEGLStreamProducerDisconnect
cudaEGLStreamProducerReturnFrame
cudaEventCreate
cudaEventCreateFromEGLSync
cudaEventCreateWithFlags
cudaEventDestroy
cudaEventQuery
cudaEventRecord
cudaEventRecord_ptsz
cudaEventSynchronize
cudaFree
cudaFreeArray
cudaFreeHost
cudaFreeMipmappedArray
cudaGLMapBufferObject
cudaGLMapBufferObjectAsync
cudaGLRegisterBufferObject
cudaGLUnmapBufferObject
cudaGLUnmapBufferObjectAsync
cudaGLUnregisterBufferObject
cudaGraphicsD3D10RegisterResource
cudaGraphicsD3D11RegisterResource
cudaGraphicsD3D9RegisterResource
cudaGraphicsEGLRegisterImage
cudaGraphicsGLRegisterBuffer
cudaGraphicsGLRegisterImage
cudaGraphicsMapResources
cudaGraphicsUnmapResources
cudaGraphicsUnregisterResource
cudaGraphicsVDPAURegisterOutputSurface
cudaGraphicsVDPAURegisterVideoSurface
cudaHostAlloc
cudaHostRegister
cudaHostUnregister
cudaLaunch
cudaLaunchCooperativeKernel
cudaLaunchCooperativeKernelMultiDevice
cudaLaunchCooperativeKernel_ptsz
cudaLaunchKernel
cudaLaunchKernel_ptsz
cudaLaunch_ptsz
cudaMalloc
cudaMalloc3D
cudaMalloc3DArray
cudaMallocArray
cudaMallocHost
cudaMallocManaged
cudaMallocMipmappedArray
cudaMallocPitch
cudaMemGetInfo
cudaMemPrefetchAsync
cudaMemPrefetchAsync_ptsz
cudaMemcpy
cudaMemcpy2D
cudaMemcpy2DArrayToArray
cudaMemcpy2DArrayToArray_ptds
cudaMemcpy2DAsync
cudaMemcpy2DAsync_ptsz
cudaMemcpy2DFromArray
cudaMemcpy2DFromArrayAsync
cudaMemcpy2DFromArrayAsync_ptsz
cudaMemcpy2DFromArray_ptds
cudaMemcpy2DToArray
cudaMemcpy2DToArrayAsync
cudaMemcpy2DToArrayAsync_ptsz
cudaMemcpy2DToArray_ptds
cudaMemcpy2D_ptds
cudaMemcpy3D
cudaMemcpy3DAsync
cudaMemcpy3DAsync_ptsz
cudaMemcpy3DPeer
cudaMemcpy3DPeerAsync
cudaMemcpy3DPeerAsync_ptsz
cudaMemcpy3DPeer_ptds
cudaMemcpy3D_ptds
cudaMemcpyArrayToArray
cudaMemcpyArrayToArray_ptds
cudaMemcpyAsync
cudaMemcpyAsync_ptsz
cudaMemcpyFromArray
cudaMemcpyFromArrayAsync
cudaMemcpyFromArrayAsync_ptsz
cudaMemcpyFromArray_ptds
cudaMemcpyFromSymbol
cudaMemcpyFromSymbolAsync
cudaMemcpyFromSymbolAsync_ptsz
cudaMemcpyFromSymbol_ptds
cudaMemcpyPeer
cudaMemcpyPeerAsync
cudaMemcpyToArray
cudaMemcpyToArrayAsync
cudaMemcpyToArrayAsync_ptsz
cudaMemcpyToArray_ptds
cudaMemcpyToSymbol
cudaMemcpyToSymbolAsync
cudaMemcpyToSymbolAsync_ptsz
cudaMemcpyToSymbol_ptds
cudaMemcpy_ptds
cudaMemset
cudaMemset2D
cudaMemset2DAsync
cudaMemset2DAsync_ptsz
cudaMemset2D_ptds
cudaMemset3D
cudaMemset3DAsync
cudaMemset3DAsync_ptsz
cudaMemset3D_ptds
cudaMemsetAsync
cudaMemsetAsync_ptsz
cudaMemset_ptds
cudaPeerRegister
cudaPeerUnregister
cudaStreamAddCallback
cudaStreamAddCallback_ptsz
cudaStreamAttachMemAsync
cudaStreamAttachMemAsync_ptsz
cudaStreamCreate
cudaStreamCreateWithFlags
cudaStreamCreateWithPriority
cudaStreamDestroy
cudaStreamQuery
cudaStreamQuery_ptsz
cudaStreamSynchronize
cudaStreamSynchronize_ptsz
cudaStreamWaitEvent
cudaStreamWaitEvent_ptsz
cudaThreadSynchronize
cudaUnbindTexture
CUDA Primary API
cu64Array3DCreate
cu64ArrayCreate
cu64D3D9MapVertexBuffer
cu64GLMapBufferObject
cu64GLMapBufferObjectAsync
cu64MemAlloc
cu64MemAllocPitch
cu64MemFree
cu64MemGetInfo
cu64MemHostAlloc
cu64Memcpy2D
cu64Memcpy2DAsync
cu64Memcpy2DUnaligned
cu64Memcpy3D
cu64Memcpy3DAsync
cu64MemcpyAtoD
cu64MemcpyDtoA
cu64MemcpyDtoD
cu64MemcpyDtoDAsync
cu64MemcpyDtoH
cu64MemcpyDtoHAsync
cu64MemcpyHtoD
cu64MemcpyHtoDAsync
cu64MemsetD16
cu64MemsetD16Async
cu64MemsetD2D16
cu64MemsetD2D16Async
cu64MemsetD2D32
cu64MemsetD2D32Async
cu64MemsetD2D8
cu64MemsetD2D8Async
cu64MemsetD32
cu64MemsetD32Async
cu64MemsetD8
cu64MemsetD8Async
cuArray3DCreate
cuArray3DCreate_v2
cuArrayCreate
cuArrayCreate_v2
cuArrayDestroy
cuBinaryFree
cuCompilePtx
cuCtxCreate
cuCtxCreate_v2
cuCtxDestroy
cuCtxDestroy_v2
cuCtxSynchronize
cuD3D10CtxCreate
cuD3D10CtxCreateOnDevice
cuD3D10CtxCreate_v2
cuD3D10MapResources
cuD3D10RegisterResource
cuD3D10UnmapResources
cuD3D10UnregisterResource
cuD3D11CtxCreate
cuD3D11CtxCreateOnDevice
cuD3D11CtxCreate_v2
cuD3D9CtxCreate
cuD3D9CtxCreateOnDevice
cuD3D9CtxCreate_v2
cuD3D9MapResources
cuD3D9MapVertexBuffer
cuD3D9MapVertexBuffer_v2
cuD3D9RegisterResource
cuD3D9RegisterVertexBuffer
cuD3D9UnmapResources
cuD3D9UnmapVertexBuffer
cuD3D9UnregisterResource
cuD3D9UnregisterVertexBuffer
cuEGLStreamConsumerAcquireFrame
cuEGLStreamConsumerConnect
cuEGLStreamConsumerConnectWithFlags
cuEGLStreamConsumerDisconnect
cuEGLStreamConsumerReleaseFrame
cuEGLStreamProducerConnect
cuEGLStreamProducerDisconnect
cuEGLStreamProducerPresentFrame
cuEGLStreamProducerReturnFrame
cuEventCreate
cuEventCreateFromEGLSync
cuEventCreateFromNVNSync
cuEventDestroy
cuEventDestroy_v2
cuEventQuery
cuEventRecord
cuEventRecord_ptsz
cuEventSynchronize
cuGLCtxCreate
cuGLCtxCreate_v2
cuGLInit
cuGLMapBufferObject
cuGLMapBufferObjectAsync
cuGLMapBufferObjectAsync_v2
cuGLMapBufferObjectAsync_v2_ptsz
cuGLMapBufferObject_v2
cuGLMapBufferObject_v2_ptds
cuGLRegisterBufferObject
cuGLUnmapBufferObject
cuGLUnmapBufferObjectAsync
cuGLUnregisterBufferObject
cuGraphicsD3D10RegisterResource
cuGraphicsD3D11RegisterResource
cuGraphicsD3D9RegisterResource
cuGraphicsEGLRegisterImage
cuGraphicsGLRegisterBuffer
cuGraphicsGLRegisterImage
cuGraphicsMapResources
cuGraphicsMapResources_ptsz
cuGraphicsUnmapResources
cuGraphicsUnmapResources_ptsz
cuGraphicsUnregisterResource
cuGraphicsVDPAURegisterOutputSurface
cuGraphicsVDPAURegisterVideoSurface
cuInit
cuLaunch
cuLaunchCooperativeKernel
cuLaunchCooperativeKernelMultiDevice
cuLaunchCooperativeKernel_ptsz
cuLaunchGrid
cuLaunchGridAsync
cuLaunchKernel
cuLaunchKernel_ptsz
cuLinkComplete
cuLinkCreate
cuLinkCreate_v2
cuLinkDestroy
cuMemAlloc
cuMemAllocHost
cuMemAllocHost_v2
cuMemAllocManaged
cuMemAllocPitch
cuMemAllocPitch_v2
cuMemAlloc_v2
cuMemFree
cuMemFreeHost
cuMemFree_v2
cuMemGetInfo
cuMemGetInfo_v2
cuMemHostAlloc
cuMemHostAlloc_v2
cuMemHostRegister
cuMemHostRegister_v2
cuMemHostUnregister
cuMemPeerRegister
cuMemPeerUnregister
cuMemPrefetchAsync
cuMemPrefetchAsync_ptsz
cuMemcpy
cuMemcpy2D
cuMemcpy2DAsync
cuMemcpy2DAsync_v2
cuMemcpy2DAsync_v2_ptsz
cuMemcpy2DUnaligned
cuMemcpy2DUnaligned_v2
cuMemcpy2DUnaligned_v2_ptds
cuMemcpy2D_v2
cuMemcpy2D_v2_ptds
cuMemcpy3D
cuMemcpy3DAsync
cuMemcpy3DAsync_v2
cuMemcpy3DAsync_v2_ptsz
cuMemcpy3DPeer
cuMemcpy3DPeerAsync
cuMemcpy3DPeerAsync_ptsz
cuMemcpy3DPeer_ptds
cuMemcpy3D_v2
cuMemcpy3D_v2_ptds
cuMemcpyAsync
cuMemcpyAsync_ptsz
cuMemcpyAtoA
cuMemcpyAtoA_v2
cuMemcpyAtoA_v2_ptds
cuMemcpyAtoD
cuMemcpyAtoD_v2
cuMemcpyAtoD_v2_ptds
cuMemcpyAtoH
cuMemcpyAtoHAsync
cuMemcpyAtoHAsync_v2
cuMemcpyAtoHAsync_v2_ptsz
cuMemcpyAtoH_v2
cuMemcpyAtoH_v2_ptds
cuMemcpyDtoA
cuMemcpyDtoA_v2
cuMemcpyDtoA_v2_ptds
cuMemcpyDtoD
cuMemcpyDtoDAsync
cuMemcpyDtoDAsync_v2
cuMemcpyDtoDAsync_v2_ptsz
cuMemcpyDtoD_v2
cuMemcpyDtoD_v2_ptds
cuMemcpyDtoH
cuMemcpyDtoHAsync
cuMemcpyDtoHAsync_v2
cuMemcpyDtoHAsync_v2_ptsz
cuMemcpyDtoH_v2
cuMemcpyDtoH_v2_ptds
cuMemcpyHtoA
cuMemcpyHtoAAsync
cuMemcpyHtoAAsync_v2
cuMemcpyHtoAAsync_v2_ptsz
cuMemcpyHtoA_v2
cuMemcpyHtoA_v2_ptds
cuMemcpyHtoD
cuMemcpyHtoDAsync
cuMemcpyHtoDAsync_v2
cuMemcpyHtoDAsync_v2_ptsz
cuMemcpyHtoD_v2
cuMemcpyHtoD_v2_ptds
cuMemcpyPeer
cuMemcpyPeerAsync
cuMemcpyPeerAsync_ptsz
cuMemcpyPeer_ptds
cuMemcpy_ptds
cuMemcpy_v2
cuMemsetD16
cuMemsetD16Async
cuMemsetD16Async_ptsz
cuMemsetD16_v2
cuMemsetD16_v2_ptds
cuMemsetD2D16
cuMemsetD2D16Async
cuMemsetD2D16Async_ptsz
cuMemsetD2D16_v2
cuMemsetD2D16_v2_ptds
cuMemsetD2D32
cuMemsetD2D32Async
cuMemsetD2D32Async_ptsz
cuMemsetD2D32_v2
cuMemsetD2D32_v2_ptds
cuMemsetD2D8
cuMemsetD2D8Async
cuMemsetD2D8Async_ptsz
cuMemsetD2D8_v2
cuMemsetD2D8_v2_ptds
cuMemsetD32
cuMemsetD32Async
cuMemsetD32Async_ptsz
cuMemsetD32_v2
cuMemsetD32_v2_ptds
cuMemsetD8
cuMemsetD8Async
cuMemsetD8Async_ptsz
cuMemsetD8_v2
cuMemsetD8_v2_ptds
cuMipmappedArrayCreate
cuMipmappedArrayDestroy
cuModuleLoad
cuModuleLoadData
cuModuleLoadDataEx
cuModuleLoadFatBinary
cuModuleUnload
cuStreamAddCallback
cuStreamAddCallback_ptsz
cuStreamAttachMemAsync
cuStreamAttachMemAsync_ptsz
cuStreamBatchMemOp
cuStreamBatchMemOp_ptsz
cuStreamCreate
cuStreamCreateWithPriority
cuStreamDestroy
cuStreamDestroy_v2
cuStreamSynchronize
cuStreamSynchronize_ptsz
cuStreamWaitEvent
cuStreamWaitEvent_ptsz
cuStreamWaitValue32
cuStreamWaitValue32_ptsz
cuStreamWaitValue64
cuStreamWaitValue64_ptsz
cuStreamWriteValue32
cuStreamWriteValue32_ptsz
cuStreamWriteValue64
cuStreamWriteValue64_ptsz
cuSurfObjectCreate
cuSurfObjectDestroy
cuSurfRefCreate
cuSurfRefDestroy
cuTexObjectCreate
cuTexObjectDestroy
cuTexRefCreate
cuTexRefDestroy
cuVDPAUCtxCreate
cuVDPAUCtxCreate_v2
cuDNN Function List for X86 CLI
cuDNN API functions
cudnnActivationBackward
cudnnActivationBackward_v3
cudnnActivationBackward_v4
cudnnActivationForward
cudnnActivationForward_v3
cudnnActivationForward_v4
cudnnAddTensor
cudnnBatchNormalizationBackward
cudnnBatchNormalizationBackwardEx
cudnnBatchNormalizationForwardInference
cudnnBatchNormalizationForwardTraining
cudnnBatchNormalizationForwardTrainingEx
cudnnCTCLoss
cudnnConvolutionBackwardBias
cudnnConvolutionBackwardData
cudnnConvolutionBackwardFilter
cudnnConvolutionBiasActivationForward
cudnnConvolutionForward
cudnnCreate
cudnnCreateAlgorithmPerformance
cudnnDestroy
cudnnDestroyAlgorithmPerformance
cudnnDestroyPersistentRNNPlan
cudnnDivisiveNormalizationBackward
cudnnDivisiveNormalizationForward
cudnnDropoutBackward
cudnnDropoutForward
cudnnDropoutGetReserveSpaceSize
cudnnDropoutGetStatesSize
cudnnFindConvolutionBackwardDataAlgorithm
cudnnFindConvolutionBackwardDataAlgorithmEx
cudnnFindConvolutionBackwardFilterAlgorithm
cudnnFindConvolutionBackwardFilterAlgorithmEx
cudnnFindConvolutionForwardAlgorithm
cudnnFindConvolutionForwardAlgorithmEx
cudnnFindRNNBackwardDataAlgorithmEx
cudnnFindRNNBackwardWeightsAlgorithmEx
cudnnFindRNNForwardInferenceAlgorithmEx
cudnnFindRNNForwardTrainingAlgorithmEx
cudnnFusedOpsExecute
cudnnIm2Col
cudnnLRNCrossChannelBackward
cudnnLRNCrossChannelForward
cudnnMakeFusedOpsPlan
cudnnMultiHeadAttnBackwardData
cudnnMultiHeadAttnBackwardWeights
cudnnMultiHeadAttnForward
cudnnOpTensor
cudnnPoolingBackward
cudnnPoolingForward
cudnnRNNBackwardData
cudnnRNNBackwardDataEx
cudnnRNNBackwardWeights
cudnnRNNBackwardWeightsEx
cudnnRNNForwardInference
cudnnRNNForwardInferenceEx
cudnnRNNForwardTraining
cudnnRNNForwardTrainingEx
cudnnReduceTensor
cudnnReorderFilterAndBias
cudnnRestoreAlgorithm
cudnnRestoreDropoutDescriptor
cudnnSaveAlgorithm
cudnnScaleTensor
cudnnSoftmaxBackward
cudnnSoftmaxForward
cudnnSpatialTfGridGeneratorBackward
cudnnSpatialTfGridGeneratorForward
cudnnSpatialTfSamplerBackward
cudnnSpatialTfSamplerForward
cudnnTransformFilter
cudnnTransformTensor
cudnnTransformTensorEx
OpenACC Trace
Nsight Systems for Linux x86_64 and Power targets is capable of capturing information about OpenACC execution in the profiled process.
OpenACC versions 2.0, 2.5, and 2.6 are supported when using PGI runtime version 15.7 or later. In order to differentiate constructs (see tooltip below), a PGI runtime of 16.0 or later is required. Note that Nsight Systems does not support the GCC implementation of OpenACC at this time.
Under the CPU rows in the timeline tree, each thread that uses OpenACC will show OpenACC trace information. You can click on a OpenACC API call to see correlation with the underlying CUDA API calls (highlighted in teal):
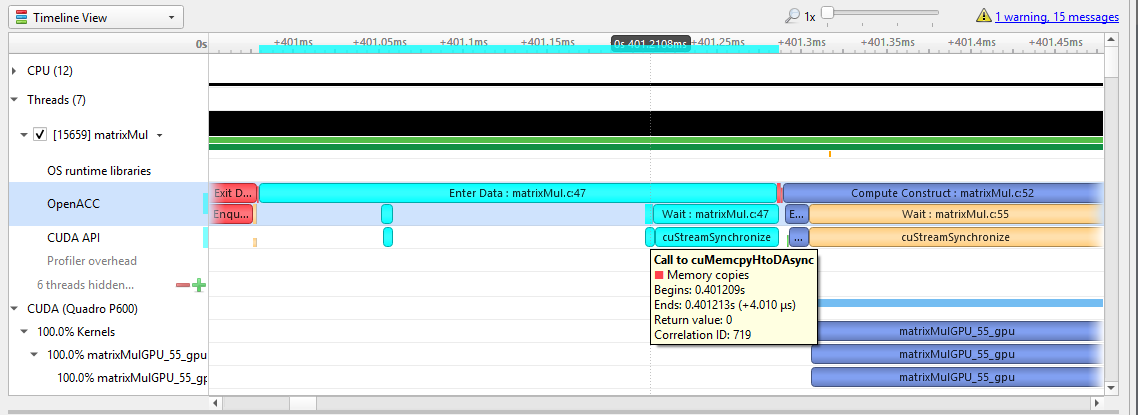
If the OpenACC API results in GPU work, that will also be highlighted:
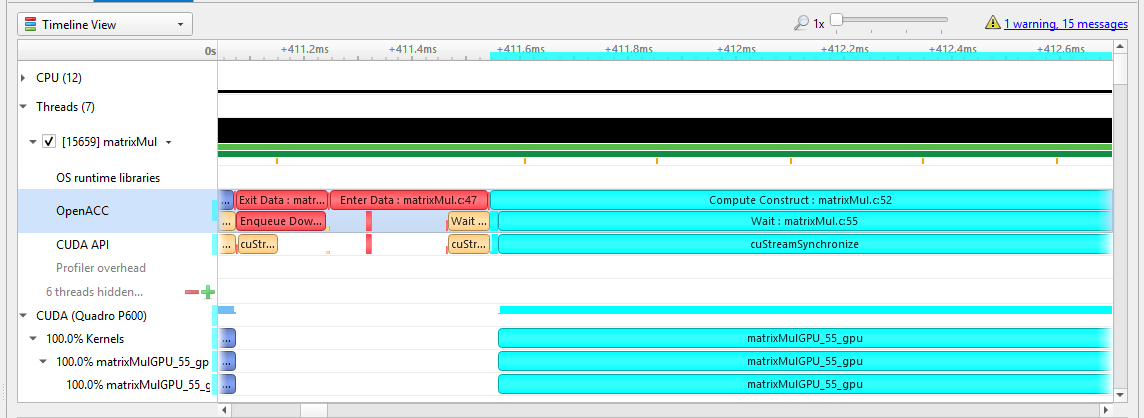
Hovering over a particular OpenACC construct will bring up a tooltip with details about that construct:
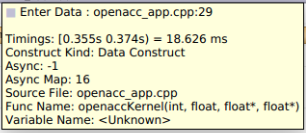
To capture OpenACC information from the Nsight Systems GUI, select the Collect OpenACC trace checkbox under Collect CUDA trace configurations. Note that turning on OpenACC tracing will also turn on CUDA tracing.
Please note that if your application crashes before all collected OpenACC trace data has been copied out, some or all data might be lost and not present in the report.
OpenGL Trace
OpenGL and OpenGL ES APIs can be traced to assist in the analysis of CPU and GPU interactions.
A few usage examples are:
Visualize how long
eglSwapBuffers(or similar) is taking.API trace can easily show correlations between thread state and graphics driver’s behavior, uncovering where the CPU may be waiting on the GPU.
Spot bubbles of opportunity on the GPU, where more GPU workload could be created.
Use
KHR_debugextension to trace GL events on both the CPU and GPU.
OpenGL trace feature in Nsight Systems consists of two different activities which will be shown in the CPU rows for those threads
CPU trace: interception of API calls that an application does to APIs (such as OpenGL, OpenGL ES, EGL, GLX, WGL, etc.).
GPU trace (or workload trace): trace of GPU workload (activity) triggered by use of OpenGL or OpenGL ES. Since draw calls are executed back-to-back, the GPU workload trace ranges include many OpenGL draw calls and operations in order to optimize performance overhead, rather than tracing each individual operation.
To collect GPU trace, the glQueryCounter() function is used to measure how much time batches of GPU workload take to complete.
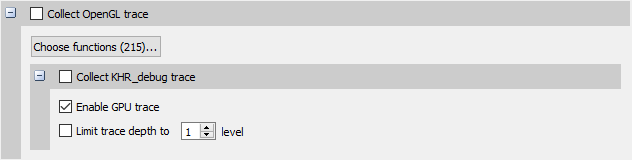
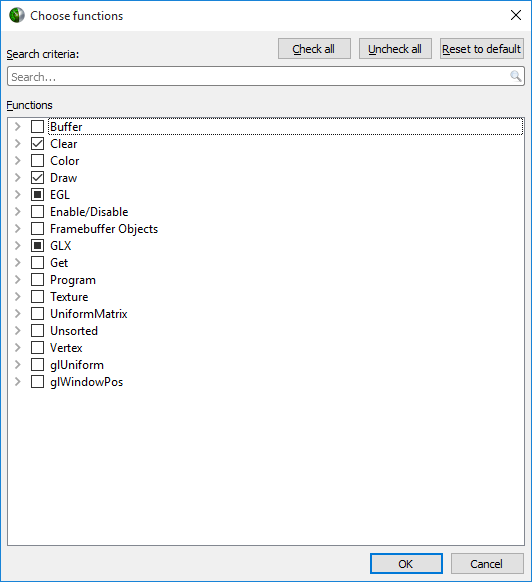
Ranges defined by the KHR_debug calls are represented similarly to OpenGL API and OpenGL GPU workload trace. GPU ranges in this case represent incremental draw cost. They cannot fully account for GPUs that can execute multiple draw calls in parallel. In this case, Nsight Systems will not show overlapping GPU ranges.
OpenGL Trace Using Command Line
For general information on using the target CLI, see CLI Profiling on Linux. For the CLI, the functions that are traced are set to the following list:
glWaitSync
glReadPixels
glReadnPixelsKHR
glReadnPixelsEXT
glReadnPixelsARB
glReadnPixels
glFlush
glFinishFenceNV
glFinish
glClientWaitSync
glClearTexSubImage
glClearTexImage
glClearStencil
glClearNamedFramebufferuiv
glClearNamedFramebufferiv
glClearNamedFramebufferfv
glClearNamedFramebufferfi
glClearNamedBufferSubDataEXT
glClearNamedBufferSubData
glClearNamedBufferDataEXT
glClearNamedBufferData
glClearIndex
glClearDepthx
glClearDepthf
glClearDepthdNV
glClearDepth
glClearColorx
glClearColorIuiEXT
glClearColorIiEXT
glClearColor
glClearBufferuiv
glClearBufferSubData
glClearBufferiv
glClearBufferfv
glClearBufferfi
glClearBufferData
glClearAccum
glClear
glDispatchComputeIndirect
glDispatchComputeGroupSizeARB
glDispatchCompute
glComputeStreamNV
glNamedFramebufferDrawBuffers
glNamedFramebufferDrawBuffer
glMultiDrawElementsIndirectEXT
glMultiDrawElementsIndirectCountARB
glMultiDrawElementsIndirectBindlessNV
glMultiDrawElementsIndirectBindlessCountNV
glMultiDrawElementsIndirectAMD
glMultiDrawElementsIndirect
glMultiDrawElementsEXT
glMultiDrawElementsBaseVertex
glMultiDrawElements
glMultiDrawArraysIndirectEXT
glMultiDrawArraysIndirectCountARB
glMultiDrawArraysIndirectBindlessNV
glMultiDrawArraysIndirectBindlessCountNV
glMultiDrawArraysIndirectAMD
glMultiDrawArraysIndirect
glMultiDrawArraysEXT
glMultiDrawArrays
glListDrawCommandsStatesClientNV
glFramebufferDrawBuffersEXT
glFramebufferDrawBufferEXT
glDrawTransformFeedbackStreamInstanced
glDrawTransformFeedbackStream
glDrawTransformFeedbackNV
glDrawTransformFeedbackInstancedEXT
glDrawTransformFeedbackInstanced
glDrawTransformFeedbackEXT
glDrawTransformFeedback
glDrawTexxvOES
glDrawTexxOES
glDrawTextureNV
glDrawTexsvOES
glDrawTexsOES
glDrawTexivOES
glDrawTexiOES
glDrawTexfvOES
glDrawTexfOES
glDrawRangeElementsEXT
glDrawRangeElementsBaseVertexOES
glDrawRangeElementsBaseVertexEXT
glDrawRangeElementsBaseVertex
glDrawRangeElements
glDrawPixels
glDrawElementsInstancedNV
glDrawElementsInstancedEXT
glDrawElementsInstancedBaseVertexOES
glDrawElementsInstancedBaseVertexEXT
glDrawElementsInstancedBaseVertexBaseInstanceEXT
glDrawElementsInstancedBaseVertexBaseInstance
glDrawElementsInstancedBaseVertex
glDrawElementsInstancedBaseInstanceEXT
glDrawElementsInstancedBaseInstance
glDrawElementsInstancedARB
glDrawElementsInstanced
glDrawElementsIndirect
glDrawElementsBaseVertexOES
glDrawElementsBaseVertexEXT
glDrawElementsBaseVertex
glDrawElements
glDrawCommandsStatesNV
glDrawCommandsStatesAddressNV
glDrawCommandsNV
glDrawCommandsAddressNV
glDrawBuffersNV
glDrawBuffersATI
glDrawBuffersARB
glDrawBuffers
glDrawBuffer
glDrawArraysInstancedNV
glDrawArraysInstancedEXT
glDrawArraysInstancedBaseInstanceEXT
glDrawArraysInstancedBaseInstance
glDrawArraysInstancedARB
glDrawArraysInstanced
glDrawArraysIndirect
glDrawArraysEXT
glDrawArrays
eglSwapBuffersWithDamageKHR
eglSwapBuffers
glXSwapBuffers
glXQueryDrawable
glXGetCurrentReadDrawable
glXGetCurrentDrawable
glGetQueryObjectuivEXT
glGetQueryObjectuivARB
glGetQueryObjectuiv
glGetQueryObjectivARB
glGetQueryObjectiv
Custom ETW Trace
Use the custom ETW trace feature to enable and collect any manifest-based ETW log. The collected events are displayed on the timeline on dedicated rows for each event type.
Custom ETW is available on Windows target machines.
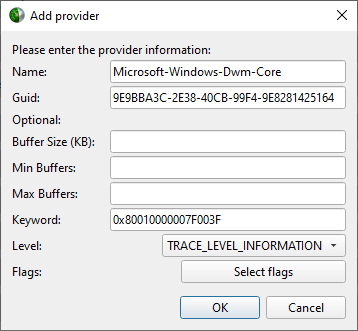
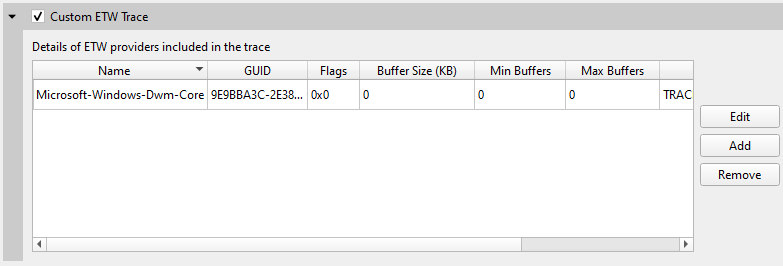
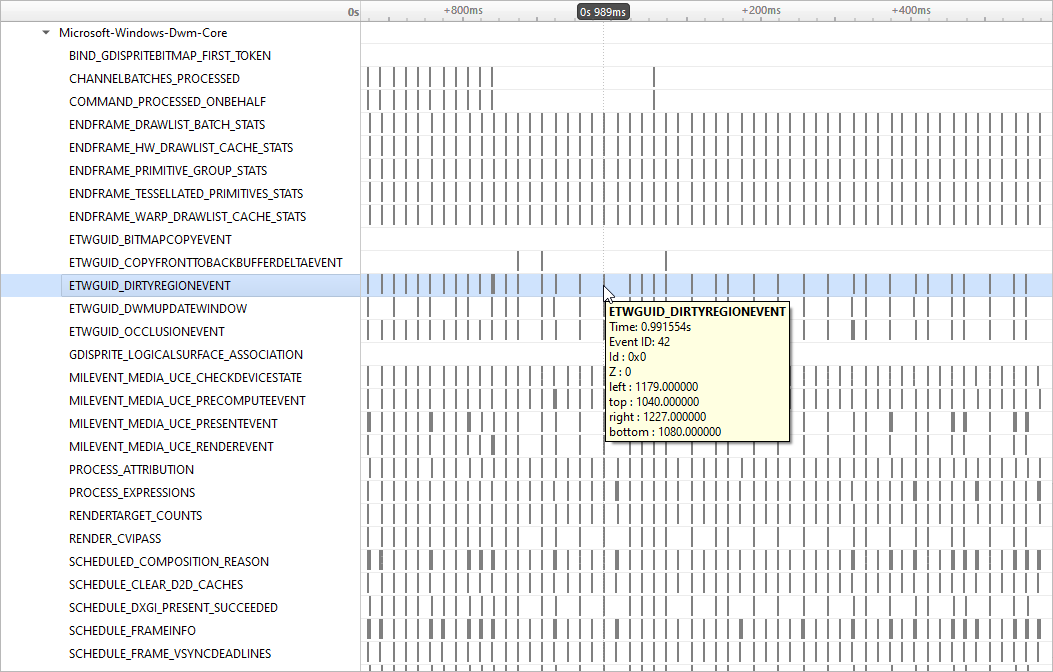
To retain the .etl trace files captured, so that they can be viewed in other tools (e.g. GPUView), change the “Save ETW log files in project folder” option under “Profile Behavior” in Nsight Systems’s global Options dialog. The .etl files will appear in the same folder as the .nsys-rep file, accessible by right-clicking the report in the Project Explorer and choosing “Show in Folder…”. Data collected from each ETW provider will appear in its own .etl file, and an additional .etl file named “Report XX-Merged-*.etl”, containing the events from all captured sources, will be created as well.
GPU Metrics
Overview
GPU Metrics feature is intended to identify performance limiters in applications using GPU for computations and graphics. It uses periodic sampling to gather performance metrics and detailed timing statistics associated with different GPU hardware units taking advantage of specialized hardware to capture this data in a single pass with minimal overhead.
Note: GPU Metrics will give you precise device level information, but it does not know which process or context is involved. GPU context switch trace provides less precise information, but will give you process and context information.
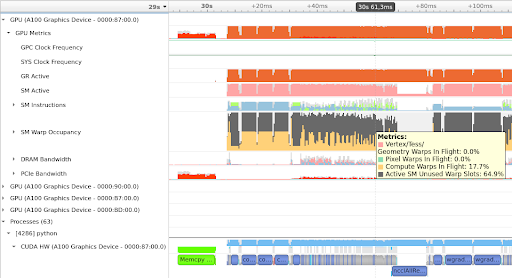
These metrics provide an overview of GPU efficiency over time within compute, graphics, and input/output (IO) activities such as:
IO throughputs: PCIe, NVLink, and GPU memory bandwidth
SM utilization: SMs activity, tensor core activity, instructions issued, warp occupancy, and unassigned warp slots
It is designed to help users answer the common questions:
Is my GPU idle?
Is my GPU full? Enough kernel grids size and streams? Are my SMs and warp slots full?
Am I using TensorCores?
Is my instruction rate high?
Am I possibly blocked on IO, or number of warps, etc
Nsight Systems GPU Metrics is only available for Linux targets on x86-64 and aarch64, and for Windows targets. It requires NVIDIA Turing architecture or newer.
Minimum required driver versions:
NVIDIA Turing architecture TU10x, TU11x - r440
NVIDIA Ampere architecture GA100 - r450
NVIDIA Ampere architecture GA100 MIG - r470 TRD1
NVIDIA Ampere architecture GA10x - r455
Note
Permissions: Elevated permissions are required. On Linux use sudo to elevate privileges. On Windows the user must run from an admin command prompt or accept the UAC escalation dialog. See Permissions Issues and Performance Counters for more information.
Note
Tensor Core: If you run nsys profile --gpu-metrics-device all, the Tensor Core utilization can be found in the GUI under the SM instructions/Tensor Active row.
Please note that it is not practical to expect a CUDA kernel to reach 100% Tensor Core utilization since there are other overheads. In general, the more computation-intensive an operation is, the higher Tensor Core utilization rate the CUDA kernel can achieve.
Launching GPU Metric from the CLI
GPU Metrics feature is controlled with 3 CLI switches:
--gpu-metrics-device=[all, none, <index>]selects GPUs to sample (default is none)--gpu-metrics-set=[<index>, <alias>]selects metric set to use (default is the 1st suitable from the list)--gpu-metrics-frequency=[10..200000]selects sampling frequency in Hz (default is 10000)
To profile with default options and sample GPU Metrics on GPU 0:
# Must have elevated permissions (see https://developer.nvidia.com/ERR_NVGPUCTRPERM) or be root (Linux) or Administrator (Windows)
$ nsys profile --gpu-metrics-device=0 ./my-app
To list available GPUs, use:
$ nsys profile --gpu-metrics-device=help
Possible --gpu-metrics-device values are:
    0: Quadro GV100 PCI[0000:17:00.0]
    1: GeForce RTX 2070 SUPER PCI[0000:65:00.0]
    all: Select all supported GPUs
    none: Disable GPU Metrics [Default]
By default, the first metric set which supports all selected GPUs is used. But you can manually select another metric set from the list. To see available metric sets, use:
$ nsys profile --gpu-metrics-set=help
Possible --gpu-metrics-set values are:
    [0] [tu10x]        General Metrics for NVIDIA TU10x (any frequency)
    [1] [tu11x]        General Metrics for NVIDIA TU11x (any frequency)
    [2] [ga100]        General Metrics for NVIDIA GA100 (any frequency)
    [3] [ga10x]        General Metrics for NVIDIA GA10x (any frequency)
    [4] [tu10x-gfxt]   Graphics Throughput Metrics for NVIDIA TU10x (frequency >= 10kHz)
    [5] [ga10x-gfxt]   Graphics Throughput Metrics for NVIDIA GA10x (frequency >= 10kHz)
    [6] [ga10x-gfxact] Graphics Async Compute Triage Metrics for NVIDIA GA10x (frequency >= 10kHz)
By default, sampling frequency is set to 10 kHz. But you can manually set it from 10 Hz to 200 kHz using
--gpu-metrics-frequency=<value>
Launching GPU Metrics from the GUI
For commands to launch GPU Metrics from the CLI with examples, see the CLI documentation.
When launching analysis in Nsight Systems, select Collect GPU Metrics.
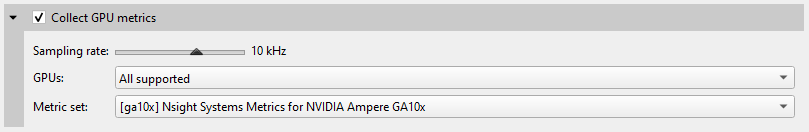
Select the GPUs dropdown to pick which GPUs you wish to sample.
Select the Metric set: dropdown to choose which available metric set you would like to sample.
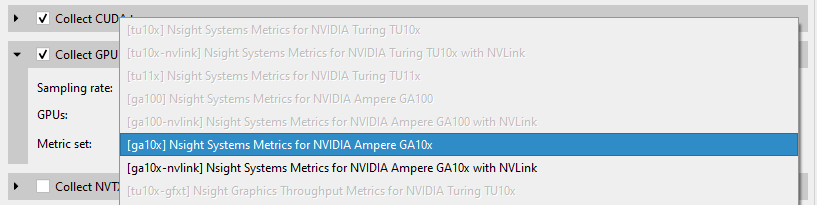
Note that metric sets for GPUs that are not being sampled will be greyed out.
Sampling frequency
Sampling frequency can be selected from the range of 10 Hz - 200 kHz. The default value is 10 kHz.
The maximum sampling frequency without buffer overflow events depends on GPU (SM count), GPU load intensity, and overall system load. The bigger the chip and the higher the load, the lower the maximum frequency. If you need higher frequency, you can increase it until you get “Buffer overflow” message in the Diagnostics Summary report page.
Each metric set has a recommended sampling frequency range in its description. These ranges are approximate. If you observe Inconsistent Data or Missing Data ranges on timeline, please try closer to the recommended frequency.
Available metrics
GPC Clock Frequency -
gpc__cycles_elapsed.avg.per_secondThe average GPC clock frequency in hertz. In public documentation the GPC clock may be called the “Application” clock, “Graphic” clock, “Base” clock, or “Boost” clock.
Note: The collection mechanism for GPC can result in a small fluctuation between samples.
SYS Clock Frequency -
sys__cycles_elapsed.avg.per_secondThe average SYS clock frequency in hertz. The GPU front end (command processor), copy engines, and the performance monitor run at the SYS clock. On Turing and NVIDIA GA100 GPUs the sampling frequency is based upon a period of SYS clocks (not time) so samples per second will vary with SYS clock. On NVIDIA GA10x GPUs the sampling frequency is based upon a fixed frequency clock. The maximum frequency scales linearly with the SYS clock.
GR Active -
gr__cycles_active.sum.pct_of_peak_sustained_elapsedThe percentage of cycles the graphics/compute engine is active. The graphics/compute engine is active if there is any work in the graphics pipe or if the compute pipe is processing work.
GA100 MIG - MIG is not yet supported. This counter will report the activity of the primary GR engine.
Sync Compute In Flight -
gr__dispatch_cycles_active_queue_sync.avg.pct_of_peak_sustained_elapsedThe percentage of cycles with synchronous compute in flight.
CUDA: CUDA will only report synchronous queue in the case of MPS configured with 64 sub-context. Synchronous refers to work submitted in VEID=0.
Graphics: This will be true if any compute work submitted from the direct queue is in flight.
Async Compute in Flight -
gr__dispatch_cycles_active_queue_async.avg.pct_of_peak_sustained_elapsedThe percentage of cycles with asynchronous compute in flight.
CUDA: CUDA will only report all compute work as asynchronous. The one exception is if MPS is configured and all 64 sub-context are in use. 1 sub-context (VEID=0) will report as synchronous.
Graphics: This will be true if any compute work submitted from a compute queue is in flight.
Draw Started -
fe__draw_count.avg.pct_of_peak_sustained_elapsedThe ratio of draw calls issued to the graphics pipe to the maximum sustained rate of the graphics pipe.
Note:The percentage will always be very low as the front end can issue draw calls significantly faster than the pipe can execute the draw call. The rendering of this row will be changed to help indicate when draw calls are being issued.
Dispatch Started -
gr__dispatch_count.avg.pct_of_peak_sustained_elapsedThe ratio of compute grid launches (dispatches) to the compute pipe to the maximum sustained rate of the compute pipe.
Note: The percentage will always be very low as the front end can issue grid launches significantly faster than the pipe can execute the draw call. The rendering of this row will be changed to help indicate when grid launches are being issued.
Vertex/Tess/Geometry Warps in Flight -
tpc__warps_active_shader_vtg_realtime.avg.pct_of_peak_sustained_elapsedThe ratio of active vertex, geometry, tessellation, and meshlet shader warps resident on the SMs to the maximum number of warps per SM as a percentage.
Pixel Warps in Flight -
tpc__warps_active_shader_ps_realtime.avg.pct_of_peak_sustained_elapsedThe ratio of active pixel/fragment shader warps resident on the SMs to the maximum number of warps per SM as a percentage.
Compute Warps in Flight -
tpc__warps_active_shader_cs_realtime.avg.pct_of_peak_sustained_elapsedThe ratio of active compute shader warps resident on the SMs to the maximum number of warps per SM as a percentage.
Active SM Unused Warp Slots -
tpc__warps_inactive_sm_active_realtime.avg.pct_of_peak_sustained_elapsedThe ratio of inactive warp slots on the SMs to the maximum number of warps per SM as a percentage. This is an indication of how many more warps may fit on the SMs if occupancy is not limited by a resource such as max warps of a shader type, shared memory, registers per thread, or thread blocks per SM.
Idle SM Unused Warp Slots -
tpc__warps_inactive_sm_idle_realtime.avg.pct_of_peak_sustained_elapsedThe ratio of inactive warps slots due to idle SMs to the the maximum number of warps per SM as a percentage.
This is an indicator that the current workload on the SM is not sufficient to put work on all SMs. This can be due to:
CPU starving the GPU
current work is too small to saturate the GPU
current work is trailing off but blocking next work
SM Active -
sm__cycles_active.avg.pct_of_peak_sustained_elapsedThe ratio of cycles SMs had at least 1 warp in flight (allocated on SM) to the number of cycles as a percentage. A value of 0 indicates all SMs were idle (no warps in flight). A value of 50% can indicate some gradient between all SMs active 50% of the sample period or 50% of SMs active 100% of the sample period.
SM Issue -
sm__inst_executed_realtime.avg.pct_of_peak_sustained_elapsedThe ratio of cycles that SM sub-partitions (warp schedulers) issued an instruction to the number of cycles in the sample period as a percentage.
Tensor Active -
sm__pipe_tensor_cycles_active_realtime.avg.pct_of_peak_sustained_elapsedThe ratio of cycles the SM tensor pipes were active issuing tensor instructions to the number of cycles in the sample period as a percentage.
TU102/4/6: This metric is not available on TU10x for periodic sampling. Please see Tensor Active/FP16 Active.
Tensor Active / FP16 Active -
sm__pipe_shared_cycles_active_realtime.avg.pct_of_peak_sustained_elapsedTU102/4/6 only
The ratio of cycles the SM tensor pipes or FP16x2 pipes were active issuing tensor instructions to the number of cycles in the sample period as a percentage.
DRAM Read Bandwidth -
dramc__read_throughput.avg.pct_of_peak_sustained_elapsed,dram__read_throughput.avg.pct_of_peak_sustained_elapsedVRAM Read Bandwidth -
FBPA.TriageA.dramc__read_throughput.avg.pct_of_peak_sustained_elapsed,FBSP.TriageSCG.dramc__read_throughput.avg.pct_of_peak_sustained_elapsed,FBSP.TriageAC.dramc__read_throughput.avg.pct_of_peak_sustained_elapsedThe ratio of cycles the DRAM interface was active reading data to the elapsed cycles in the same period as a percentage.
DRAM Write Bandwidth -
dramc__write_throughput.avg.pct_of_peak_sustained_elapsed,dram__write_throughput.avg.pct_of_peak_sustained_elapsedVRAM Write Bandwidth -
FBPA.TriageA.dramc__write_throughput.avg.pct_of_peak_sustained_elapsed,FBSP.TriageSCG.dramc__write_throughput.avg.pct_of_peak_sustained_elapsed,FBSP.TriageAC.dramc__write_throughput.avg.pct_of_peak_sustained_elapsedThe ratio of cycles the DRAM interface was active writing data to the elapsed cycles in the same period as a percentage.
NVLink bytes received -
nvlrx__bytes.avg.pct_of_peak_sustained_elapsedThe ratio of bytes received on the NVLink interface to the maximum number of bytes receivable in the sample period as a percentage. This value includes protocol overhead.
NVLink bytes transmitted -
nvltx__bytes.avg.pct_of_peak_sustained_elapsedThe ratio of bytes transmitted on the NVLink interface to the maximum number of bytes transmittable in the sample period as a percentage. This value includes protocol overhead.
PCIe Read Throughput -
pcie__read_bytes.avg.pct_of_peak_sustained_elapsedThe ratio of bytes received on the PCIe interface to the maximum number of bytes receivable in the sample period as a percentage. The theoretical value is calculated based upon the PCIe generation and number of lanes. This value includes protocol overhead.
PCIe Write Throughput -
pcie__write_bytes.avg.pct_of_peak_sustained_elapsedThe ratio of bytes transmitted on the PCIe interface to the maximum number of bytes receivable in the sample period as a percentage. The theoretical value is calculated based upon the PCIe generation and number of lanes. This value includes protocol overhead.
PCIe Read Requests to BAR1 -
pcie__rx_requests_aperture_bar1_op_read.sumPCIe Write Requests to BAR1 -
pcie__rx_requests_aperture_bar1_op_write.sumBAR1 is a PCI Express (PCIe) interface used to allow the CPU or other devices to directly access GPU memory. The GPU normally transfers memory with its copy engines, which would not show up as BAR1 activity. The GPU drivers on the CPU do a small amount of BAR1 accesses, but heavier traffic is typically coming from other technologies.
On Linux, technologies like GPU Direct, GPU Direct RDMA, and GPU Direct Storage transfer data across PCIe BAR1. In the case of GPU Direct RDMA, that would be an Ethernet or InfiniBand adapter directly writing to GPU memory.
On Windows, Direct3D12 resources can also be made accessible directly to the CPU via NVAPI functions to support small writes or reads from GPU buffers, in this case too many BAR1 accesses can indicate a performance issue, like it has been demonstrated in the Optimizing DX12 Resource Uploads to the GPU Using CPU-Visible VRAM technical blog post.
Exporting and Querying Data
It is possible to access metric values for automated processing using the Nsight Systems CLI export capabilities.
An example that extracts values of “SM Active”:
$ nsys export -t sqlite report.nsys-rep
$ sqlite3 report.sqlite "SELECT rawTimestamp, CAST(JSON_EXTRACT(data, '$.\"SM Active\"') as INTEGER) as value FROM GENERIC_EVENTS WHERE value != 0 LIMIT 10"

309277039|80
309301295|99
309325583|99
309349776|99
309373872|60
309397872|19
309421840|100
309446000|100
309470096|100
309494161|99
An overview of data stored in each event (JSON):
$ sqlite3 report.sqlite "SELECT data FROM GENERIC_EVENTS LIMIT 1"
{
"Unallocated Warps in Active SM": "0",
"Compute Warps In Flight": "52",
"Pixel Warps In Flight": "0",
"Vertex\/Tess\/Geometry Warps In Flight": "0",
"Total SM Occupancy": "52",
"GR Active (GE\/CE)": "100",
"Sync Compute In Flight": "0",
"Async Compute In Flight": "98",
"NVLink bytes received": "0",
"NVLink bytes transmitted": "0",
"PCIe Rx Throughput": "0",
"PCIe Tx Throughput": "1",
"DRAM Read Throughput": "0",
"DRAM Write Throughput": "0",
"Tensor Active \/ FP16 Active": "0",
"SM Issue": "10",
"SM Active": "52"
}
Values are integer percentages (0..100)
Limitations
If metric sets with NVLink are used but the links are not active, they may appear as fully utilized.
Only one tool that subscribes to these counters can be used at a time, therefore, Nsight Systems GPU Metrics feature cannot be used at the same time as the following tools:
Nsight Graphics
Nsight Compute
DCGM (Data Center GPU Manager)
Use the following command:
dcgmi profile --pausedcgmi profile --resume
Or API:
dcgmProfPausedcgmProfResume
Non-NVIDIA products which use:
CUPTI sampling used directly in the application. CUPTI trace is okay (although it will block Nsight Systems CUDA trace)
DCGM library
Nsight Systems limits the amount of memory that can be used to store GPU Metrics samples. Analysis with higher sampling rates or on GPUs with more SMs has a risk of exceeding this limit. This will lead to gaps on timeline filled with
Missing Dataranges. Future releases will reduce the frequency of this happening.
CPU Profiling Using Linux OS Perf Subsystem
Nsight Systems on Linux targets, utilizes the Linux OS’ perf subsystem to sample CPU Instruction Pointers (IPs) and backtraces, trace CPU context switches, and sample CPU and OS event counts. The Linux perf tool utilizes the same perf subsystem.
Nsight Systems, on L4T and potentially other ARM targets, may use a custom kernel module to collect the same data. The Nsight Systems CLI command nsys status --environment indicates when the kernel module is used instead of the Linux OS’ perf subsystem.
Features
CPU Instruction Pointer / Backtrace Sampling
Nsight Systems can sample CPU Instruction Pointers / backtraces periodically. The collection of a sample is triggered by a hardware event overflow - e.g. a sample is collected after every 1 million CPU reference cycles on a per thread basis. In the GUI, samples are shown on the individual thread timelines, in the Event Viewer, and in the Top Down, Bottom Up, or Flat views which provide histogram-like summaries of the data. IP / backtrace collections can be configured in process-tree or system-wide mode. In process-tree mode, Nsight Systems will sample the process, and any of its descendants, launched by the tool. In system-wide mode, Nsight Systems will sample all processes running on the system, including any processes launched by the tool.
CPU Context Switch Tracing
Nsight Systems can trace every time the OS schedules a thread on a logical CPU and every time the OS thread gets unscheduled from a logical CPU. The data is used to show CPU utilization and OS thread utilization within the Nsight Systems GUI. Context switch collections can be configured in process-tree or system-wide mode. In process-tree mode, Nsight Systems will trace the process, and any of its descendants, launched by Nsight Systems. In system-wide mode, Nsight Systems will trace all processes running on the system, including any processes launched by the Nsight Systems.
CPU Event Sampling
Nsight Systems can periodically sample CPU hardware event counts and OS event counts and show the event’s rate over time in the Nsight Systems GUI. Event sample collections can be configured in system-wide mode only. In system-wide mode, Nsight Systems will sample event counts of all CPUs and the OS event counts running on the system. Event counts are not directly associated with processes or threads.
System Requirements
Paranoid Level
The system’s paranoid level must be 2 or lower.
Paranoid Level |
CPU IP/backtrace Sampling process-tree mode |
CPU IP/backtrace Sampling system-wide mode |
CPU Context Switch Tracing process-tree mode |
CPU Context Switch Tracing system-wide mode |
Event Sampling system-wide mode |
|---|---|---|---|---|---|
3 or greater |
not available |
not available |
not available |
not available |
not available |
2 |
User mode IP/backtrace samples only |
not available |
available |
not available |
not available |
1 |
Kernel and user mode IP/backtrace samples |
not available |
available |
not available |
not available |
0, -1 |
Kernel and user mode IP/backtrace samples |
Kernel and user mode IP/backtrace samples |
available |
available |
hardware and OS events |
Kernel Version
To support the CPU profiling features utilized by Nsight Systems, the kernel version must be greater than or equal to v4.3. RedHat has backported the required features to the v3.10.0-693 kernel. RedHat distros and their derivatives (e.g. CentOS) require a 3.10.0-693 or later kernel. Use the
uname -rcommand to check the kernel’s version.perf_event_open syscall
The perf_event_open syscall needs to be available. When running within a Docker container, the default seccomp settings will normally block the perf_event_open syscall. To workaround this issue, use the Docker
run --privilegedswitch when launching the docker or modify the docker’s seccomp settings. Some VMs (virtual machines), e.g. AWS, may also block the perf_event_open syscall.Sampling Trigger
In some rare case, a sampling trigger is not available. The sampling trigger is either a hardware or software event that causes a sample to be collected. Some VMs block hardware events from being accessed and therefore, prevent hardware events from being used as sampling triggers. In those cases, Nsight Systems will fall back to using a software trigger if possible.
Checking Your Target System
Use the
nsys status --environmentcommand to check if a system meets the Nsight Systems CPU profiling requirements. Example output from this command is shown below. Note that this command does not check for Linux capability overrides - i.e. if the user or executable files have CAP_SYS_ADMIN or CAP_PERFMON capability. Also, note that this command does not indicate if system-wide mode can be used.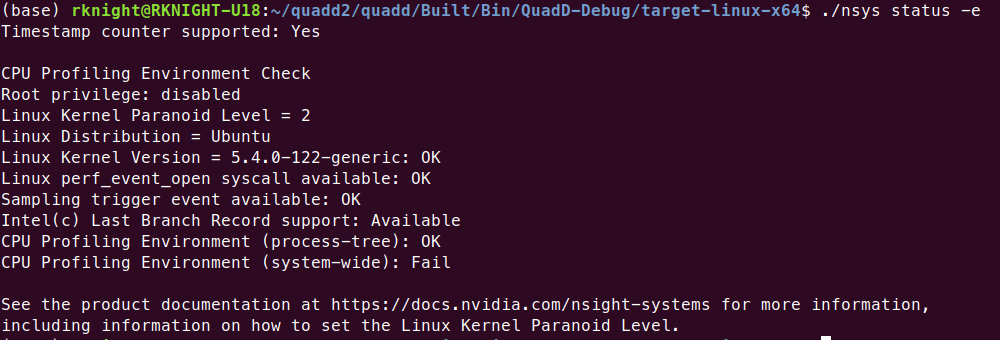
Configuring a CPU Profiling Collection
When configuring Nsight Systems for CPU Profiling from the CLI, use some or all of the following options: --sample, --cpuctxsw, --event-sample, --backtrace, --cpu-core-events, --event-sampling-frequency, --os-events, --samples-per-backtrace, and --sampling-period.
Details about these options, including examples can be found in the Profiling from the CLI section of the User Guide
When configuring from the GUI, the following options are available:
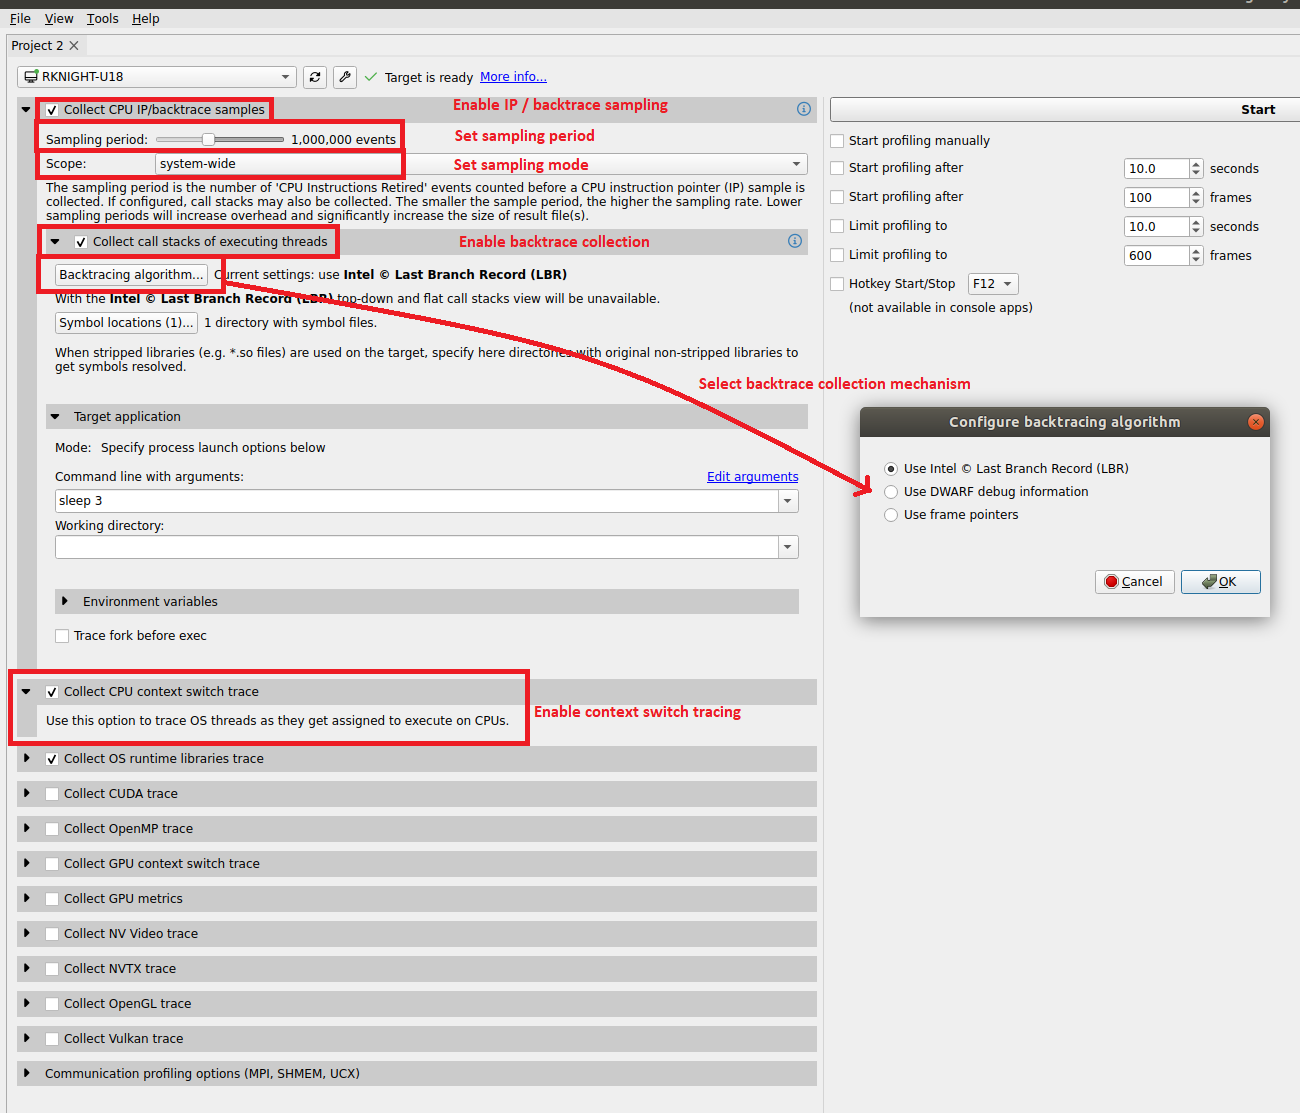
The configuration used during CPU profiling is documented in the Analysis Summary:
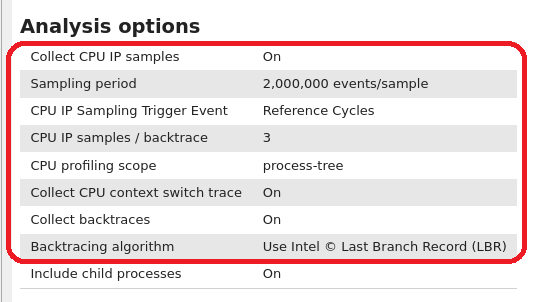
As well as in the Diagnosics Summary:
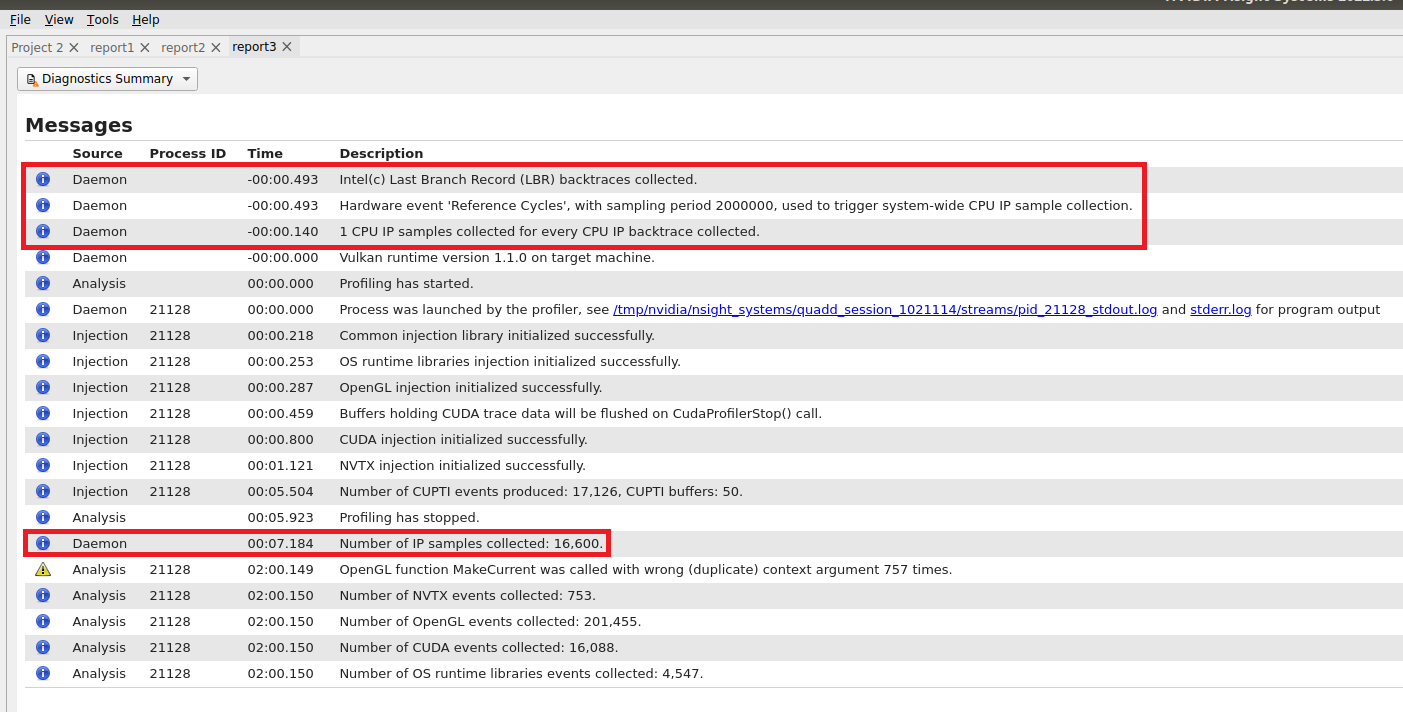
Visualizing CPU Profiling Results
Here are example screenshots visualizing CPU profiling results. For details about navigating the Timeline View and the backtraces, see the section on Timeline View in the Reading Your Report in the GUI section of the User Guide.
Example of CPU IP/Backtrace Data
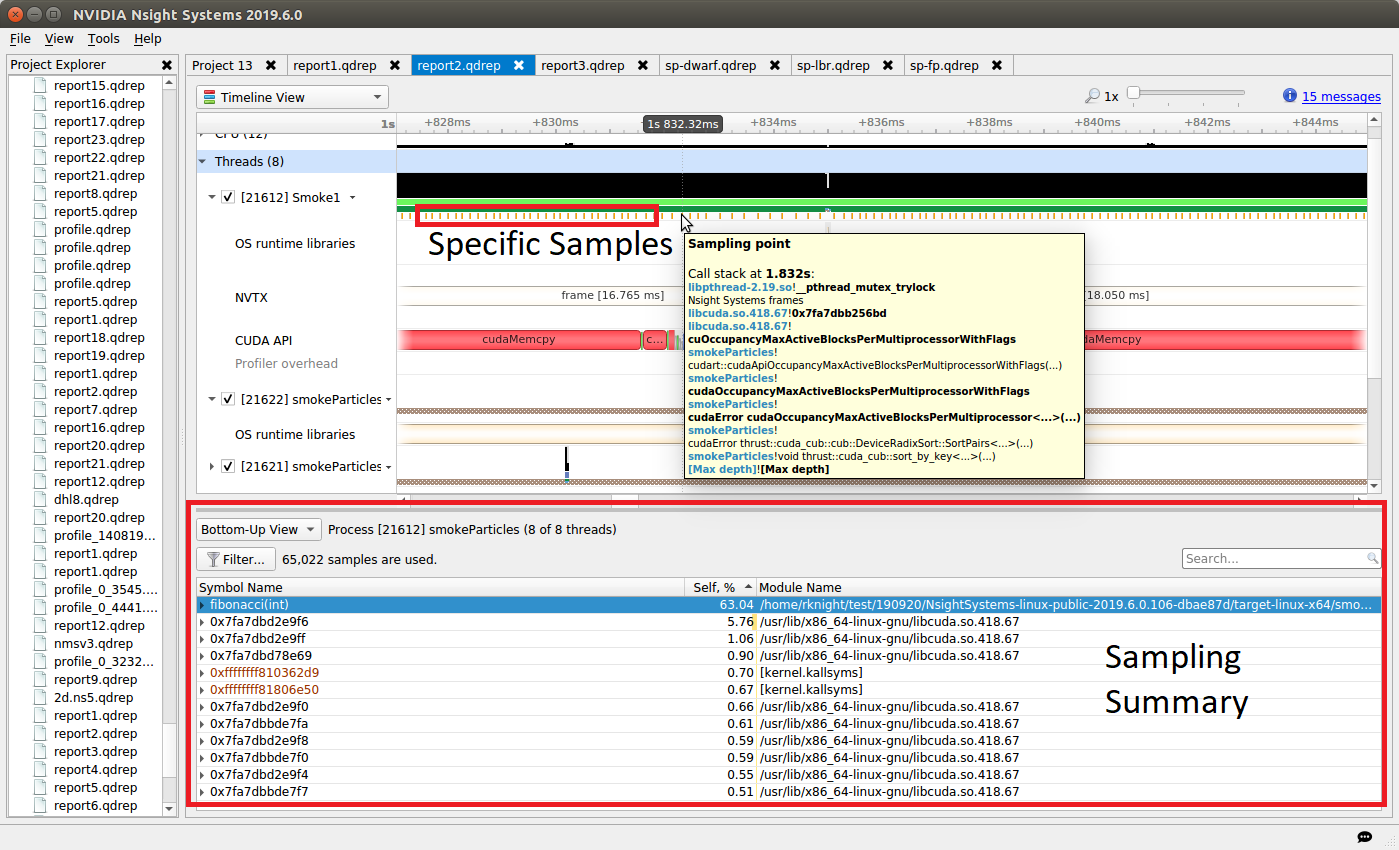
In the timeline, yellow-orange marks can be found under each thread’s timeline that indicate the moment an IP / backtrace sample was collected on that thread (e.g. see the yellow-orange marks in the Specific Samples box above). Hovering the cursor over a mark will cause a tooltip to display the backtrace for that sample.
Below the Timeline is a drop-down list with multiple options including Events View, Top-Down View, Bottom-Up View, and Flat View. All four of these views can be used to view CPU IP / back trace sampling data.
Example of Event Sampling
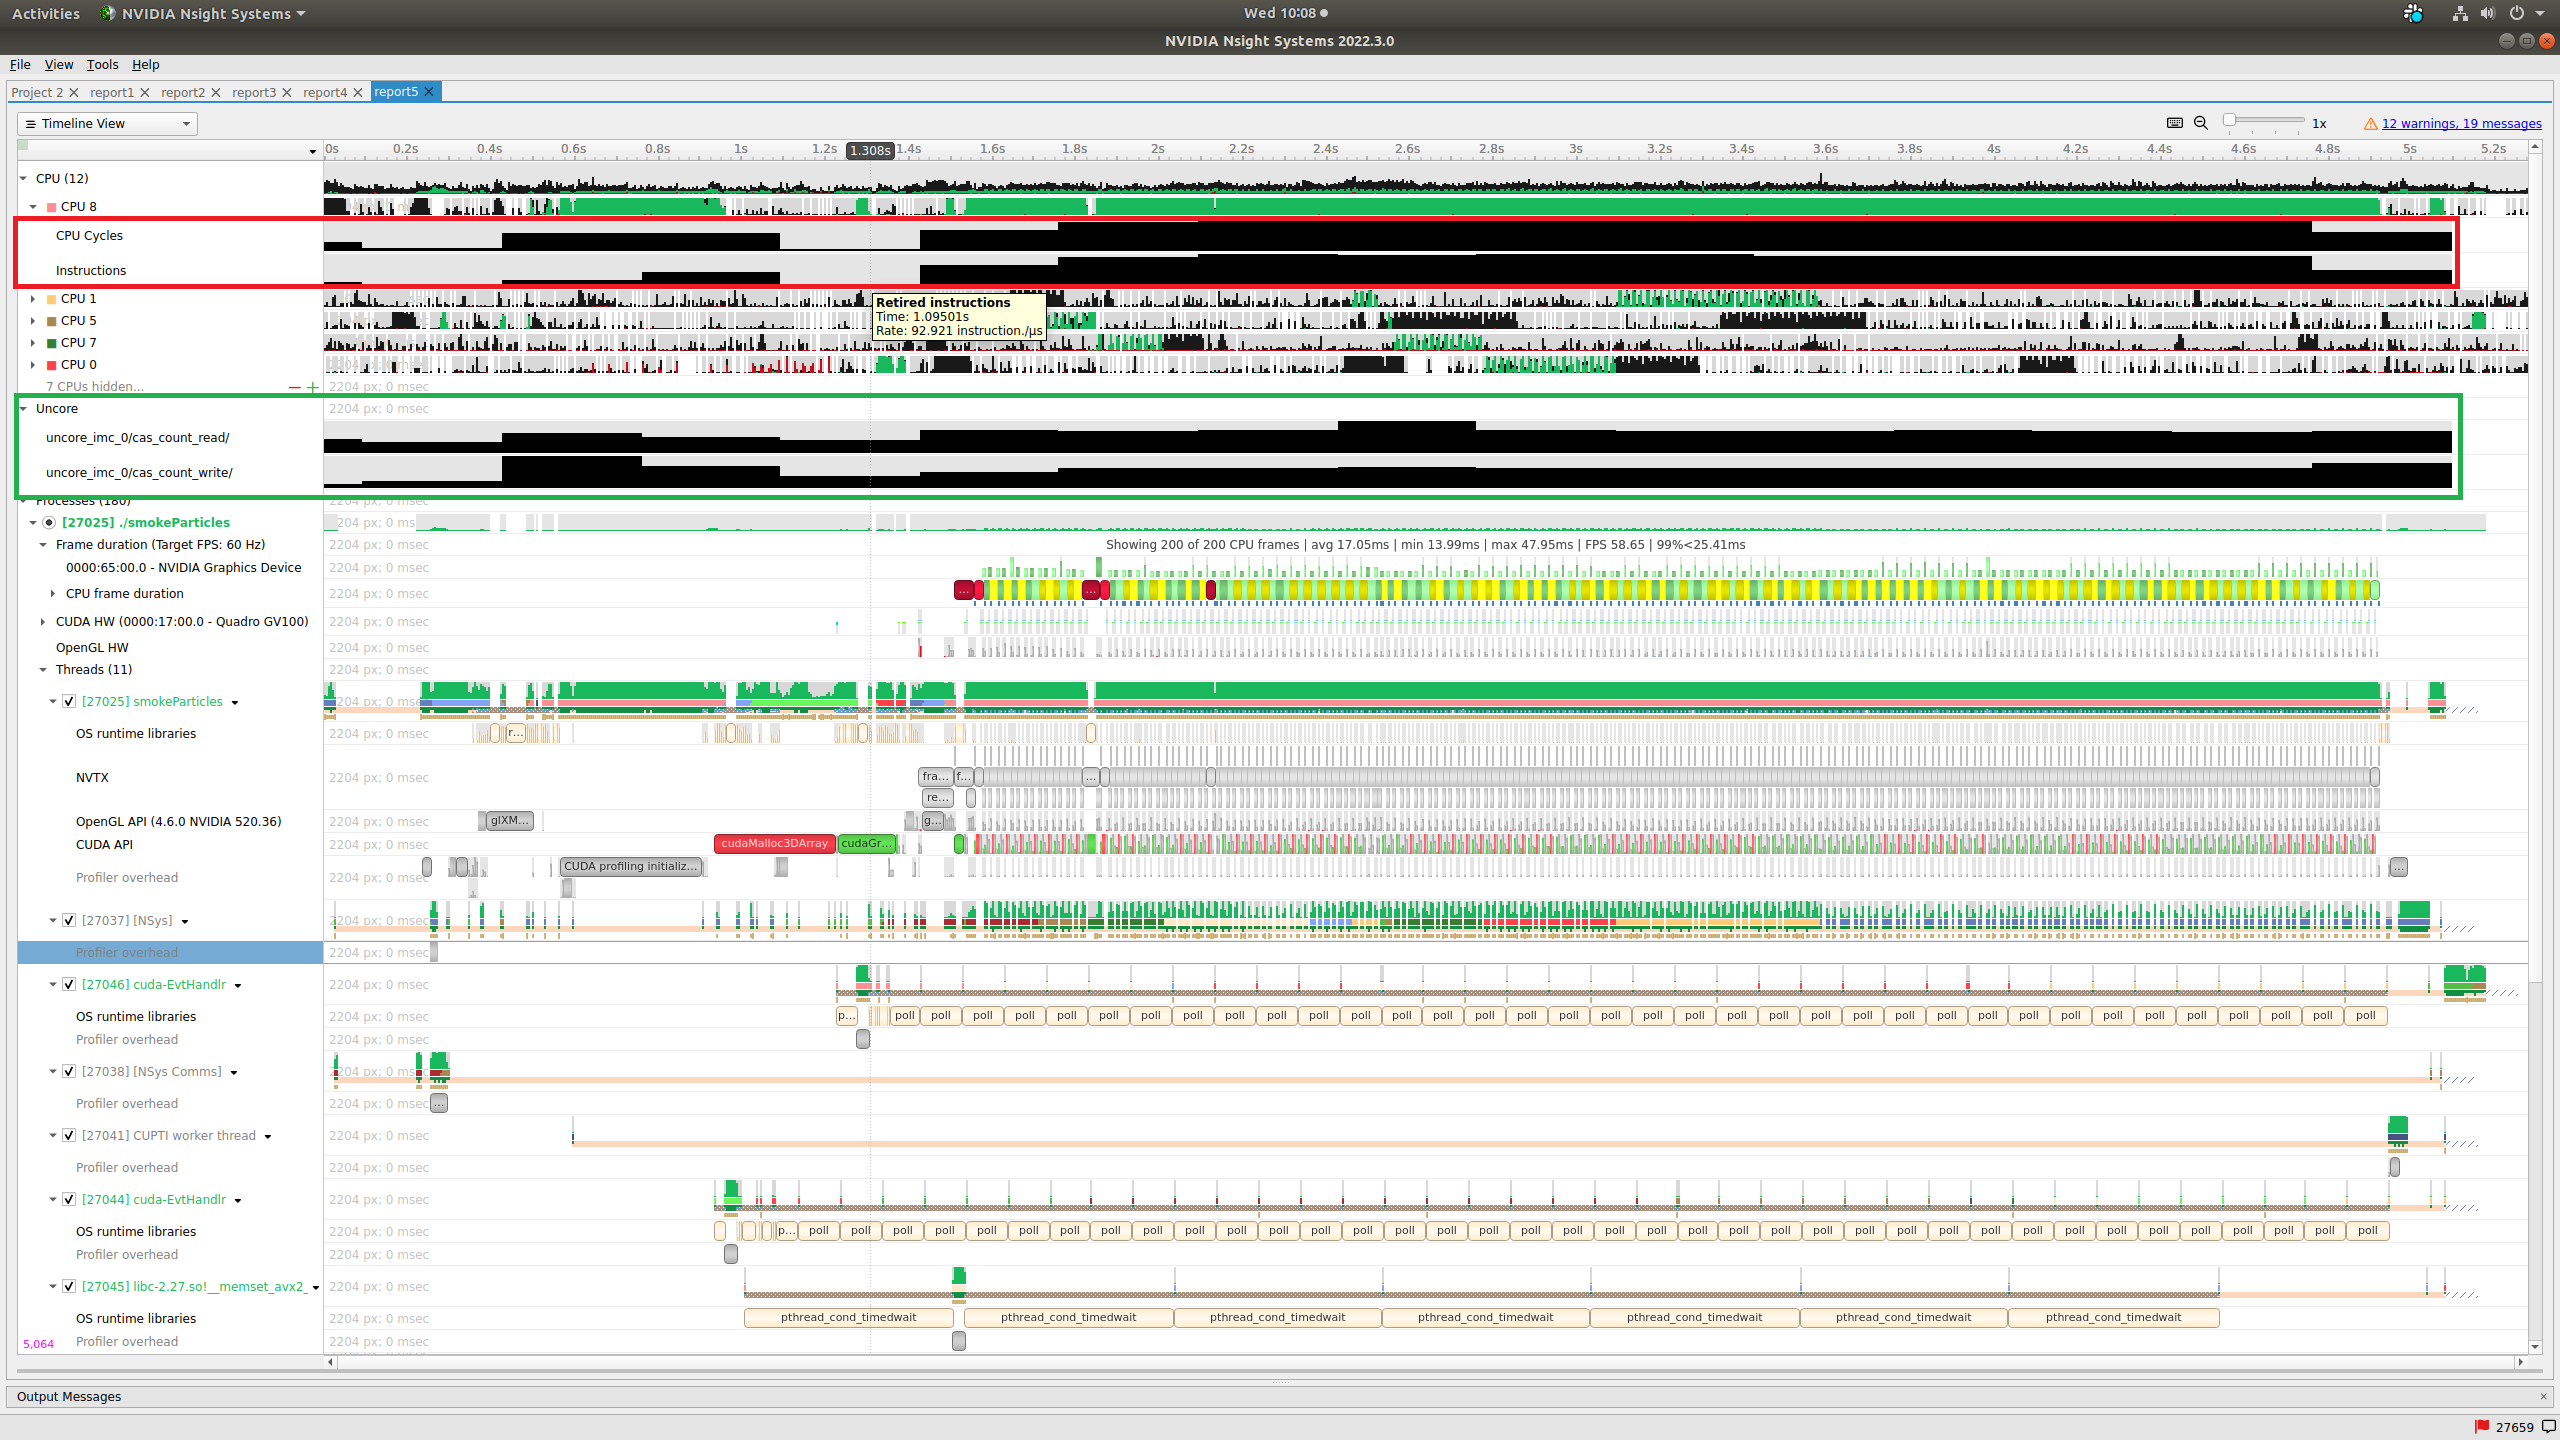
Event sampling samples hardware or software event counts during a collection and then graphs those events as rates on the Timeline. The above screenshot shows 4 hardware events. Core and cache events are graphed under the associated CPU row (see the red box in the screenshot) while uncore and OS events are graphed in their own row (see the green box in the screenshot). Hovering the cursor over an event sampling row in the timeline shows the event’s rate at that moment.
Common Issues
Reducing Overhead Caused By Sampling
There are several ways to reduce overhead caused by sampling.
disable sampling (i.e. use the
--sampling=noneswitch)increase the sampling period (i.e. reduce the sampling rate) using the
--sampling-periodswitchstop collecting backtraces (i.e. use the
--backtrace=noneswitch) or collect more efficient backtraces - if available, use the--backtrace=lbrswitch.reduce the number of backtraces collected per sample. See documentation for the
--samples-per-backtraceswitch.
Throttling
The Linux operating system enforces a maximum time to handle sampling interrupts. This means that if collecting samples takes more than a specified amount of time, the OS will throttle (i.e slow down) the sampling rate to prevent the perf subsystem from causing too much overhead. When this occurs, sampling data may become irregular even though the thread is very busy.
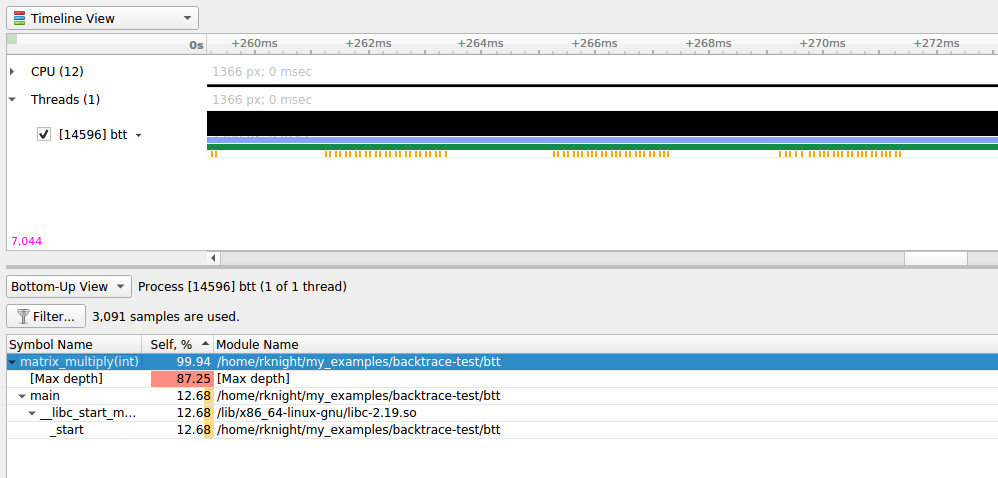
The above screenshot shows a case where CPU IP / backtrace sampling was throttled during a collection. Note the irregular intervals of sampling tickmarks on the thread timeline. The number of times a collection throttled is provided in the Nsight Systems GUI’s Diagnostics messages. If a collection throttles frequently (e.g. 1000s of times), increasing the sampling period should help reduce throttling.
Note
When throttling occurs, the OS sets a new (lower) maximum sampling rate in the procfs. This value must be reset before the sampling rate can be increased again. Use the following command to reset the OS’ max sampling rate
echo '100000' | sudo tee /proc/sys/kernel/perf_event_max_sample_rateSample intervals are irregular
My samples are not periodic - why? My samples are clumped up - why? There are gaps in between the samples - why? Likely reasons:
Throttling, as described above
The paranoid level is set to 2. If the paranoid level is set to 2, anytime the workload makes a system call and spends time executing kernel mode code, samples will not be collected and there will be gaps in the sampling data.
The sampling trigger itself is not periodic. If the trigger event is not periodic, for example, the Instructions Retired. event, sample collection will primarily occur when cache misses are occurring.
No CPU profiling data is collected
There are a few common issues that cause CPU profiling data to not be collected
System requirements are not met. Check your system settings with the
nsys status --environmentcommand and see the System Requirements section above.I profiled my workload in a Docker container but no sampling data was collected. By default, Docker containers prevent the perf_event_open syscall from being utilized. To override this behavior, launch the Docker with the
--privilegedswitch or modify the Docker’s seccompsettings.I profiled my workload in a Docker container running Ubuntu 20+ running on top of a host system running CentOS with a kernel version < 3.10.0-693. The
nsys status --environmentcommand indicated that CPU profiling was supported. The host OS kernel version determines if CPU profiling is allowed and a CentOS host with a version < 3.10.0-693 is too old. In this case, thensys status --environmentcommand is incorrect.
NVIDIA Video Codec SDK Trace
Nsight Systems for x86 Linux and Windows targets can trace calls from the NV Video Codec SDK. This software trace can be launched from the GUI or using the --trace nvvideo from the CLI
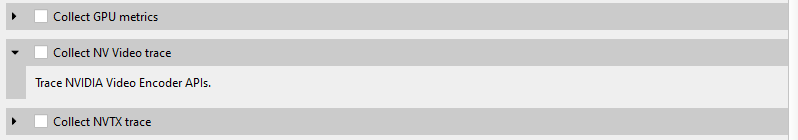
On the timeline, calls on the CPU to the NV Encoder API and NV Decoder API will be shown.
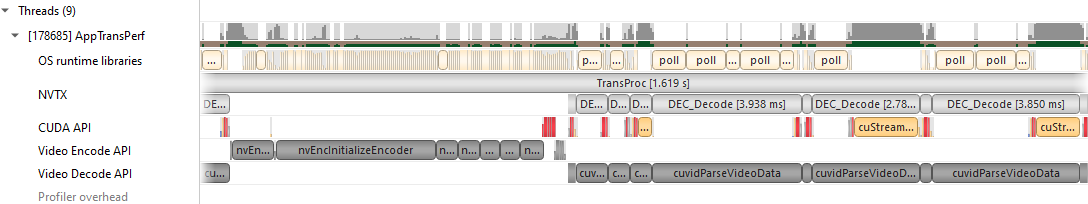
NV Encoder API Functions Traced by Default
NvEncodeAPICreateInstance
nvEncOpenEncodeSession
nvEncGetEncodeGUIDCount
nvEncGetEncodeGUIDs
nvEncGetEncodeProfileGUIDCount
nvEncGetEncodeProfileGUIDs
nvEncGetInputFormatCount
nvEncGetInputFormats
nvEncGetEncodeCaps
nvEncGetEncodePresetCount
nvEncGetEncodePresetGUIDs
nvEncGetEncodePresetConfig
nvEncGetEncodePresetConfigEx
nvEncInitializeEncoder
nvEncCreateInputBuffer
nvEncDestroyInputBuffer
nvEncCreateBitstreamBuffer
nvEncDestroyBitstreamBuffer
nvEncEncodePicture
nvEncLockBitstream
nvEncUnlockBitstream
nvEncLockInputBuffer
nvEncUnlockInputBuffer
nvEncGetEncodeStats
nvEndGetSequenceParams
nvEncRegisterAsyncEvent
nvEncUnregisterAsyncEvent
nvEncMapInputResource
nvEncUnmapInputResource
nvEncDestroyEncoder
nvEncInvalidateRefFrames
nvEncOpenEncodeSessionEx
nvEncRegisterResource
nvEncUnregisterResource
nvEncReconfigureEncoder
nvEncCreateMVBuffer
nvEncDestroyMVBuffer
nvEncRunMotionEstimationOnly
nvEncGetLastErrorString
nvEncSetIOCudaStreams
nvEncGetSequenceParamEx
NV Decoder API Functions Traced by Default
cuvidCreateVideoSource
cuvidCreateVideoSourceW
cuvidDestroyVideoSource
cuvidSetVideoSourceState
cudaVideoState
cuvidGetSourceVideoFormat
cuvidGetSourceAudioFormat
cuvidCreateVideoParser
cuvidParseVideoData
cuvidDestroyVideoParser
cuvidCreateDecoder
cuvidDestroyDecoder
cuvidDecodePicture
cuvidGetDecodeStatus
cuvidReconfigureDecoder
cuvidMapVideoFrame
cuvidUnmapVideoFrame
cuvidMapVideoFrame64
cuvidUnmapVideoFrame64
cuvidCtxLockCreate
cuvidCtxLockDestroy
cuvidCtxLock
cuvidCtxUnlock
NV JPEG API Functions Traced by Default
nvjpegBufferDeviceCreate
nvjpegBufferDeviceDestroy
nvjpegBufferDeviceRetrieve
nvjpegBufferPinnedCreate
nvjpegBufferPinnedDestroy
nvjpegBufferPinnedRetrieve
nvjpegCreate
nvjpegCreateEx
nvjpegCreateSimple
nvjpegDecode
nvjpegDecodeBatched
nvjpegDecodeBatchedEx
nvjpegDecodeBatchedInitialize
nvjpegDecodeBatchedPreAllocate
nvjpegDecodeBatchedSupported
nvjpegDecodeBatchedSupportedEx
nvjpegDecodeJpeg
nvjpegDecodeJpegDevice
nvjpegDecodeJpegHost
nvjpegDecodeJpegTransferToDevice
nvjpegDecodeParamsCreate
nvjpegDecodeParamsDestroy
nvjpegDecodeParamsSetAllowCMYK
nvjpegDecodeParamsSetOutputFormat
nvjpegDecodeParamsSetROI
nvjpegDecodeParamsSetScaleFactor
nvjpegDecoderCreate
nvjpegDecoderDestroy
nvjpegDecoderJpegSupported
nvjpegDecoderStateCreate
nvjpegDestroy
nvjpegEncodeGetBufferSize
nvjpegEncodeImage
nvjpegEncodeRetrieveBitstream
nvjpegEncodeRetrieveBitstreamDevice
nvjpegEncoderParamsCopyHuffmanTables
nvjpegEncoderParamsCopyMetadata
nvjpegEncoderParamsCopyQuantizationTables
nvjpegEncoderParamsCreate
nvjpegEncoderParamsDestroy
nvjpegEncoderParamsSetEncoding
nvjpegEncoderParamsSetOptimizedHuffman
nvjpegEncoderParamsSetQuality
nvjpegEncoderParamsSetSamplingFactors
nvjpegEncoderStateCreate
nvjpegEncoderStateDestroy
nvjpegEncodeYUV,(nvjpegHandle_t handle
nvjpegGetCudartProperty
nvjpegGetDeviceMemoryPadding
nvjpegGetImageInfo
nvjpegGetPinnedMemoryPadding
nvjpegGetProperty
nvjpegJpegStateCreate
nvjpegJpegStateDestroy
nvjpegJpegStreamCreate
nvjpegJpegStreamDestroy
nvjpegJpegStreamGetChromaSubsampling
nvjpegJpegStreamGetComponentDimensions
nvjpegJpegStreamGetComponentsNum
nvjpegJpegStreamGetFrameDimensions
nvjpegJpegStreamGetJpegEncoding
nvjpegJpegStreamParse
nvjpegJpegStreamParseHeader
nvjpegSetDeviceMemoryPadding
nvjpegSetPinnedMemoryPadding
nvjpegStateAttachDeviceBuffer
nvjpegStateAttachPinnedBuffer
Network Communication Profiling
Nsight Systems can be used to profiles several popular network communication protocols. To enable this, please select the Communication profiling options dropdown.
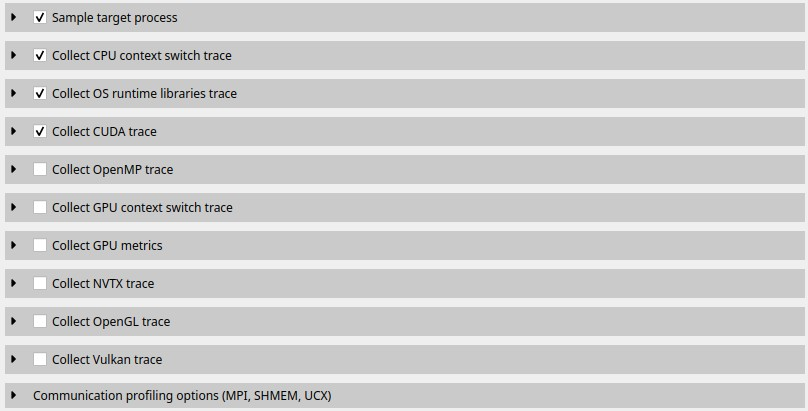
Then select the libraries you would like to trace:
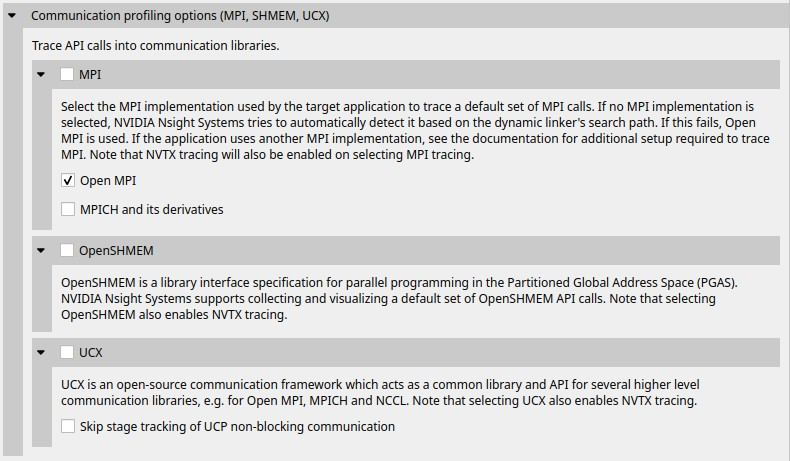
MPI API Trace
For Linux x86_64, ARM and Power targets, Nsight Systems is capable of capturing information about the MPI APIs executed in the profiled process. It has built-in API trace support for Open MPI and MPICH based MPI implementations.
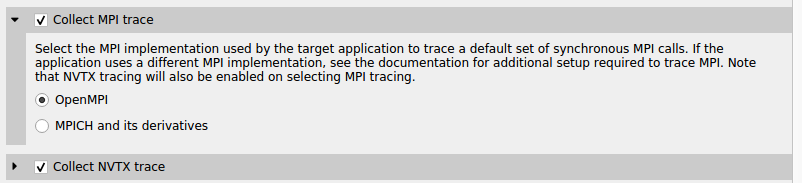
Only a subset of the MPI API, including blocking and non-blocking point-to-point and collective communication, and file I/O operations, is traced. If you require more control over the list of traced APIs or if you are using a different MPI implementation, you can use the NVTX wrappers for MPI. If you set the environment variable LD_PRELOAD to the path of generated wrapper library, Nsight Systems will capture and report the MPI API trace information when NVTX tracing is enabled. Choose an NVTX domain name other than “MPI”, since it is filtered out by Nsight Systems when MPI tracing is not enabled.
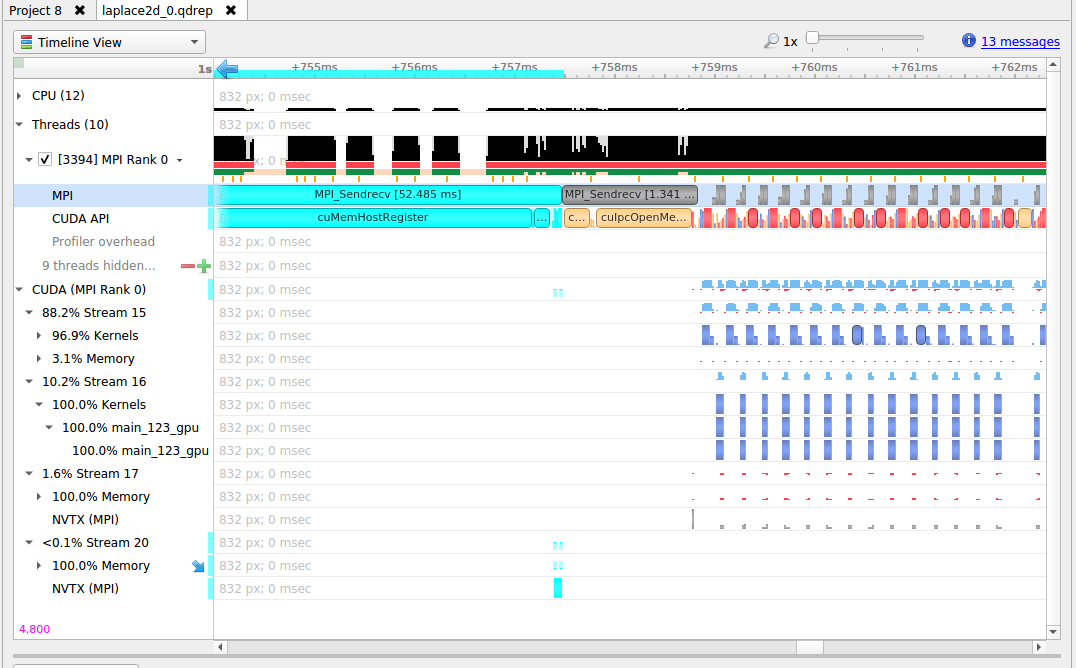
MPI Communication Parameters
Nsight Systems can get additional information about MPI communication parameters. Currently, the parameters are only visible in the mouseover tooltips or in the eventlog. This means that the data is only available via the GUI. Future versions of the tool will export this information into the SQLite data files for postrun analysis.
In order to fully interpret MPI communications, data for all ranks associated with a communication operation must be loaded into Nsight Systems.
Here is an example of MPI_COMM_WORLD data. This does not require any additional team data, since local rank is the same as global rank.
(Screenshot shows communication parameters for an MPI_Bcast call on rank 3)
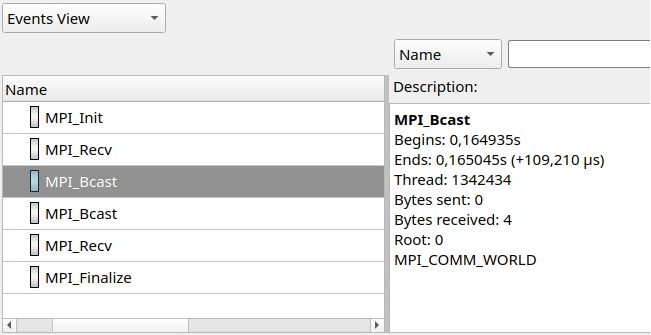
When not all processes that are involved in an MPI communication are loaded into Nsight Systems the following information is available.
Right-hand screenshot shows a reused communicator handle (last number increased).
Encoding: MPI_COMM[*team size*]*global-group-root-rank*.*group-ID*
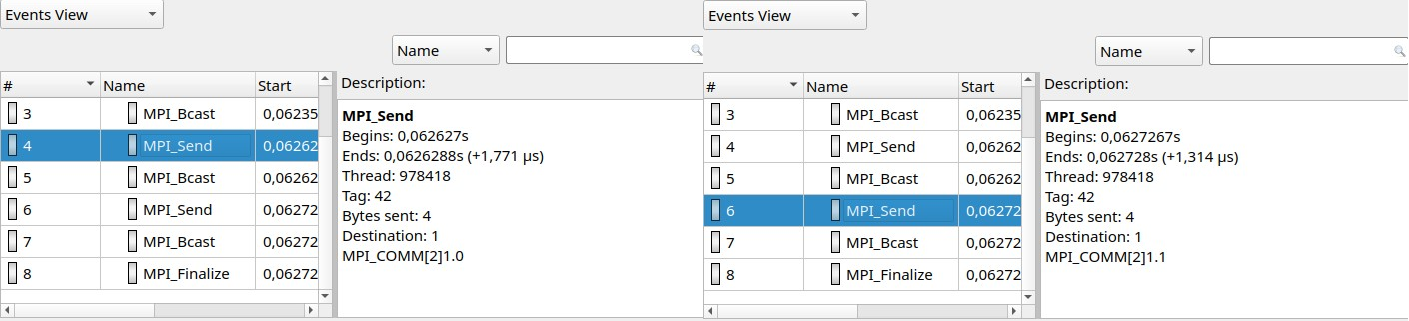
When all reports are loaded into Nsight Systems:
World rank is shown in addition to group-local rank “(world rank X)”
Encoding: MPI_COMM[*team size*]{rank0, rank1, …}
At most 8 ranks are shown (the numbers represent world ranks, the position in the list is the group-local rank)
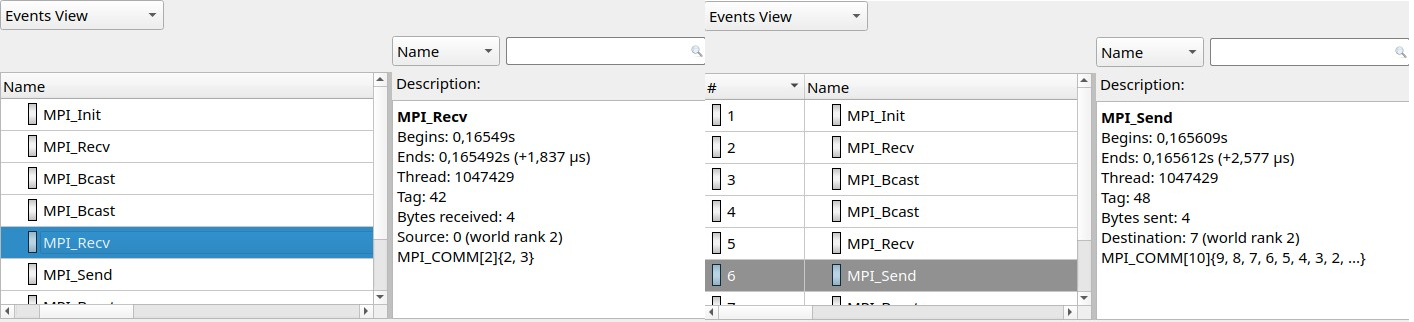
MPI functions traced:
MPI_Init[_thread], MPI_Finalize
MPI_Send, MPI_{B,S,R}send, MPI_Recv, MPI_Mrecv
MPI_Sendrecv[_replace]

MPI_Barrier, MPI_Bcast
MPI_Scatter[v], MPI_Gather[v]
MPI_Allgather[v], MPI_Alltoall[{v,w}]
MPI_Allreduce, MPI_Reduce[_{scatter,scatter_block,local}]
MPI_Scan, MPI_Exscan

MPI_Isend, MPI_I{b,s,r}send, MPI_I[m]recv
MPI_{Send,Bsend,Ssend,Rsend,Recv}_init
MPI_Start[all]
MPI_Ibarrier, MPI_Ibcast
MPI_Iscatter[v], MPI_Igather[v]
MPI_Iallgather[v], MPI_Ialltoall[{v,w}]
MPI_Iallreduce, MPI_Ireduce[{scatter,scatter_block}]
MPI_I[ex]scan
MPI_Wait[{all,any,some}]

MPI_Put, MPI_Rput, MPI_Get, MPI_Rget
MPI_Accumulate, MPI_Raccumulate
MPI_Get_accumulate, MPI_Rget_accumulate
MPI_Fetch_and_op, MPI_Compare_and_swap

MPI_Win_allocate[_shared]
MPI_Win_create[_dynamic]
MPI_Win_{attach, detach}
MPI_Win_free
MPI_Win_fence
MPI_Win_{start, complete, post, wait}
MPI_Win_[un]lock[_all]
MPI_Win_flush[_local][_all]
MPI_Win_sync

MPI_File_{open,close,delete,sync}
MPI_File_{read,write}[_{all,all_begin,all_end}]
MPI_File_{read,write}_at[_{all,all_begin,all_end}]
MPI_File_{read,write}_shared
MPI_File_{read,write}_ordered[_{begin,end}]
MPI_File_i{read,write}[_{all,at,at_all,shared}]
MPI_File_set_{size,view,info}
MPI_File_get_{size,view,info,group,amode}
MPI_File_preallocate

MPI_Pack[_external]
MPI_Unpack[_external]
OpenSHMEM Library Trace
If OpenSHMEM library trace is selected Nsight Systems will trace the subset of OpenSHMEM API functions that are most likely be involved in performance bottlenecks. To keep overhead low Nsight Systems does not trace all functions.
OpenSHMEM 1.5 Functions Not Traced
shmem_my_pe
shmem_n_pes
shmem_global_exit
shmem_pe_accessible
shmem_addr_accessible
shmem_ctx_{create,destroy,get_team}
shmem_global_exit
shmem_info_get_{version,name}
shmem_{my_pe,n_pes,pe_accessible,ptr}
shmem_query_thread
shmem_team_{create_ctx,destroy}
shmem_team_get_config
shmem_team_{my_pe,n_pes,translate_pe}
shmem_team_split_{2d,strided}
shmem_test*
UCX Library Trace
If UCX library trace is selected Nsight Systems will trace the subset of functions of the UCX protocol layer UCP that are most likely be involved in performance bottlenecks. To keep overhead low Nsight Systems does not trace all functions.
UCX functions traced:
ucp_am_send_nb[x]
ucp_am_recv_data_nbx
ucp_am_data_release
ucp_atomic_{add{32,64},cswap{32,64},fadd{32,64},swap{32,64}}
ucp_atomic_{post,fetch_nb,op_nbx}
ucp_cleanup
ucp_config_{modify,read,release}
ucp_disconnect_nb
ucp_dt_{create_generic,destroy}
ucp_ep_{create,destroy,modify_nb,close_nbx}
ucp_ep_flush[{_nb,_nbx}]
ucp_listener_{create,destroy,query,reject}
ucp_mem_{advise,map,unmap,query}
ucp_{put,get}[_nbi]
ucp_{put,get}_nb[x]
ucp_request_{alloc,cancel,is_completed}
ucp_rkey_{buffer_release,destroy,pack,ptr}
ucp_stream_data_release
ucp_stream_recv_data_nb
ucp_stream_{send,recv}_nb[x]
ucp_stream_worker_poll
ucp_tag_msg_recv_nb[x]
ucp_tag_{send,recv}_nbr
ucp_tag_{send,recv}_nb[x]
ucp_tag_send_sync_nb[x]
ucp_worker_{create,destroy,get_address,get_efd,arm,fence,wait,signal,wait_mem}
ucp_worker_flush[{_nb,_nbx}]
ucp_worker_set_am_{handler,recv_handler}
UCX Functions Not Traced:
ucp_config_print
ucp_conn_request_query
ucp_context_{query,print_info}
ucp_get_version[_string]
ucp_ep_{close_nb,print_info,query,rkey_unpack}
ucp_mem_print_info
ucp_request_{check_status,free,query,release,test}
ucp_stream_recv_request_test
ucp_tag_probe_nb
ucp_tag_recv_request_test
ucp_worker_{address_query,print_info,progress,query,release_address}
Additional API functions from other UCX layers may be added in a future version of the product.
NVIDIA NVSHMEM and NCCL Trace
The NVIDIA network communication libraries NVSHMEM and NCCL have been instrumented using NVTX annotations. To enable tracing these libraries in Nsight Systems, turn on NVTX tracing in the GUI or CLI. To enable the NVTX instrumentation of the NVSHMEM library, make sure that the environment variable NVSHMEM_NVTX is set properly, e.g. NVSHMEM_NVTX=common.
NIC Metric Sampling
Overview
NVIDIA ConnectX smart network interface cards (smart NICs) offer advanced hardware offloads and accelerations for network operations. Viewing smart NICs metrics, on Nsight Systems timeline, enables developers to better understand their application’s network usage. Developers can use this information to optimize the application’s performance.
Limitations/Requirements
NIC metric sampling supports NVIDIA ConnectX boards starting with ConnectX 5
NIC metric sampling is supported on Linux x86_64 and ARM Server (SBSA) machines only, having minimum Linux kernel 4.12 and minimum MLNX_OFED 4.1. You can download the latest and archived versions of the MLX_OFED driver from the MLNX_OFED Download Center. If collecting NIC metrics within a container, make sure that the container has access to the driver on the host machine. To check manually if OFED is installed and get its version you can run:
/usr/bin/ofed_infocat /sys/module/"$(cat /proc/modules | grep -o -E "^mlx._core")"/version
To check if the target system meets the requirements for NIC metrics collection you can run nsys status --network.
Collecting NIC Metrics Using the Command Line
To collect NIC performance metrics, using Nsight Systems CLI, add the --nic-metrics command line switch:
nsys profile --nic-metrics=true my_app
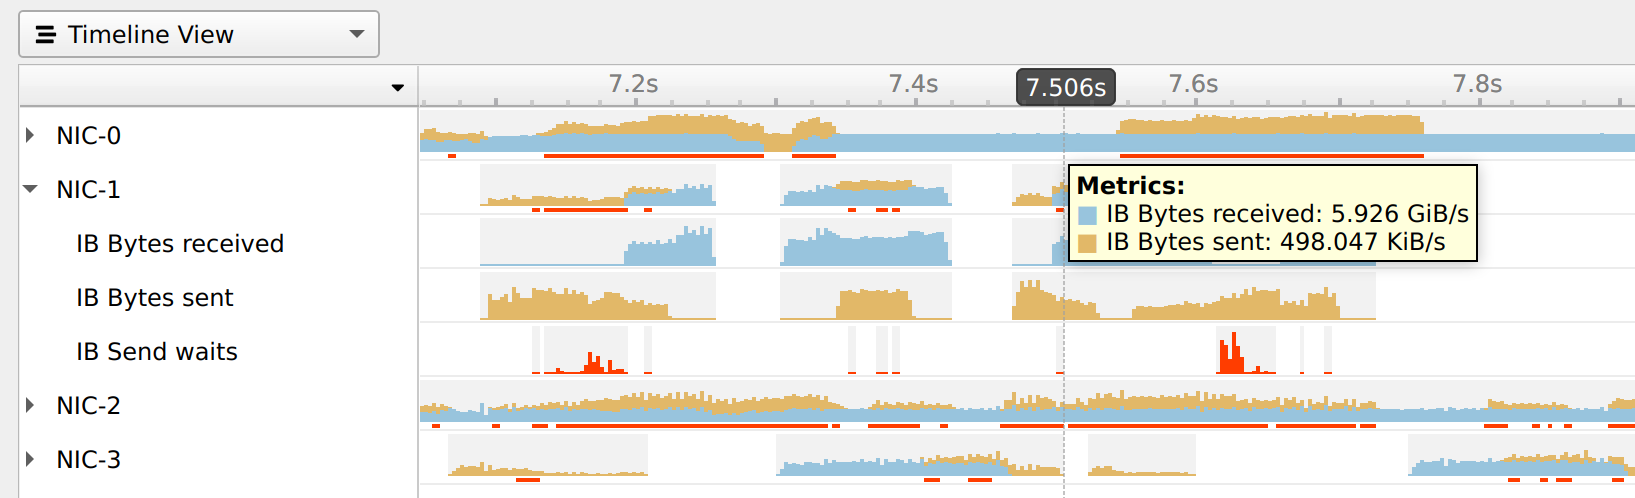
Available Metrics
Bytes sent - Number of bytes sent through all NIC ports.
Bytes received - Number of bytes received by all NIC ports.
CNPs sent - Number of congestion notification packets sent by the NIC.
CNPs received - Number of congestion notification packets received and handled by the NIC.
Send waits - The number of ticks during which ports had data to transmit but no data was sent during the entire tick (either because of insufficient credits or because of lack of arbitration)
Note: Each one of the mentioned metrics is shown only if it has non-zero value during profiling.
Usage Examples
The
Bytes sent/secand theBytes received/secmetrics enables identifying idle and busy NIC times.Developers may shift network operations from busy to idle times to reduce network congestion and latency.
Developers can use idle NIC times to send additional data without reducing application performance.
CNPs (congestion notification packets) received/sent and Send waits metrics may explain network latencies. A developer seeing the time periods when the network was congested may rewrite his algorithm to avoid the observed congestions.
Note
RDMA over Converged Ethernet (RoCE) traffic is not logged into the Nsight Systems NIC metrics.
InfiniBand Switch Metric Sampling
NVIDIA Quantum InfiniBand switches offer high-bandwidth, low-latency communication. Viewing switch metrics, on Nsight Systems timeline, enables developers to better understand their application’s network usage. Developers can use this information to optimize the application’s performance.
Limitations/Requirements
IB switch metric sampling supports all NVIDIA Quantum switches. The user needs to have permission to query the InfiniBand switch metrics.
To check if the current user has permissions to query the InfiniBand switch metrics, check that the user have permission to access /dev/umad
To give user permissions to query InfiniBand switch metrics on RedHat systems, follow the directions at RedHat Solutions.
To collect InfiniBand switch performance metric, using Nsight Systems CLI, add the --ib-switch-metrics command line switch, followed by a comma separated list of InfiniBand switch GUIDs. For example:
nsys profile --ib-switch-metrics=<IB switch GUID> my_app
To get a list of InfiniBand switches connected to the machine, use:
sudo ibnetdiscover -S
Available Metrics
Bytes sent - Number of bytes sent through all switch ports
Bytes received - Number of bytes received by all switch ports
Python Profiling
Python Backtrace Sampling
Nsight Systems for Arm server (SBSA) platforms, x86 Linux and Windows targets, is capable of periodically capturing Python backtrace information. This functionality is available when tracing Python interpreters of version 3.9 or later. Capturing python backtrace is done in periodic samples, in a selected frequency ranging from 1Hz - 2KHz with a default value of 1KHz. Note that this feature provides meaningful backtraces for Python processes, when profiling Python-only workflows, consider disabling the CPU sampling option to reduce overhead.
To enable Python backtrace sampling from Nsight Systems:
CLI — Set --python-sampling=true and use the --python-sampling-frequency option to set the sampling rate.
GUI — Select the Collect Python backtrace samples checkbox.
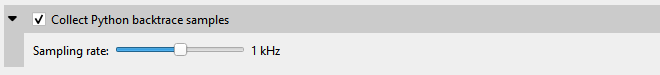
Example screenshot:
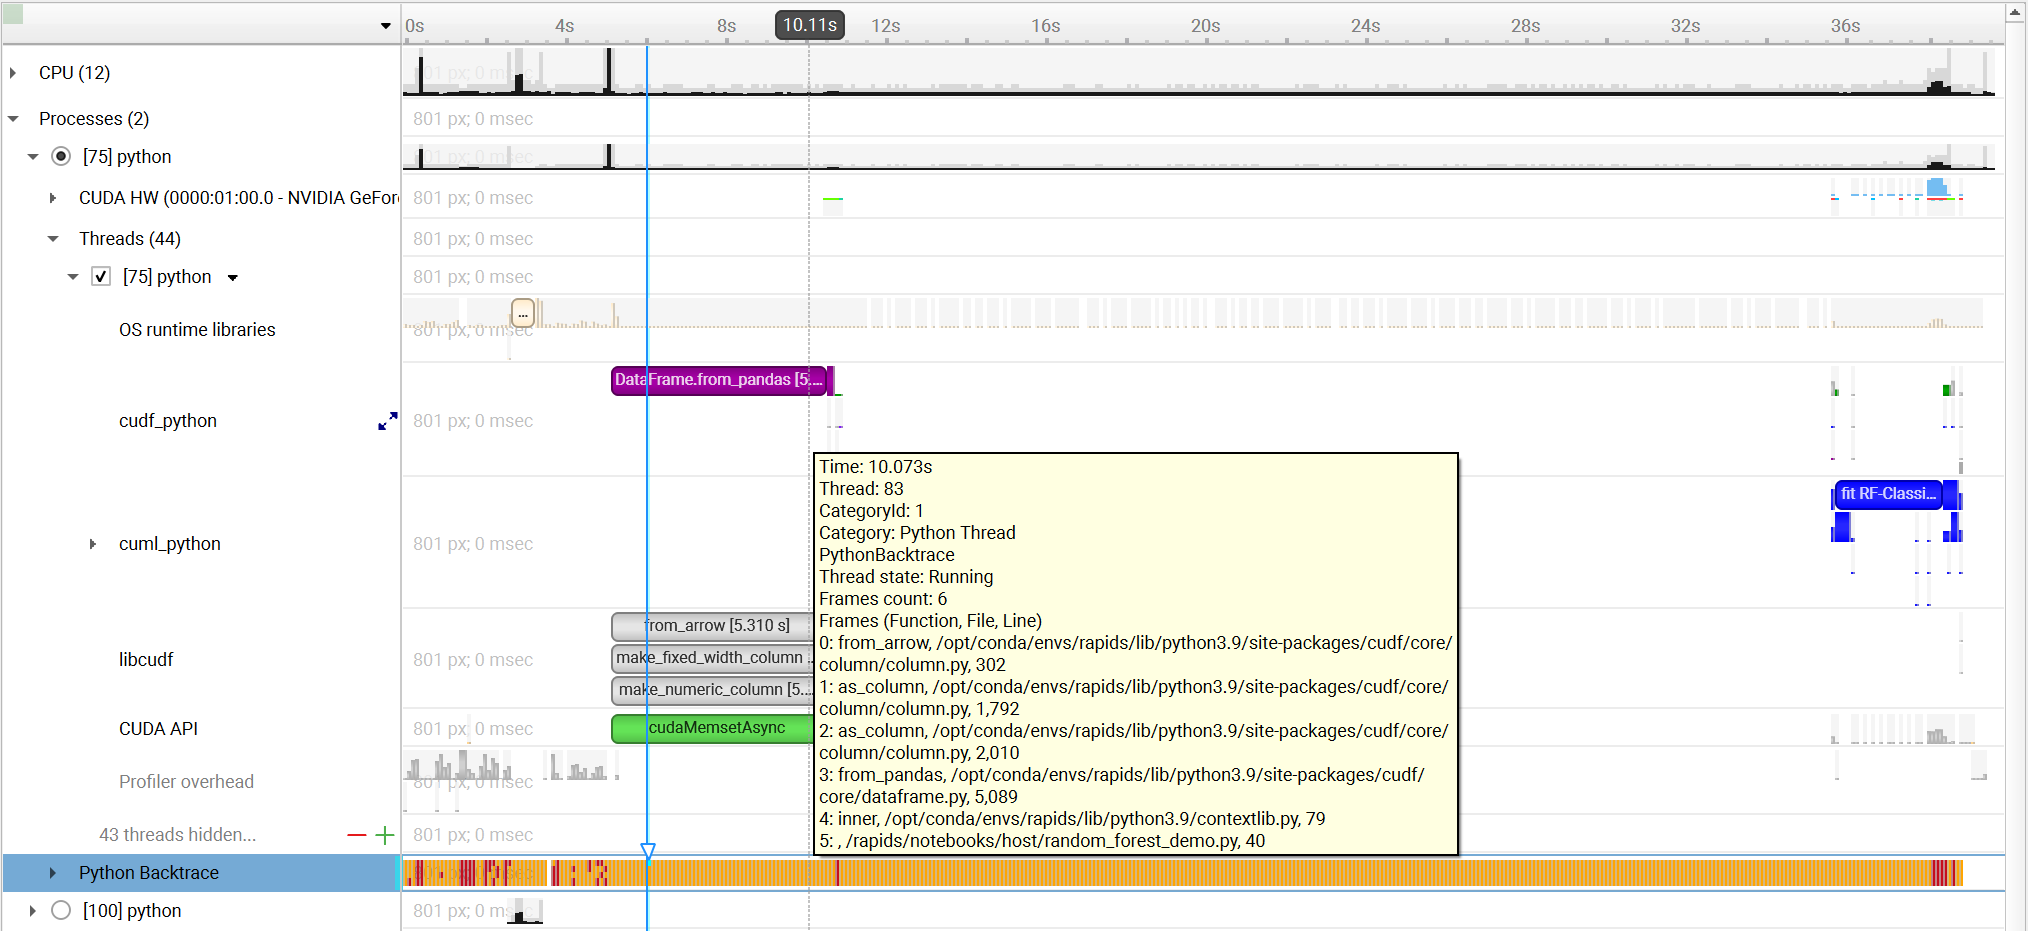
Python NVTX Annotations
Nsight Systems for Arm server (SBSA) platforms, x86 Linux and Windows targets, is capable of using NVTX to annotate Python functions.
The Python source code does not require any changes. This feature requires CPython interpreter, release 3.8 or later.
The annotations are configured in a JSON file. An example file is located in Nsight Systems installation folder in <target-platform-folder>/PythonNvtx/annotations.json.
Notes:
Annotating function from module
__main__is not supported.
To enable Python NVTX annotations from Nsight Systems:
CLI — Set --python-nvtx-annotations=<json_file>.
GUI — Select the Python NVTX annotations checkbox and specify the JSON file.
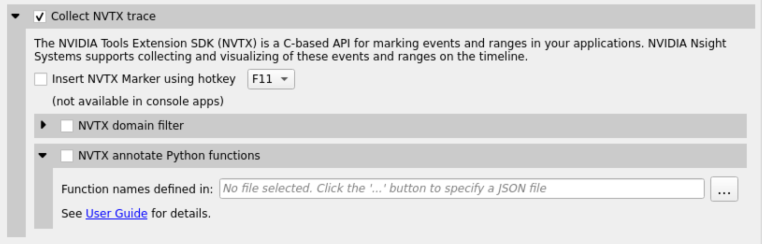
Example screenshot:
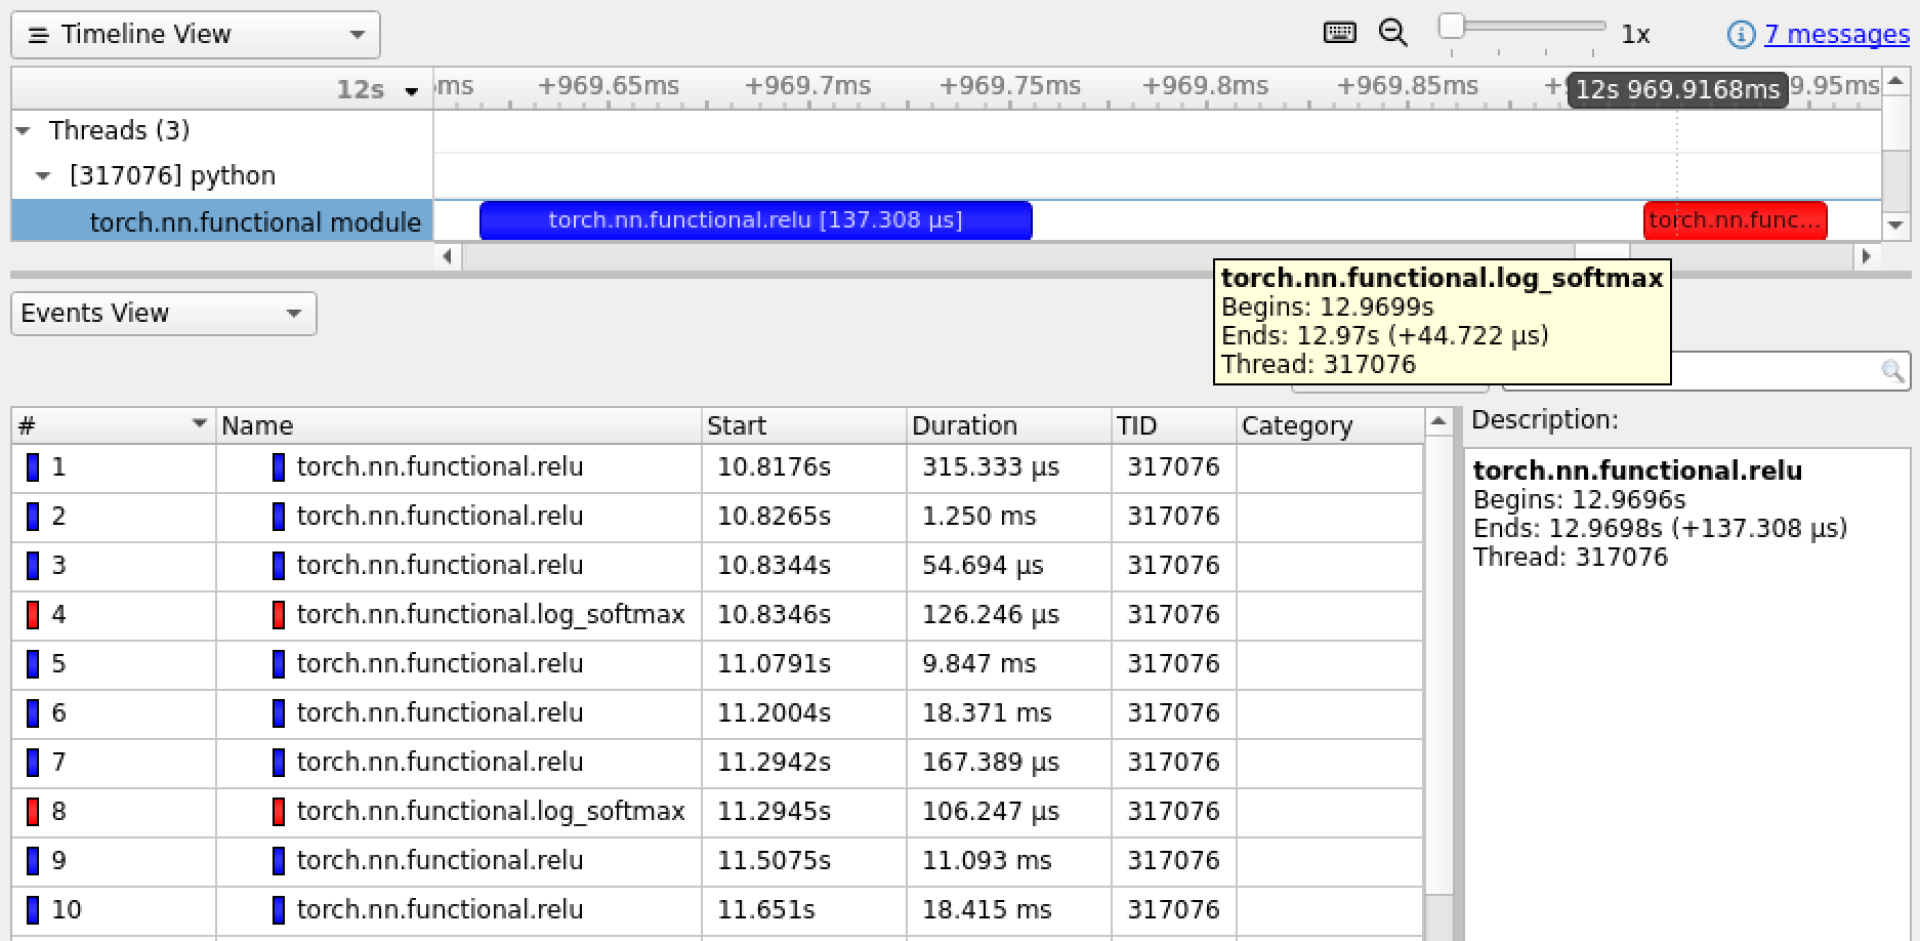
Python GIL Tracing
Nsight Systems for Arm server (SBSA) platforms, x86 Linux and Windows targets, is capable of tracing when Python threads are waiting to hold and holding the GIL (Global Interpreter Lock).
The Python source code does not require any changes. This feature requires CPython interpreter, release 3.9 or later.
CLI — Set --trace=python-gil.
GUI — Select the Trace GIL checkbox under Python profiling options.
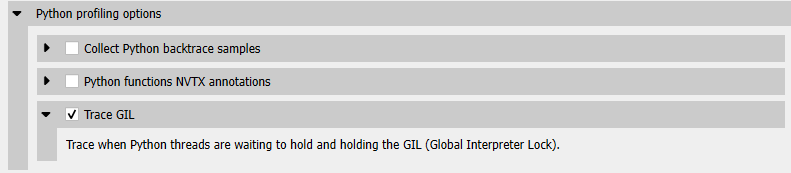
Example screenshot:
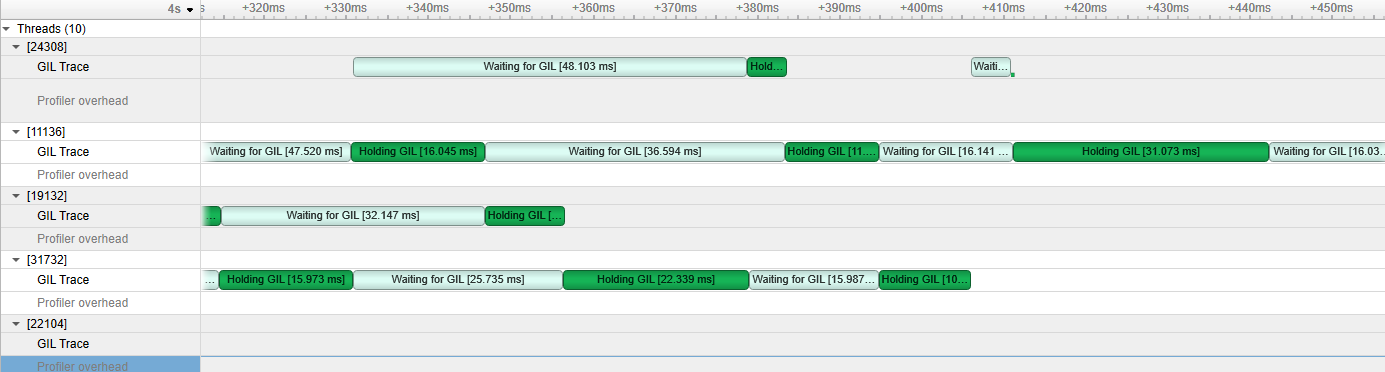
Reading Your Report in GUI
Generating a New Report
Users can generate a new report by stopping a profiling session. If a profiling session has been canceled, a report will not be generated, and all collected data will be discarded.
A new .nsys-rep file will be created and put into the same directory as the project file (.qdproj).
Opening an Existing Report
An existing .nsys-rep file can be opened using File > Open….
Report Tab
While generating a new report or loading an existing one, a new tab will be created. The most important parts of the report tab are:
View selector — Allows switching between Analysis Summary, Timeline View, Diagnostics Summary, and Symbol Resolution Logs views.
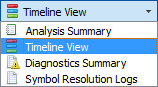
Timeline — This is where all charts are displayed.
Function table — Located below the timeline, it displays statistical information about functions in the target application in multiple ways.
Additionally, the following controls are available:
Zoom slider — Allows you to vertically zoom the charts on the timeline.
Analysis Summary View
This view shows a summary of the profiling session. In particular, it is useful to review the project configuration used to generate this report. Information from this view can be selected and copied using the mouse cursor.
Timeline View
The timeline view consists of two main controls: the timeline at the top, and a bottom pane that contains the events view and the function table. In some cases, when sampling of a process has not been enabled, the function table might be empty and hidden.
The bottom view selector sets the view that is displayed in the bottom pane.
Timeline
Timeline is a versatile control that contains a tree-like hierarchy on the left, and corresponding charts on the right.
Contents of the hierarchy depend on the project settings used to collect the report. For example, if a certain feature has not been enabled, corresponding rows will not be show on the timeline.
To generate a timeline screenshot without opening the full GUI, use the command
nsys-ui.exe --screenshot filename.nsys-rep
Events View
The Events View provides a tabular display of the trace events. The view contents can be searched and sorted.
Double-clicking an item in the Events View automatically focuses the Timeline View on the corresponding timeline item.
API calls, GPU executions, and debug markers that occurred within the boundaries of a debug marker are displayed nested to that debug marker. Multiple levels of nesting are supported.
Events view recognizes these types of debug markers:
NVTX
Vulkan VK_EXT_debug_marker markers, VK_EXT_debug_utils labels
PIX events and markers
OpenGL KHR_debug markers
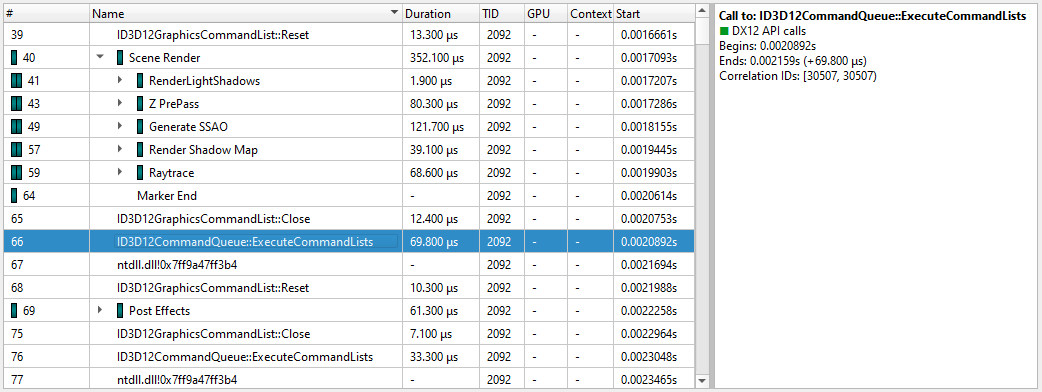
You can copy and paste from the events view by highlighting rows, using Shift or Ctrl to enable multi-select. Right clicking on the selection will give you a copy option.
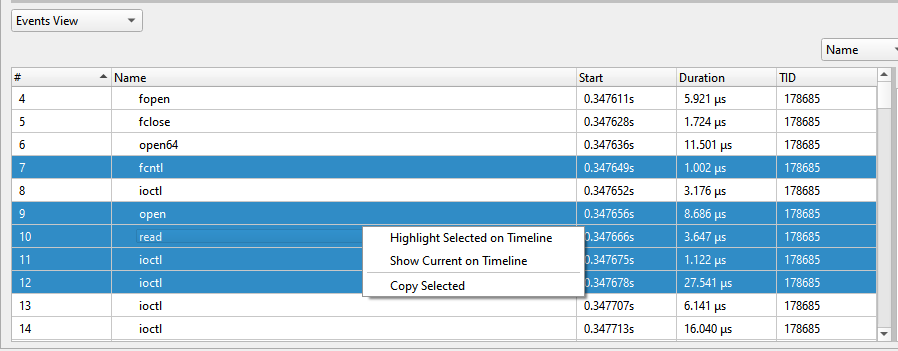
Pasting into text gives you a tab separated view:
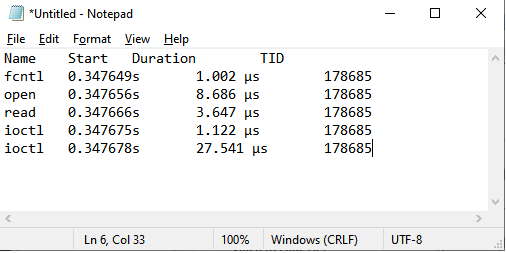
Pasting into spreadsheet properly copies into rows and columns:
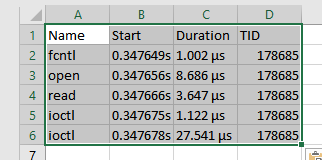
Function Table Modes
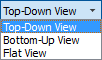
The function table can work in three modes:
Top-Down View — In this mode, expanding top-level functions provides information about the callee functions. One of the top-level functions is typically the main function of your application, or another entry point defined by the runtime libraries.
Bottom-Up View — This is a reverse of the Top-Down view. On the top level, there are functions directly hit by the sampling profiler. To explore all possible call chains leading to these functions, you need to expand the subtrees of the top-level functions.
Flat View — This view enumerates all functions ever observed by the profiler, even if they have never been directly hit, but just appeared somewhere on the call stack. This view typically provides a high-level overview of which parts of the code are CPU-intensive.
Each of the views helps understand particular performance issues of the application being profiled. For example:
When trying to find specific bottleneck functions that can be optimized, the Bottom-Up view should be used. Typically, the top few functions should be examined. Expand them to understand in which contexts they are being used.
To navigate the call tree of the application and while generally searching for algorithms and parts of the code that consume unexpectedly large amount of CPU time, the Top-Down view should be used.
To quickly assess which parts of the application, or high level parts of an algorithm, consume significant amount of CPU time, use the Flat view.
The Top-Down and Bottom-Up views have Self and Total columns, while the Flat view has a Flat column. It is important to understand the meaning of each of the columns:
Top-Down view
Self column denotes the relative amount of time spent executing instructions of this particular function.
Total column shows how much time has been spent executing this function, including all other functions called from this one. Total values of sibling rows sum up to the Total value of the parent row, or 100% for the top-level rows.
Bottom-Up view
Self column for top-level rows, as in the Top-Down view, shows how much time has been spent directly in this function. Self times of all top-level rows add up to 100%.
Self column for children rows breaks down the value of the parent row based on the various call chains leading to that function. Self times of sibling rows add up to the value of the parent row.
Flat view
Flat column shows how much time this function has been anywhere on the call stack. Values in this column do not add up or have other significant relationships.
Note
If low-impact functions have been filtered out, values may not add up correctly to 100%, or to the value of the parent row. This filtering can be disabled.
Contents of the symbols table is tightly related to the timeline. Users can apply and modify filters on the timeline, and they will affect which information is displayed in the symbols table:
Per-thread filtering — Each thread that has sampling information associated with it has a checkbox next to it on the timeline. Only threads with selected checkboxes are represented in the symbols table.
Time filtering — A time filter can be setup on the timeline by pressing the left mouse button, dragging over a region of interest on the timeline, and then choosing Filter by selection in the dropdown menu. In this case, only sampling information collected during the selected time range will be used to build the symbols table.
Note
If too little sampling data is being used to build the symbols table (for example, when the sampling rate is configured to be low, and a short period of time is used for time-based filtering), the numbers in the symbols table might not be representative or accurate in some cases.
Function Table Notes
Last Branch Records vs Frame Pointers
Two of the mechanisms available for collecting backtraces are Intel Last Branch Records (LBRs) and frame pointers. LBRs are used to trace every branch instruction via a limited set of hardware registers. They can be configured to generate backtraces but have finite depth based on the CPU’s microarchitecture. LBRs are effectively free to collect but may not be as deep as you need in order to fully understand how the workload arrived a specific Instruction Pointer (IP).
Frame pointers only work when a binary is compiled with the -fno-omit-frame-pointer compiler switch. To determine if frame pointers are enabled on an x86_64 binary running on Linux, dump a binary’s assembly code using the objdump -d [binary_file] command and look for this pattern at the beginning of all functions;
push   %rbp
mov    %rsp,%rbp
When frame pointers are available in a binary, full stack traces will be captured. Note that libraries that are frequently used by apps and ship with the operating system, such as libc, are generated in release mode and therefore do not include frame pointers. Frequently, when a backtrace includes an address from a system library, the backtrace will fail to resolve further as the frame pointer trail goes cold due to a missing frame pointer.
A simple application was developed to show the difference. The application calls function a(), which calls b(), which calls c(), etc. Function z() calls a heavy compute function called matrix_multiply(). Almost all of the IP samples are collected while matrix_multiple is executing. The next two screen shots show one of the main differences between frame pointers and LBRs.
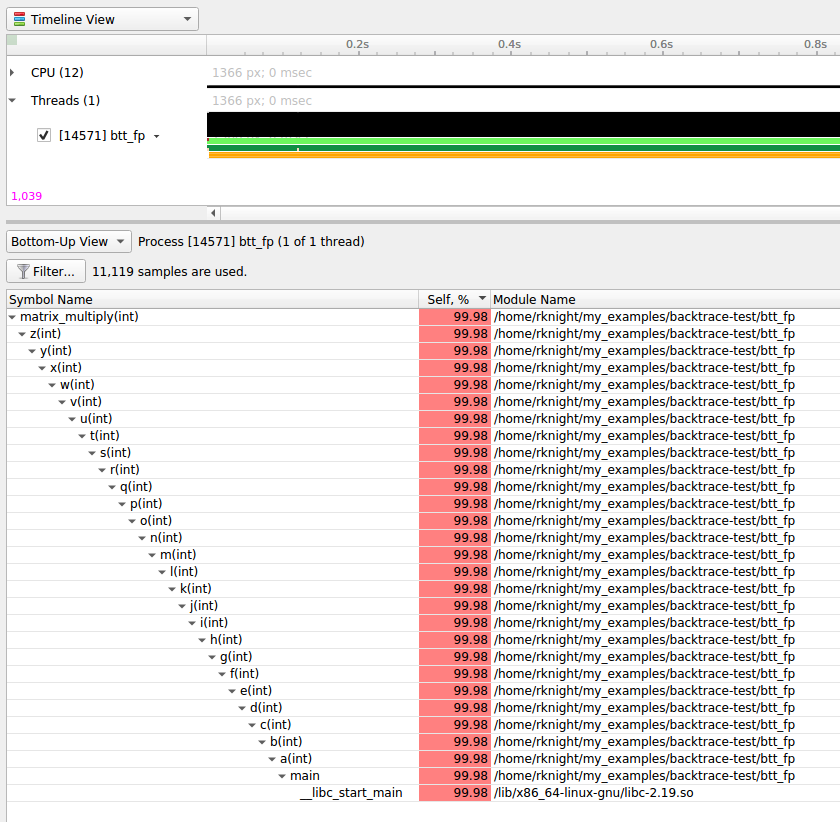
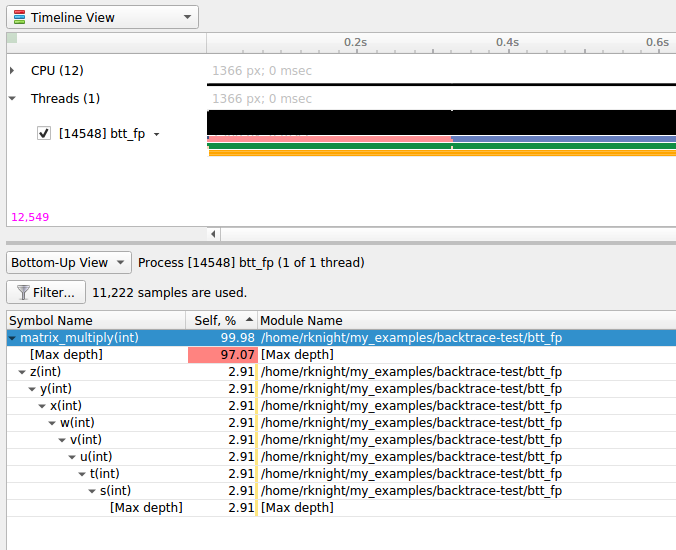
Note that the frame pointer example, shows the full stack trace while the LBR example, only shows part of the stack due to the limited number of LBR registers in the CPU.
Kernel Samples
When an IP sample is captured while a kernel mode (i.e. operating system) function is executing, the sample will be shown with an address that starts with 0xffffffff and map to the [kernel.kallsyms] module.
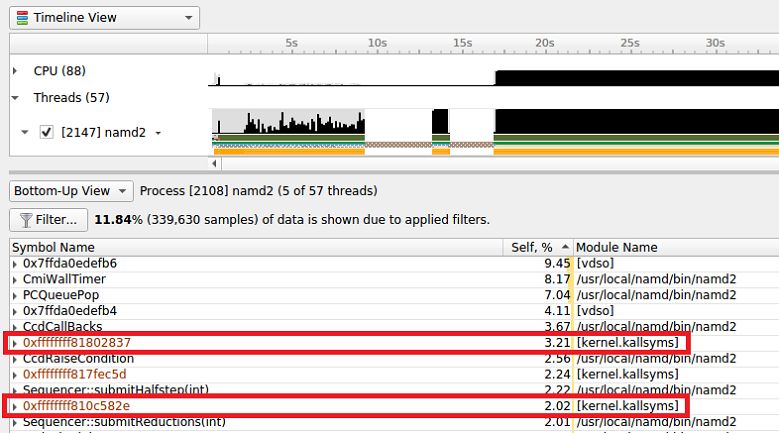
[vdso]
Samples may be collected while a CPU is executing functions in the Virtual Dynamic Shared Object. In this case, the sample will be resolved (i.e. mapped) to the [vdso] module. The vdso man page provides the following description of the vdso:
The “vDSO“ (virtual dynamic shared object) is a small shared library
that the kernel automatically maps into the address space of all
user-space applications.  Applications usually do not need to concern
themselves with these details as the vDSO is most commonly called by
the C library.  This way you can code in the normal way using
standard functions and the C library will take care of using any
functionality that is available via the vDSO.

Why does the vDSO exist at all?  There are some system calls the
kernel provides that user-space code ends up using frequently, to the
point that such calls can dominate overall performance. This is due
both to the frequency of the call as well as the context-switch
overhead that results from exiting user space and entering the
kernel.
[Unknown]
When an address can not be resolved (i.e. mapped to a module), its address within the process’ address space will be shown and its module will be marked as [Unknown].
Filter Dialog
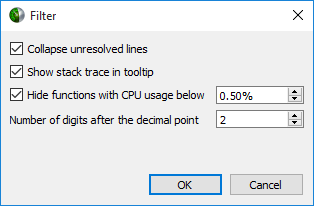
Collapse unresolved lines is useful if some of the binary code does not have symbols. In this case, subtrees that consist of only unresolved symbols get collapsed in the Top-Down view, since they provide very little useful information.
Hide functions with CPU usage below X% is useful for large applications, where the sampling profiler hits lots of function just a few times. To filter out the “long tail,” which is typically not important for CPU performance bottleneck analysis, this checkbox should be selected.
Example of Using Timeline with Function Table
Here is an example walkthrough of using the timeline and function table with Instruction Pointer (IP)/backtrace Sampling Data
Timeline
When a collection result is opened in the Nsight Systems GUI, there are multiple ways to view the CPU profiling data - especially the CPU IP / backtrace data.
In the timeline, yellow-orange marks can be found under each thread’s timeline that indicate the moment an IP / backtrace sample was collected on that thread (e.g. see the yellow-orange marks in the Specific Samples box above). Hovering the cursor over a mark will cause a tooltip to display the backtrace for that sample.
Below the Timeline is a drop-down list with multiple options including Events View, Top-Down View, Bottom-Up View, and Flat View. All four of these views can be used to view CPU IP / backtrace sampling data.
If the Bottom-Up View is selected, here is the sampling summary shown in the bottom half of the Timeline View screen. Notice that the summary includes the phrase “65,022 samples are used” indicating how many samples are summarized. By default, functions that were found in less less than 0.5% of the samples are not show. Use the filter button to modify that setting.
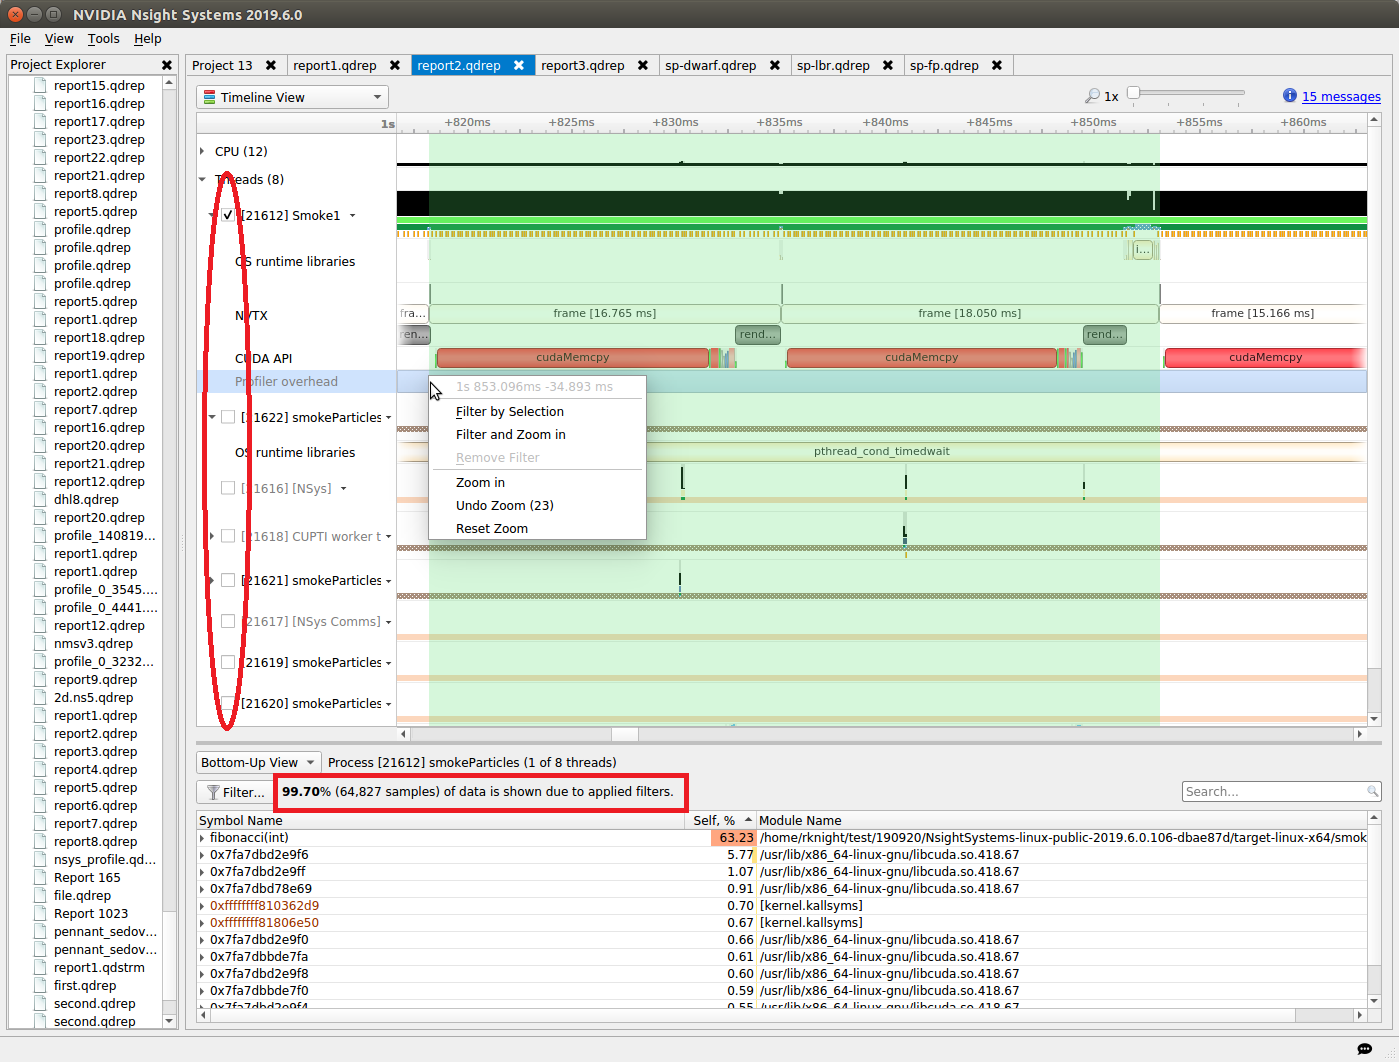
When sampling data is filtered, the Sampling Summary will summarize the selected samples. Samples can be filtered on an OS thread basis, on a time basis, or both. Above, deselecting a checkbox next to a thread removes its samples from the sampling summary. Dragging the cursor over the timeline and selecting “Filter and Zoom In” chooses the samples during the time selected, as seen below. The sample summary includes the phrase “0.35% (225 samples) of data is shown due to applied filters” indicating that only 225 samples are included in the summary results.
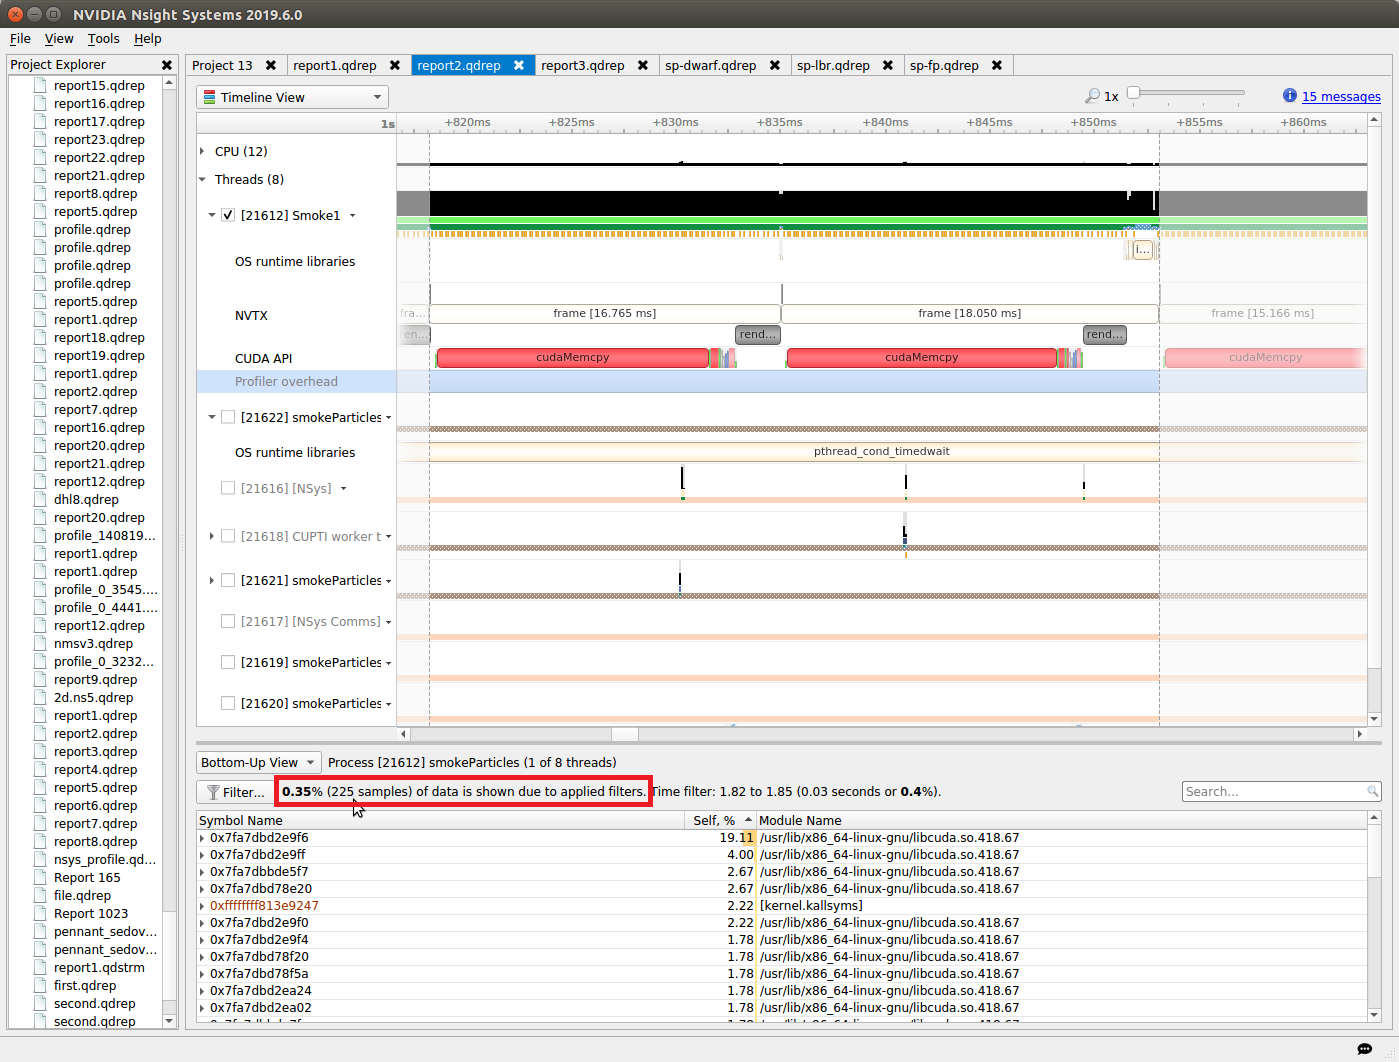
Deselecting threads one at a time by deselecting their checkbox can be tedious. Click on the down arrow next to a thread and choose Show Only This Thread to deselect all threads except that thread.
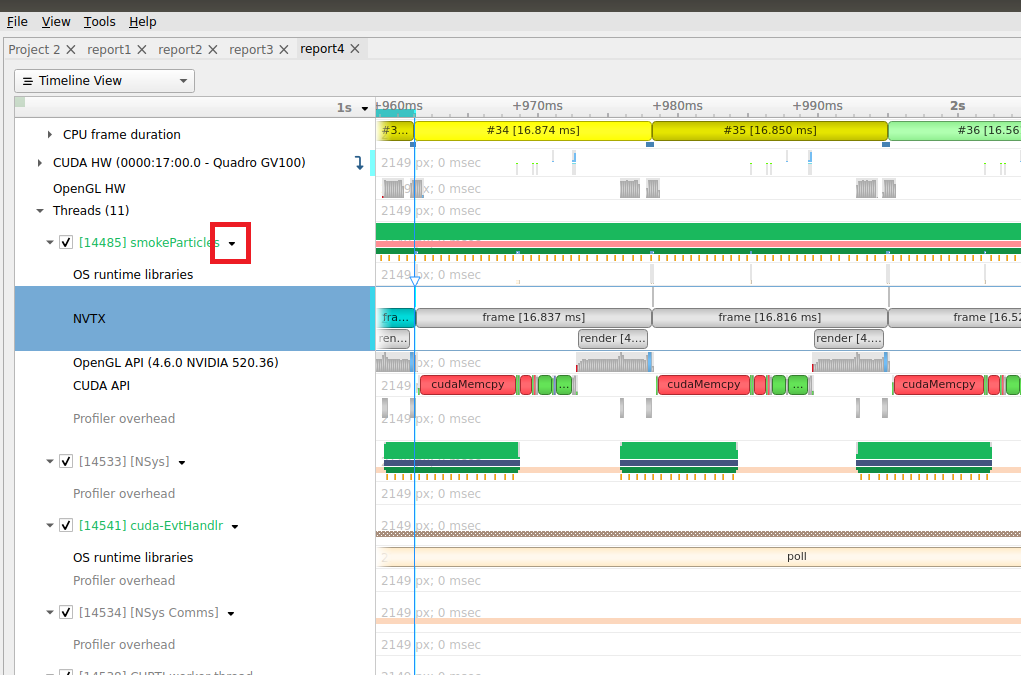
If Events View is selected in the Timeline View’s drop-down list, right click on a specific thread and choose Show in Events View. The samples collected while that thread executed will be shown in the Events View. Double clicking on a specific sample in the Events view causes the timeline to show when that sample was collected - see the green boxes below. The backtrace for that sample is also shown in the Events View.
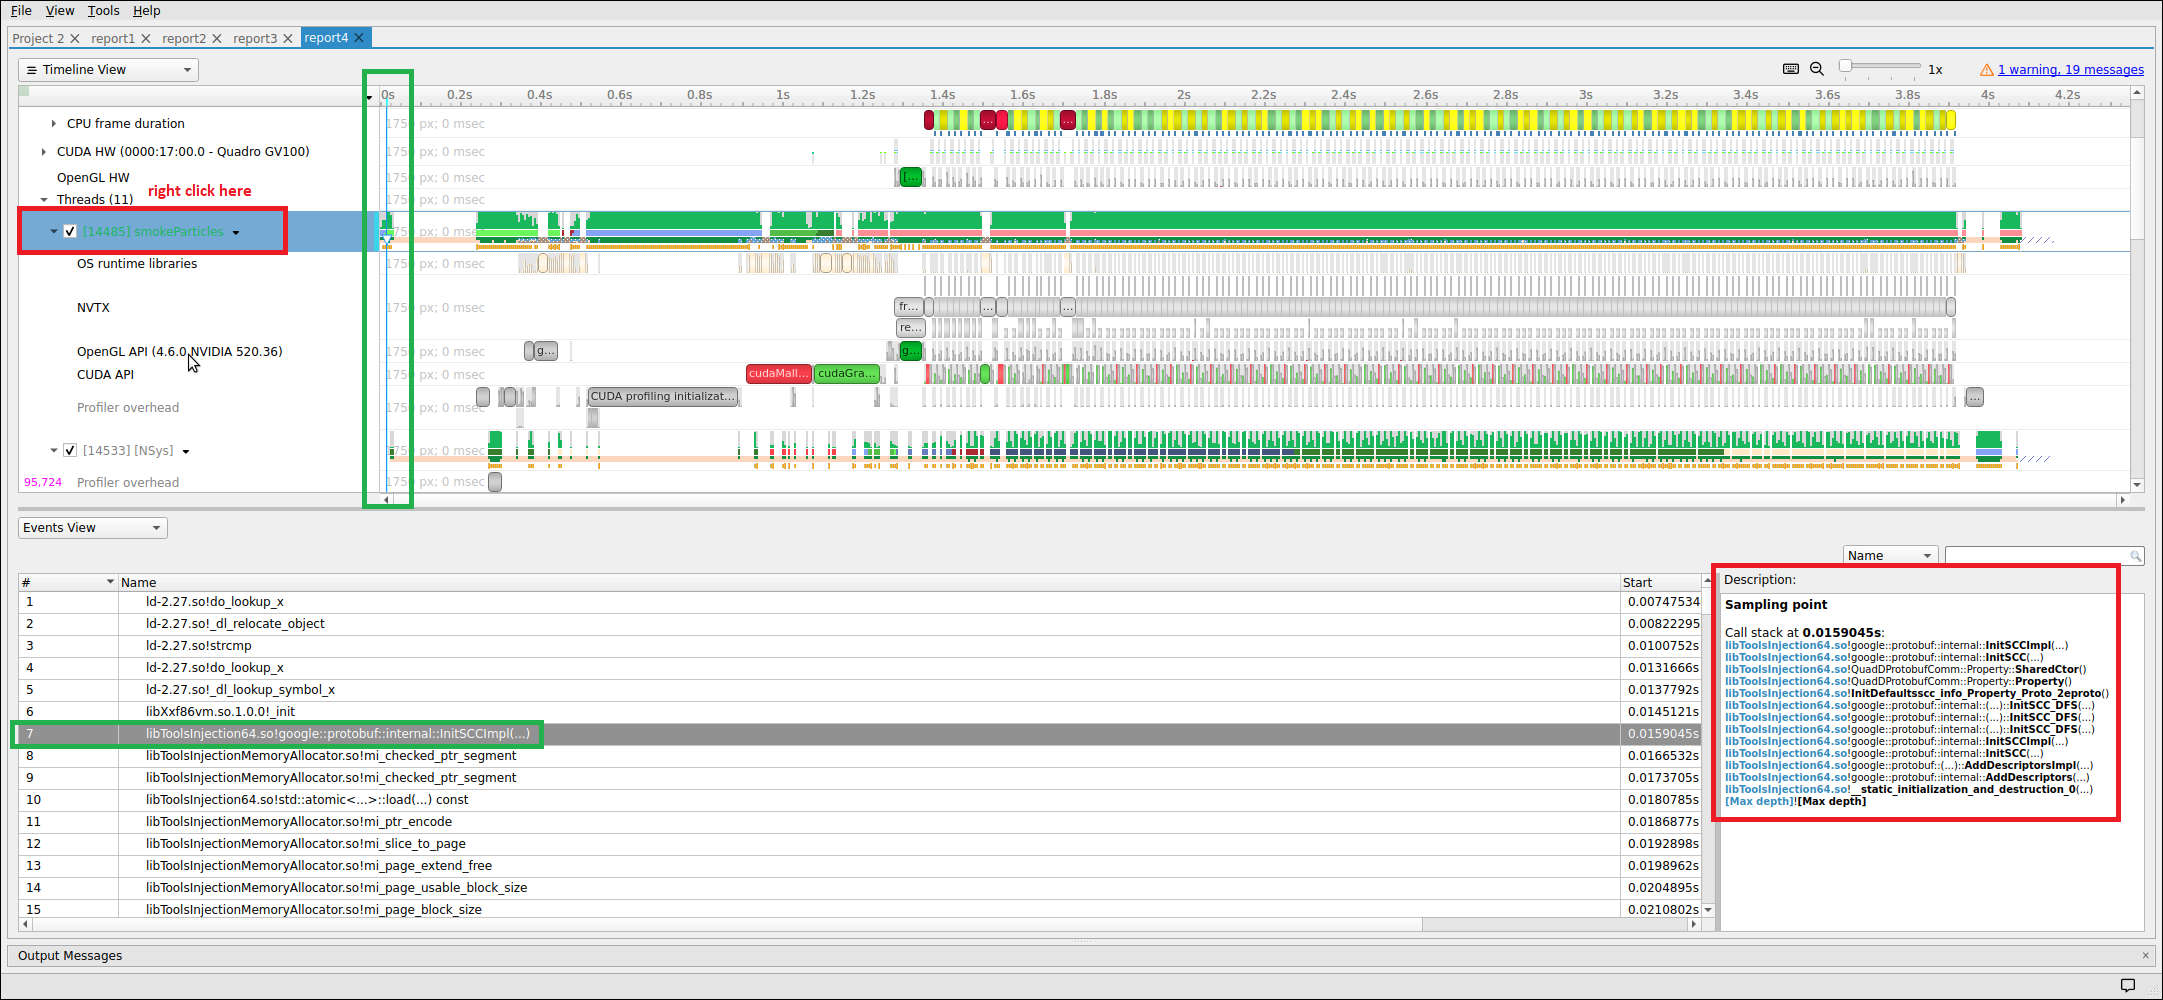
Backtraces
To understand the code path used to get to a specific function shown in the sampling summary, right click on a function and select Expand.
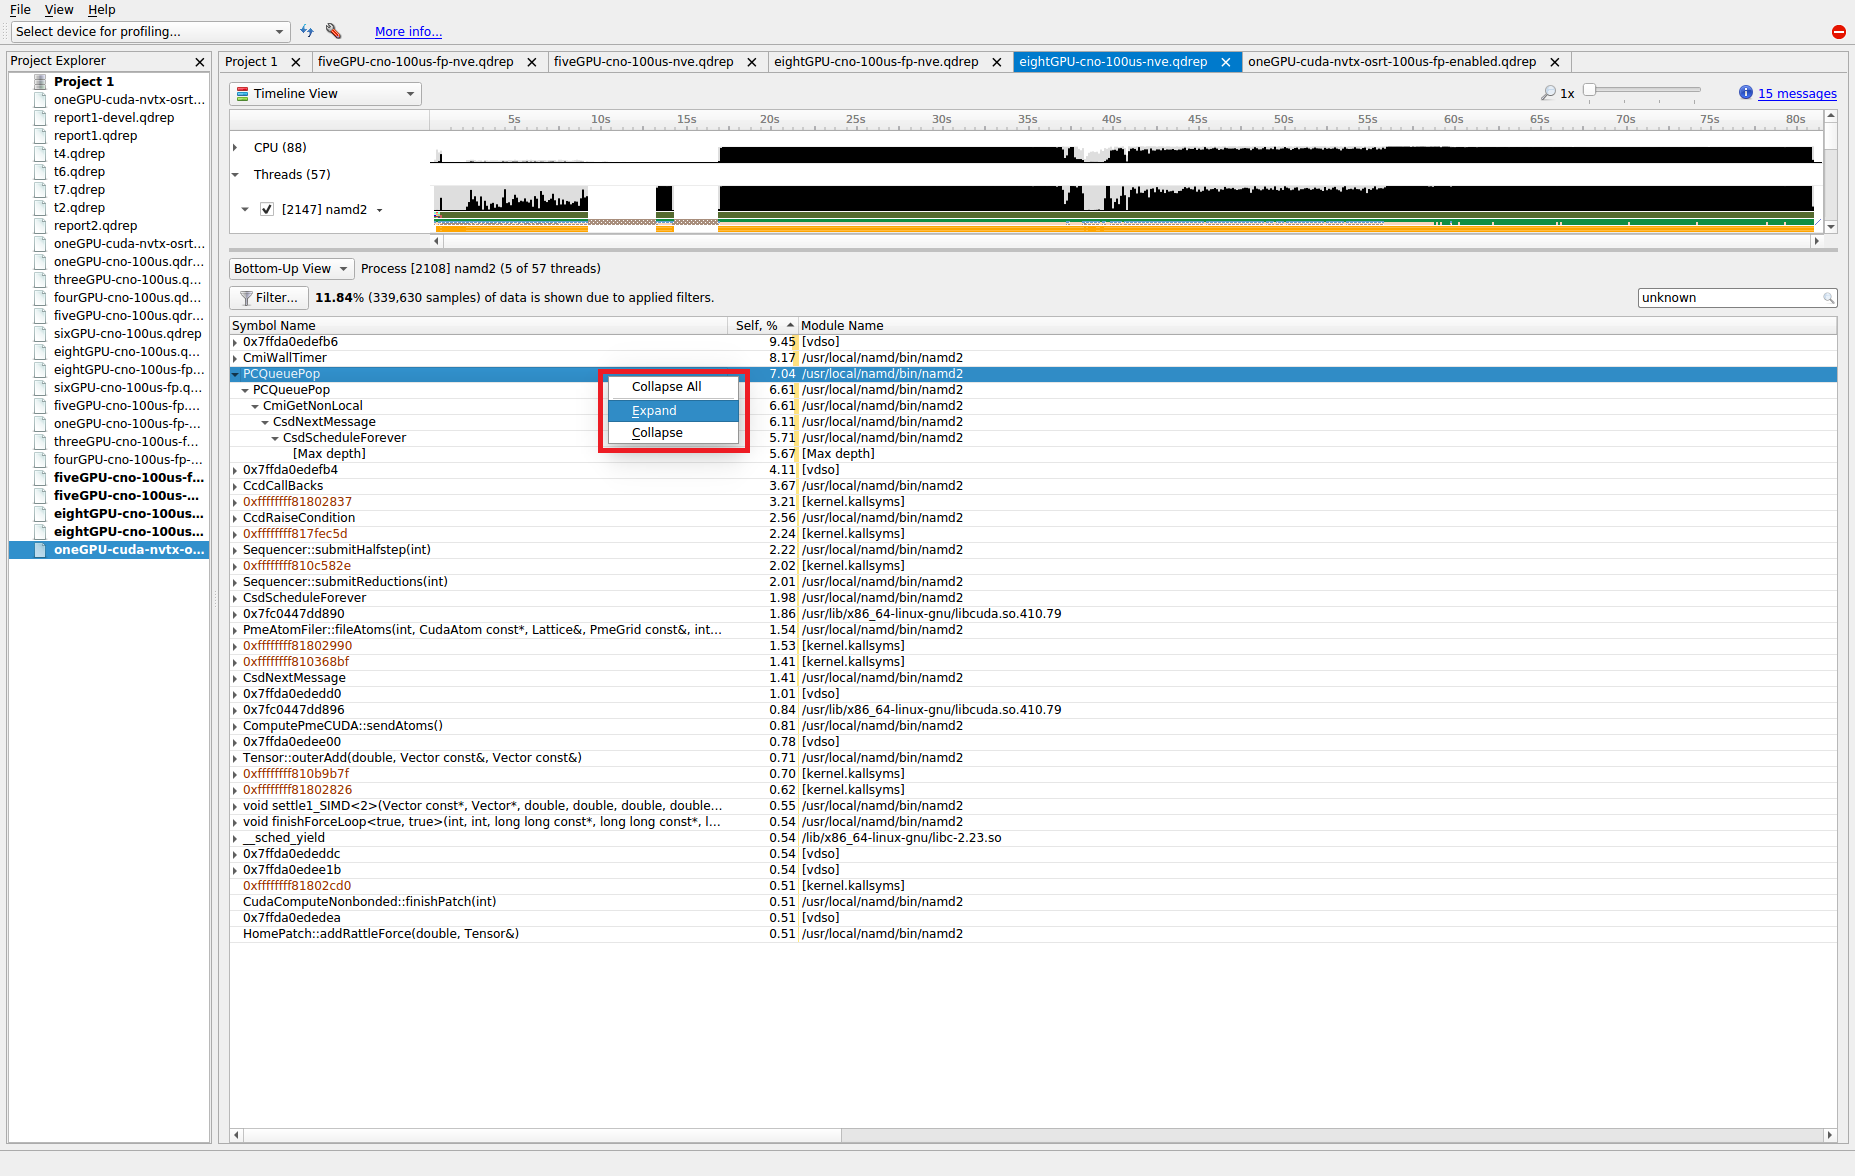
The above shows what happens when a function’s backtraces are expanded. In this case, the PCQueuePop function was called from the CmiGetNonLocal function which was called by the CsdNextMessage function which was called by the CsdScheduleForever function. The [Max depth] string marks the end of the collected backtrace.
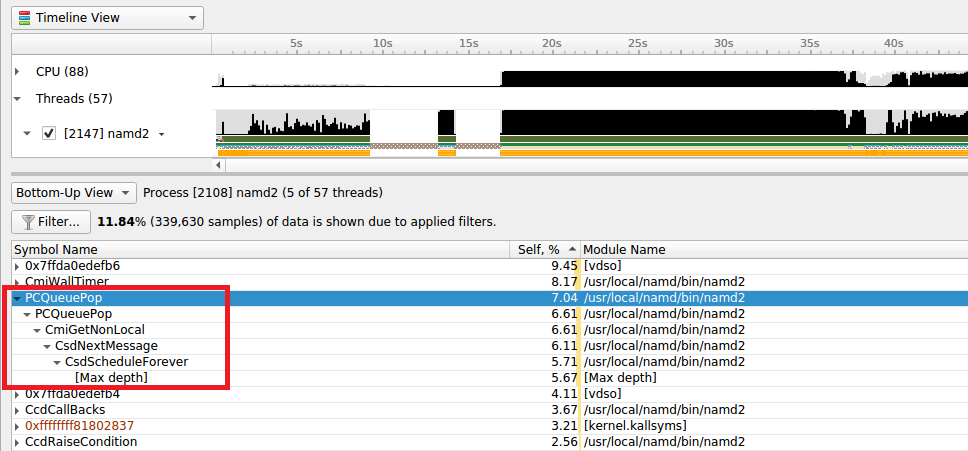
Note that, by default, backtraces with less than 0.5% of the total backtraces are hidden. This behavior can make the percentage results hard to understand. If all backtraces are shown (i.e. the filter is disabled), the results look very different and the numbers add up as expected. To disable the filter, click on the Filter… button and uncheck the Hide functions with CPU usage below X% checkbox.
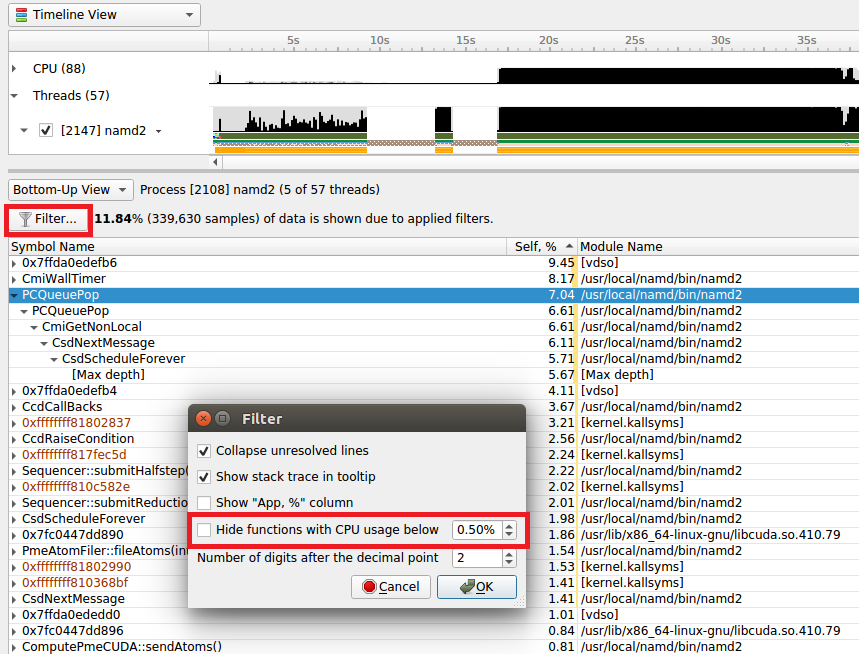
When the filter is disabled, the backtraces are recalculated. Note that you may need to right click on the function and select Expand again to get all of the backtraces to be shown.
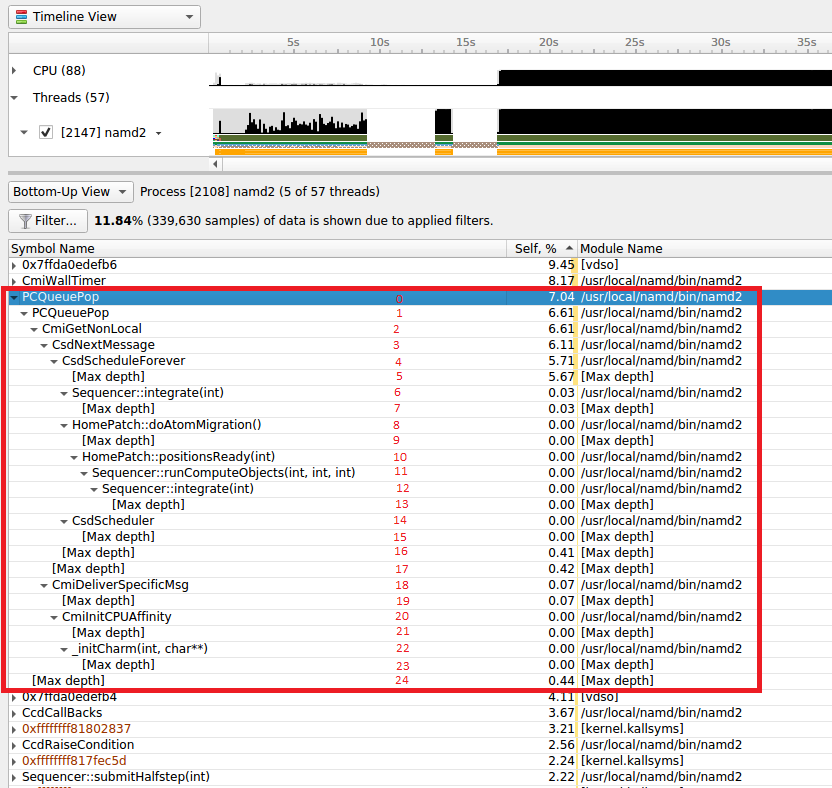
When backtraces are collected, the whole sample (IP and backtrace) is handled as a single sample. If two samples have the exact same IP and backtrace, they are summed in the final results. If two samples have the same IP but a different backtrace, they will be shown as having the same leaf (i.e. IP) but a different backtrace. As mentioned earlier, when backtraces end, they are marked with the [Max depth] string (unless the backtrace can be traced back to its origin - e.g. __libc_start_main) or the backtrace breaks because an IP cannot be resolved.
Above, the leaf function is PCQueuePop. In this case, there are 11 different backtraces that lead to PCQueuPop - all of them end with [Max depth]. For example, the dominant path is PCQueuPop<-CmiGetNonLocal<-CsdNextmessage<-CsdScheduleForever<-[Max depth]. This path accounts for 5.67% of all samples as shown in line 5 (red numbers). The second most dominant path is PCQueuPop<-CmiGetNonLocal<-[Max depth] which accounts for 0.44% of all samples as shown in line 24 (red numbers). The path PCQueuPop<-CmiGetNonLocal<-CsdNextmessage<-CsdScheduleForever<-Sequencer::integrate(int)<-[Max depth] accounts for 0.03% of the samples as shown in line 7 (red numbers). Adding up percentages shown in the [Max depth] lines (lines 5, 7, 9, 13, 15, 16, 17, 19, 21, 23, and 24) generates 7.04% which equals the percentage of samples associated with the PCQueuePop function shown in line 0 (red numbers).
Diagnostics Summary View
This view shows important messages. Some of them were generated during the profiling session, while some were added while processing and analyzing data in the report. Messages can be one of the following types:
Informational messages
Warnings
Errors
To draw attention to important diagnostics messages, a summary line is displayed on the timeline view in the top right corner:

Information from this view can be selected and copied using the mouse cursor.
Symbol Resolution Logs View
This view shows all messages related to the process of resolving symbols. It might be useful to debug issues when some of the symbol names in the symbols table of the timeline view are unresolved.
Adding Report to the Timeline
Starting with 2021.3, Nsight Systems can load multiple report files into a single timeline. This is a BETA feature and will be improved in the future releases. Please let us know about your experience on the forums or through Help > Send Feedback… in the main menu.
To load multiple report files into a single timeline, first start by opening a report as usual — using File > Open… from the main menu, or double clicking on a report in the Project Explorer window. Then additional report files can be loaded into the same timeline using one of the methods:
File > Add Report (beta)… in the main menu, and select another report file that you want to open
Right click on the report in the project explorer window, and click Add Report (beta)
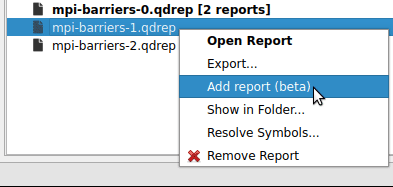
Time Synchronization
When multiple reports are loaded into a single timeline, timestamps between them need to be adjusted, such that events that happened at the same time appear to be aligned.
Nsight Systems can automatically adjust timestamps based on UTC time recorded around the collection start time. This method is used by default when other more precise methods are not available. This time can be seen as UTC time at t=0 in the Analysis Summary page of the report file. Refer to your OS documentation to learn how to sync the software clock using the Network Time Protocol (NTP). NTP-based time synchronization is not very precise, with the typical errors on the scale of one to tens of milliseconds.
Reports collected on the same physical machine can use synchronization based on Timestamp Counter (TSC) values. These are platform-specific counters, typically accessed in user space applications using the RDTSC instruction on x86_64 architecture, or by reading the CNTVCT register on Arm64. Their values converted to nanoseconds can be seen as TSC value at t=0 in the Analysis Summary page of the report file. Reports synchronized using TSC values can be aligned with nanoseconds-level precision.
TSC-based time synchronization is activated automatically, when Nsight Systems detects that reports come from same target and that the same TSC value corresponds to very close UTC times. Targets are considered to be the same when either explicitly set environment variables NSYS_HW_ID are the same for both reports or when target hostnames are the same and NSYS_HW_ID is not set for either target. The difference between UTC and TSC time offsets must be below 1 second to choose TSC-based time synchronization.
To find out which synchronization method was used, navigate to the Analysis Summary tab of an added report and check the Report alignment source property of a target. Note, that the first report won’t have this parameter.

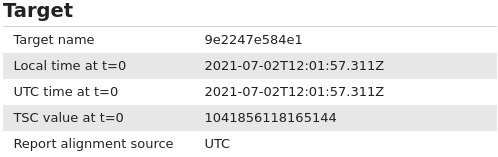
When loading multiple reports into a single timeline, it is always advisable to first check that time synchronization looks correct, by zooming into synchronization or communication events that are expected to be aligned.
Timeline Hierarchy
When reports are added to the same timeline Nsight Systems will automatically line them up by timestamps as described above. If you want Nsight Systems to also recognize matching process or hardware information, you will need to set environment variables NSYS_SYSTEM_ID and NSYS_HW_ID as shown below at the time of report collection (such as when using “nsys profile …” command).
When loading a pair of given report files into the same timeline, they will be merged in one of the following configurations:
Different hardware — is used when reports are coming from different physical machines, and no hardware resources are shared in these reports. This mode is used when neither
NSYS_HW_IDorNSYS_SYSTEM_IDis set and target hostnames are different or absent, and can be additionally signalled by specifying differentNSYS_HW_IDvalues.Different systems, same hardware — is used when reports are collected on different virtual machines (VMs) or containers on the same physical machine. To activate this mode, specify the same value of
NSYS_HW_IDwhen collecting the reports.Same system — is used when reports are collected within the same operating system (or container) environment. In this mode a process identifier (PID) 100 will refer to the same process in both reports. To manually activate this mode, specify the same value of
NSYS_SYSTEM_IDwhen collecting the reports. This mode is automatically selected when target hostnames are the same and neitherNSYS_HW_IDorNSYS_SYSTEM_IDis provided.
The following diagrams demonstrate typical cases:
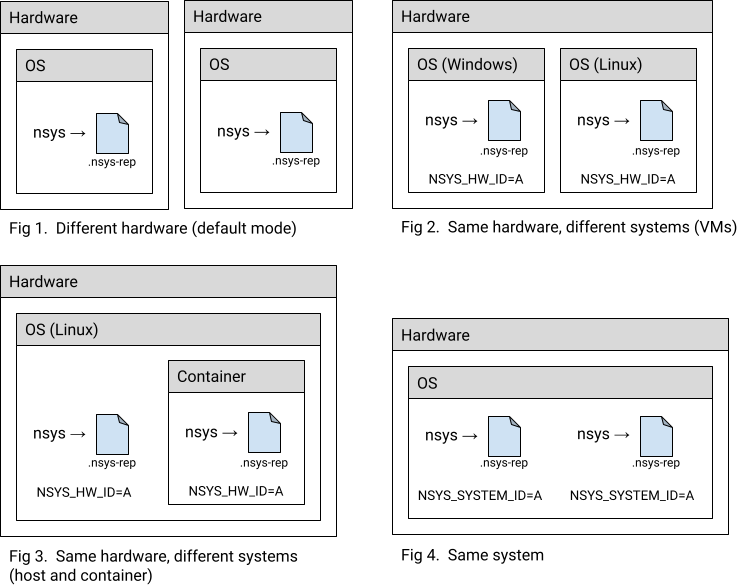
Example: MPI
A typical scenario is when a computing job is run using one of the MPI implementations. Each instance of the app can be profiled separately, resulting in multiple report files. For example:
# Run MPI job without the profiler:
mpirun <mpirun-options> ./myApp
# Run MPI job and profile each instance of the application:
mpirun <mpirun-options> nsys profile -o report-%p <nsys-options>./myApp
When each MPI rank runs on a different node, the command above works fine, since the default pairing mode (different hardware) will be used.
When all MPI ranks run the localhost only, use this command (value “A” was chosen arbitrarily, it can be any non-empty string):
NSYS_SYSTEM_ID=A mpirun <mpirun-options> nsys profile -o report-%p < nsys -options> ./myApp
For convenience, the MPI rank can be encoded into the report filename. For Open MPI, use the following command to create report files based on the global rank value:
mpirun <mpirun-options> nsys profile -o report-%q{OMPI_COMM_WORLD_RANK} < nsys -options> ./myApp
MPICH-based implementations set the environment variable PMI_RANK and Slurm (srun) provides the global MPI rank in SLURM_PROCID.
Limitations
Only report files collected with Nsight Systems version 2021.3 and newer are fully supported.
Sequential reports collected in a single CLI profiling session cannot be loaded into a single timeline yet.
Post-Collection Analysis
Once you have profiled using Nsight Systems there are many options for analyzing the collected data as well as to output it in various formats. These options are available from the CLI or the GUI
Available Export Formats
SQLite Schema Reference
Nsight Systems has the ability to export SQLite database files from the .nsys-rep results file. From the CLI, use nsys export. From the GUI, call File->Export....
Note: The .nsys-rep report format is the only data format for Nsight Systems that should be considered forward compatible. The SQLite schema can and will change in the future.
The schema for a concrete database can be obtained with the sqlite3 tool built-in command .schema. The sqlite3 tool can be located in the Target or Host directory of your Nsight Systems installation.
Note: Currently tables are created lazily, and therefore not every table described in the documentation will be present in a particular database. This will change in a future version of the product. If you want a full schema of all possible tables, use nsys export --lazy=false during export phase.
Currently, a table is created for each data type in the exported database. Since usage patterns for exported data may vary greatly and no default use cases have been established, no indexes or extra constraints are created. Instead, refer to the SQLite Examples section for a list of common recipes. This may change in a future version of the product.
To check the version of your exported SQLite file, check the value of EXPORT_SCHEMA_VERSION in the EXPORT_META_DATA table. The schema version is a common three-value major/minor/micro version number. The first value, or major value, indicates the overall format of the database, and is only changed if there is a major re-write or re-factor of the entire database format. It is assumed that if the major version changes, all scripts or queries will break. The middle, or minor, version is changed anytime there is a more localized, but potentially breaking change, such as renaming an existing column, or changing the type of an existing column. The last, or micro version is changed any time there are additions, such as a new table or column, that should not introduce any breaking change when used with well-written, best-practices queries.
This is the schema as of the 2023.2 release, schema version 3.1.7.
CREATE TABLE StringIds (
-- Consolidation of repetitive string values.
id INTEGER NOT NULL PRIMARY KEY, -- ID reference value.
value TEXT NOT NULL -- String value.
);
CREATE TABLE ThreadNames (
nameId INTEGER NOT NULL, -- REFERENCES StringIds(id) -- Thread name
priority INTEGER, -- Priority of the thread.
globalTid INTEGER -- Serialized GlobalId.
);
CREATE TABLE ProcessStreams (
globalPid INTEGER NOT NULL, -- Serialized GlobalId.
filenameId INTEGER NOT NULL, -- REFERENCES StringIds(id) -- File name
contentId INTEGER NOT NULL -- REFERENCES StringIds(id) -- Stream content
);
CREATE TABLE TARGET_INFO_SYSTEM_ENV (
globalVid INTEGER, -- Serialized GlobalId.
devStateName TEXT NOT NULL, -- Device state name.
name TEXT NOT NULL, -- Property name.
nameEnum INTEGER NOT NULL, -- Property enum value.
value TEXT NOT NULL -- Property value.
);
CREATE TABLE TARGET_INFO_NIC_INFO (
globalId INTEGER, -- Device state globalId
stateName TEXT NOT NULL, -- Device state name
nicId INTEGER NOT NULL, -- Network interface Id.
name TEXT NOT NULL, -- Network interface name
deviceId INTEGER NOT NULL, -- REFERENCES ENUM_NET_DEVICE_ID(id)
vendorId INTEGER NOT NULL, -- REFERENCES ENUM_NET_VENDOR_ID(id)
linkLayer INTEGER NOT NULL -- REFERENCES ENUM_NET_LINK_TYPE(id)
);
CREATE TABLE TARGET_INFO_SESSION_START_TIME (
utcEpochNs INTEGER, -- UTC Epoch timestamp at start of the capture (ns).
utcTime TEXT, -- Start of the capture in UTC.
localTime TEXT -- Start of the capture in local time of target.
);
CREATE TABLE ANALYSIS_DETAILS (
-- Details about the analysis session.
globalVid INTEGER NOT NULL, -- Serialized GlobalId.
duration INTEGER NOT NULL, -- The total time span of the entire trace (ns).
startTime INTEGER NOT NULL, -- Trace start timestamp in nanoseconds.
stopTime INTEGER NOT NULL -- Trace stop timestamp in nanoseconds.
);
CREATE TABLE TARGET_INFO_GPU (
vmId INTEGER NOT NULL, -- Serialized GlobalId.
id INTEGER NOT NULL, -- Device ID.
name TEXT, -- Device name.
busLocation TEXT, -- PCI bus location.
isDiscrete INTEGER, -- True if discrete, false if integrated.
l2CacheSize INTEGER, -- Size of L2 cache (B).
totalMemory INTEGER, -- Total amount of memory on the device (B).
memoryBandwidth INTEGER, -- Amount of memory transferred (B).
clockRate INTEGER, -- Clock frequency (Hz).
smCount INTEGER, -- Number of multiprocessors on the device.
pwGpuId INTEGER, -- PerfWorks GPU ID.
uuid TEXT, -- Device UUID.
luid INTEGER, -- Device LUID.
chipName TEXT, -- Chip name.
cuDevice INTEGER, -- CUDA device ID.
ctxswDevPath TEXT, -- GPU context switch device node path.
ctrlDevPath TEXT, -- GPU control device node path.
revision INTEGER, -- Revision number.
nodeMask INTEGER, -- Device node mask.
constantMemory INTEGER, -- Memory available on device for __constant__ variables (B).
maxIPC INTEGER, -- Maximum instructions per count.
maxRegistersPerBlock INTEGER, -- Maximum number of 32-bit registers available per block.
maxShmemPerBlock INTEGER, -- Maximum optin shared memory per block.
maxShmemPerBlockOptin INTEGER, -- Maximum optin shared memory per block.
maxShmemPerSm INTEGER, -- Maximum shared memory available per multiprocessor (B).
maxRegistersPerSm INTEGER, -- Maximum number of 32-bit registers available per multiprocessor.
threadsPerWarp INTEGER, -- Warp size in threads.
asyncEngines INTEGER, -- Number of asynchronous engines.
maxWarpsPerSm INTEGER, -- Maximum number of warps per multiprocessor.
maxBlocksPerSm INTEGER, -- Maximum number of blocks per multiprocessor.
maxThreadsPerBlock INTEGER, -- Maximum number of threads per block.
maxBlockDimX INTEGER, -- Maximum X-dimension of a block.
maxBlockDimY INTEGER, -- Maximum Y-dimension of a block.
maxBlockDimZ INTEGER, -- Maximum Z-dimension of a block.
maxGridDimX INTEGER, -- Maximum X-dimension of a grid.
maxGridDimY INTEGER, -- Maximum Y-dimension of a grid.
maxGridDimZ INTEGER, -- Maximum Z-dimension of a grid.
computeMajor INTEGER, -- Major compute capability version number.
computeMinor INTEGER, -- Minor compute capability version number.
smMajor INTEGER, -- Major multiprocessor version number.
smMinor INTEGER -- Minor multiprocessor version number.
);
CREATE TABLE TARGET_INFO_XMC_SPEC (
vmId INTEGER NOT NULL, -- Serialized GlobalId.
clientId INTEGER NOT NULL, -- Client ID.
type TEXT NOT NULL, -- Client type.
name TEXT NOT NULL, -- Client name.
groupId TEXT NOT NULL -- Client group ID.
);
CREATE TABLE TARGET_INFO_PROCESS (
processId INTEGER NOT NULL, -- Process ID.
openGlVersion TEXT NOT NULL, -- OpenGL version.
correlationId INTEGER NOT NULL, -- Correlation ID of the kernel.
nameId INTEGER NOT NULL -- REFERENCES StringIds(id) -- Function name
);
CREATE TABLE TARGET_INFO_NVTX_CUDA_DEVICE (
name TEXT NOT NULL, -- CUDA device name assigned using NVTX.
hwId INTEGER NOT NULL, -- Hardware ID.
vmId INTEGER NOT NULL, -- VM ID.
deviceId INTEGER NOT NULL -- Device ID.
);
CREATE TABLE TARGET_INFO_NVTX_CUDA_CONTEXT (
name TEXT NOT NULL, -- CUDA context name assigned using NVTX.
hwId INTEGER NOT NULL, -- Hardware ID.
vmId INTEGER NOT NULL, -- VM ID.
processId INTEGER NOT NULL, -- Process ID.
deviceId INTEGER NOT NULL, -- Device ID.
contextId INTEGER NOT NULL -- Context ID.
);
CREATE TABLE TARGET_INFO_NVTX_CUDA_STREAM (
name TEXT NOT NULL, -- CUDA stream name assigned using NVTX.
hwId INTEGER NOT NULL, -- Hardware ID.
vmId INTEGER NOT NULL, -- VM ID.
processId INTEGER NOT NULL, -- Process ID.
deviceId INTEGER NOT NULL, -- Device ID.
contextId INTEGER NOT NULL, -- Context ID.
streamId INTEGER NOT NULL -- Stream ID.
);
CREATE TABLE TARGET_INFO_CUDA_NULL_STREAM (
streamId INTEGER NOT NULL, -- Stream ID.
hwId INTEGER NOT NULL, -- Hardware ID.
vmId INTEGER NOT NULL, -- VM ID.
processId INTEGER NOT NULL, -- Process ID.
deviceId INTEGER NOT NULL, -- Device ID.
contextId INTEGER NOT NULL -- Context ID.
);
CREATE TABLE TARGET_INFO_CUDA_STREAM (
streamId INTEGER NOT NULL, -- Stream ID.
hwId INTEGER NOT NULL, -- Hardware ID.
vmId INTEGER NOT NULL, -- VM ID.
processId INTEGER NOT NULL, -- Process ID.
contextId INTEGER NOT NULL, -- Context ID.
priority INTEGER NOT NULL, -- Priority of the stream.
flag INTEGER NOT NULL -- REFERENCES ENUM_CUPTI_STREAM_TYPE(id)
);
CREATE TABLE TARGET_INFO_WDDM_CONTEXTS (
context INTEGER NOT NULL,
engineType INTEGER NOT NULL,
nodeOrdinal INTEGER NOT NULL,
friendlyName TEXT NOT NULL
);
CREATE TABLE TARGET_INFO_PERF_COUNTER (
counterId INTEGER NOT NULL, -- Counter ID value
name TEXT NOT NULL, -- Counter name
description TEXT NOT NULL, -- Counter description
unit TEXT NOT NULL -- Counter measurement unit
);
CREATE TABLE TARGET_INFO_NETWORK_METRICS (
metricsListId INTEGER NOT NULL, -- Metric list ID
metricsIdx INTEGER NOT NULL, -- List index of metric
name TEXT NOT NULL, -- Name of metric
description TEXT NOT NULL, -- Description of metric
unit TEXT NOT NULL -- Measurement unit of metric
);
CREATE TABLE EXPORT_META_DATA (
-- information about nsys export process
name TEXT NOT NULL, -- Name of export meta-data record
value TEXT -- Value of export meta-data record
);
CREATE TABLE ENUM_NSYS_EVENT_TYPE (
-- Nsys event type labels
id INTEGER NOT NULL PRIMARY KEY, -- Enum numerical value
name TEXT, -- Enum symbol name
label TEXT -- Enum human name
);
CREATE TABLE ENUM_NSYS_EVENT_CLASS (
-- Nsys event class labels
id INTEGER NOT NULL PRIMARY KEY, -- Enum numerical value
name TEXT, -- Enum symbol name
label TEXT -- Enum human name
);
CREATE TABLE ENUM_GPU_CTX_SWITCH (
-- GPU context switch labels
id INTEGER NOT NULL PRIMARY KEY, -- Enum numerical value
name TEXT, -- Enum symbol name
label TEXT -- Enum human name
);
CREATE TABLE ENUM_CUDA_MEMCPY_OPER (
-- CUDA memcpy operation labels
id INTEGER NOT NULL PRIMARY KEY, -- Enum numerical value
name TEXT, -- Enum symbol name
label TEXT -- Enum human name
);
CREATE TABLE ENUM_CUDA_MEM_KIND (
-- CUDA memory kind labels
id INTEGER NOT NULL PRIMARY KEY, -- Enum numerical value
name TEXT, -- Enum symbol name
label TEXT -- Enum human name
);
CREATE TABLE ENUM_CUDA_MEMPOOL_TYPE (
-- CUDA mempool type labels
id INTEGER NOT NULL PRIMARY KEY, -- Enum numerical value
name TEXT, -- Enum symbol name
label TEXT -- Enum human name
);
CREATE TABLE ENUM_CUDA_MEMPOOL_OPER (
-- CUDA mempool operation labels
id INTEGER NOT NULL PRIMARY KEY, -- Enum numerical value
name TEXT, -- Enum symbol name
label TEXT -- Enum human name
);
CREATE TABLE ENUM_CUDA_DEV_MEM_EVENT_OPER (
-- CUDA device mem event operation labels
id INTEGER NOT NULL PRIMARY KEY, -- Enum numerical value
name TEXT, -- Enum symbol name
label TEXT -- Enum human name
);
CREATE TABLE ENUM_CUDA_KERNEL_LAUNCH_TYPE (
-- CUDA kernel launch type labels
id INTEGER NOT NULL PRIMARY KEY, -- Enum numerical value
name TEXT, -- Enum symbol name
label TEXT -- Enum human name
);
CREATE TABLE ENUM_CUDA_SHARED_MEM_LIMIT_CONFIG (
-- CUDA shared memory limit config labels
id INTEGER NOT NULL PRIMARY KEY, -- Enum numerical value
name TEXT, -- Enum symbol name
label TEXT -- Enum human name
);
CREATE TABLE ENUM_CUDA_UNIF_MEM_MIGRATION (
-- CUDA unified memory migration cause labels
id INTEGER NOT NULL PRIMARY KEY, -- Enum numerical value
name TEXT, -- Enum symbol name
label TEXT -- Enum human name
);
CREATE TABLE ENUM_CUDA_UNIF_MEM_ACCESS_TYPE (
-- CUDA unified memory access type labels
id INTEGER NOT NULL PRIMARY KEY, -- Enum numerical value
name TEXT, -- Enum symbol name
label TEXT -- Enum human name
);
CREATE TABLE ENUM_CUDA_FUNC_CACHE_CONFIG (
-- CUDA function cache config labels
id INTEGER NOT NULL PRIMARY KEY, -- Enum numerical value
name TEXT, -- Enum symbol name
label TEXT -- Enum human name
);
CREATE TABLE ENUM_CUPTI_STREAM_TYPE (
-- CUPTI stream type labels
id INTEGER NOT NULL PRIMARY KEY, -- Enum numerical value
name TEXT, -- Enum symbol name
label TEXT -- Enum human name
);
CREATE TABLE ENUM_CUPTI_SYNC_TYPE (
-- CUPTI synchronization type labels
id INTEGER NOT NULL PRIMARY KEY, -- Enum numerical value
name TEXT, -- Enum symbol name
label TEXT -- Enum human name
);
CREATE TABLE ENUM_STACK_UNWIND_METHOD (
-- Stack unwind method labels
id INTEGER NOT NULL PRIMARY KEY, -- Enum numerical value
name TEXT, -- Enum symbol name
label TEXT -- Enum human name
);
CREATE TABLE ENUM_SAMPLING_THREAD_STATE (
-- Sampling thread state labels
id INTEGER NOT NULL PRIMARY KEY, -- Enum numerical value
name TEXT, -- Enum symbol name
label TEXT -- Enum human name
);
CREATE TABLE ENUM_OPENGL_DEBUG_SOURCE (
-- OpenGL debug source labels
id INTEGER NOT NULL PRIMARY KEY, -- Enum numerical value
name TEXT, -- Enum symbol name
label TEXT -- Enum human name
);
CREATE TABLE ENUM_OPENGL_DEBUG_TYPE (
-- OpenGL debug type labels
id INTEGER NOT NULL PRIMARY KEY, -- Enum numerical value
name TEXT, -- Enum symbol name
label TEXT -- Enum human name
);
CREATE TABLE ENUM_OPENGL_DEBUG_SEVERITY (
-- OpenGL debug severity labels
id INTEGER NOT NULL PRIMARY KEY, -- Enum numerical value
name TEXT, -- Enum symbol name
label TEXT -- Enum human name
);
CREATE TABLE ENUM_VULKAN_PIPELINE_CREATION_FLAGS (
-- Vulkan pipeline creation feedback flag labels
id INTEGER NOT NULL PRIMARY KEY, -- Enum numerical value
name TEXT, -- Enum symbol name
label TEXT -- Enum human name
);
CREATE TABLE ENUM_D3D12_HEAP_TYPE (
-- D3D12 heap type labels
id INTEGER NOT NULL PRIMARY KEY, -- Enum numerical value
name TEXT, -- Enum symbol name
label TEXT -- Enum human name
);
CREATE TABLE ENUM_D3D12_PAGE_PROPERTY (
-- D3D12 CPU page property labels
id INTEGER NOT NULL PRIMARY KEY, -- Enum numerical value
name TEXT, -- Enum symbol name
label TEXT -- Enum human name
);
CREATE TABLE ENUM_D3D12_HEAP_FLAGS (
-- D3D12 heap flag labels
id INTEGER NOT NULL PRIMARY KEY, -- Enum numerical value
name TEXT, -- Enum symbol name
label TEXT -- Enum human name
);
CREATE TABLE ENUM_D3D12_CMD_LIST_TYPE (
-- D3D12 command list type labels
id INTEGER NOT NULL PRIMARY KEY, -- Enum numerical value
name TEXT, -- Enum symbol name
label TEXT -- Enum human name
);
CREATE TABLE ENUM_OPENACC_DEVICE (
-- OpenACC device type labels
id INTEGER NOT NULL PRIMARY KEY, -- Enum numerical value
name TEXT, -- Enum symbol name
label TEXT -- Enum human name
);
CREATE TABLE ENUM_OPENACC_EVENT_KIND (
-- OpenACC event type labels
id INTEGER NOT NULL PRIMARY KEY, -- Enum numerical value
name TEXT, -- Enum symbol name
label TEXT -- Enum human name
);
CREATE TABLE ENUM_OPENMP_EVENT_KIND (
-- OpenMP event kind labels
id INTEGER NOT NULL PRIMARY KEY, -- Enum numerical value
name TEXT, -- Enum symbol name
label TEXT -- Enum human name
);
CREATE TABLE ENUM_OPENMP_THREAD (
-- OpenMP thread labels
id INTEGER NOT NULL PRIMARY KEY, -- Enum numerical value
name TEXT, -- Enum symbol name
label TEXT -- Enum human name
);
CREATE TABLE ENUM_OPENMP_DISPATCH (
-- OpenMP dispatch labels
id INTEGER NOT NULL PRIMARY KEY, -- Enum numerical value
name TEXT, -- Enum symbol name
label TEXT -- Enum human name
);
CREATE TABLE ENUM_OPENMP_SYNC_REGION (
-- OpenMP sync region labels
id INTEGER NOT NULL PRIMARY KEY, -- Enum numerical value
name TEXT, -- Enum symbol name
label TEXT -- Enum human name
);
CREATE TABLE ENUM_OPENMP_WORK (
-- OpenMP work labels
id INTEGER NOT NULL PRIMARY KEY, -- Enum numerical value
name TEXT, -- Enum symbol name
label TEXT -- Enum human name
);
CREATE TABLE ENUM_OPENMP_MUTEX (
-- OpenMP mutex labels
id INTEGER NOT NULL PRIMARY KEY, -- Enum numerical value
name TEXT, -- Enum symbol name
label TEXT -- Enum human name
);
CREATE TABLE ENUM_OPENMP_TASK_FLAG (
-- OpenMP task flags labels
id INTEGER NOT NULL PRIMARY KEY, -- Enum numerical value
name TEXT, -- Enum symbol name
label TEXT -- Enum human name
);
CREATE TABLE ENUM_OPENMP_TASK_STATUS (
-- OpenMP task status labels
id INTEGER NOT NULL PRIMARY KEY, -- Enum numerical value
name TEXT, -- Enum symbol name
label TEXT -- Enum human name
);
CREATE TABLE ENUM_SLI_TRANSER (
-- OpenMP task status labels
id INTEGER NOT NULL PRIMARY KEY, -- Enum numerical value
name TEXT, -- Enum symbol name
label TEXT -- Enum human name
);
CREATE TABLE ENUM_DXGI_FORMAT (
-- DXGI image format labels
id INTEGER NOT NULL PRIMARY KEY, -- Enum numerical value
name TEXT, -- Enum symbol name
label TEXT -- Enum human name
);
CREATE TABLE ENUM_NVDRIVER_EVENT_ID (
-- NV-Driver event it labels
id INTEGER NOT NULL PRIMARY KEY, -- Enum numerical value
name TEXT, -- Enum symbol name
label TEXT -- Enum human name
);
CREATE TABLE ENUM_WDDM_PAGING_QUEUE_TYPE (
-- WDDM paging queue type labels
id INTEGER NOT NULL PRIMARY KEY, -- Enum numerical value
name TEXT, -- Enum symbol name
label TEXT -- Enum human name
);
CREATE TABLE ENUM_WDDM_PACKET_TYPE (
-- WDDM packet type labels
id INTEGER NOT NULL PRIMARY KEY, -- Enum numerical value
name TEXT, -- Enum symbol name
label TEXT -- Enum human name
);
CREATE TABLE ENUM_WDDM_ENGINE_TYPE (
-- WDDM engine type labels
id INTEGER NOT NULL PRIMARY KEY, -- Enum numerical value
name TEXT, -- Enum symbol name
label TEXT -- Enum human name
);
CREATE TABLE ENUM_WDDM_INTERRUPT_TYPE (
-- WDDM DMA interrupt type labels
id INTEGER NOT NULL PRIMARY KEY, -- Enum numerical value
name TEXT, -- Enum symbol name
label TEXT -- Enum human name
);
CREATE TABLE ENUM_WDDM_VIDMM_OP_TYPE (
-- WDDM VidMm operation type labels
id INTEGER NOT NULL PRIMARY KEY, -- Enum numerical value
name TEXT, -- Enum symbol name
label TEXT -- Enum human name
);
CREATE TABLE ENUM_NET_LINK_TYPE (
-- NIC link layer labels
id INTEGER NOT NULL PRIMARY KEY, -- Enum numerical value
name TEXT, -- Enum symbol name
label TEXT -- Enum human name
);
CREATE TABLE ENUM_NET_DEVICE_ID (
-- NIC PCIe device id labels
id INTEGER NOT NULL PRIMARY KEY, -- Enum numerical value
name TEXT, -- Enum symbol name
label TEXT -- Enum human name
);
CREATE TABLE ENUM_NET_VENDOR_ID (
-- NIC PCIe vendor id labels
id INTEGER NOT NULL PRIMARY KEY, -- Enum numerical value
name TEXT, -- Enum symbol name
label TEXT -- Enum human name
);
CREATE TABLE ENUM_ETW_MEMORY_TRANSFER_TYPE (
-- memory transfer type labels
id INTEGER NOT NULL PRIMARY KEY, -- Enum numerical value
name TEXT, -- Enum symbol name
label TEXT -- Enum human name
);
CREATE TABLE GENERIC_EVENT_SOURCES (
sourceId INTEGER NOT NULL PRIMARY KEY, -- Serialized GlobalId.
data TEXT NOT NULL -- JSON encoded generic event source description.
);
CREATE TABLE GENERIC_EVENT_TYPES (
typeId INTEGER NOT NULL PRIMARY KEY, -- Serialized GlobalId.
sourceId INTEGER NOT NULL, -- REFERENCES GENERIC_EVENT_SOURCES(sourceId)
data TEXT NOT NULL -- JSON encoded generic event type description.
);
CREATE TABLE GENERIC_EVENTS (
-- Events for which the schema is known only at the run-time.
rawTimestamp INTEGER NOT NULL, -- Raw event timestamp recorded during profiling.
timestamp INTEGER, -- Event timestamp converted to the profiling session timeline.
typeId INTEGER NOT NULL, -- REFERENCES GENERIC_EVENT_TYPES(typeId)
data TEXT NOT NULL -- JSON encoded event data.
);
CREATE TABLE ETW_PROVIDERS (
-- Names and identifiers of ETW providers captured in the report.
providerId INTEGER NOT NULL PRIMARY KEY, -- Provider ID.
providerNameId INTEGER NOT NULL, -- REFERENCES StringIds(id) -- Provider name
guid TEXT NOT NULL -- ETW Provider GUID.
);
CREATE TABLE ETW_TASKS (
-- Names and identifiers of ETW tasks captured in the report.
taskNameId INTEGER NOT NULL, -- REFERENCES StringIds(id) -- Task name
taskId INTEGER NOT NULL, -- The event task ID.
providerId INTEGER NOT NULL -- Provider ID.
);
CREATE TABLE ETW_EVENTS (
-- Raw ETW events captured in the report.
timestamp INTEGER NOT NULL, -- Event start timestamp (ns).
processId INTEGER, -- Process ID.
threadId INTEGER, -- Thread ID.
providerId INTEGER NOT NULL, -- Provider ID.
taskId INTEGER NOT NULL, -- The event task ID.
eventId INTEGER NOT NULL, -- Event ID.
version INTEGER NOT NULL, -- The event version.
opcode INTEGER, -- The event opcode.
data TEXT NOT NULL -- JSON encoded event data.
);
CREATE TABLE TARGET_INFO_GPU_METRICS (
-- GPU Metrics, metric names and ids.
typeId INTEGER NOT NULL, -- REFERENCES GENERIC_EVENT_TYPES(typeId)
sourceId INTEGER NOT NULL, -- REFERENCES GENERIC_EVENT_SOURCES(sourceId)
typeName TEXT NOT NULL, -- Name of event type.
metricId INTEGER NOT NULL, -- Id of metric in event; not assumed to be stable.
metricName TEXT NOT NULL -- Definitive name of metric.
);
CREATE TABLE GPU_METRICS (
-- GPU Metrics, events and values.
timestamp INTEGER, -- Event timestamp (ns).
typeId INTEGER NOT NULL, -- REFERENCES TARGET_INFO_GPU_METRICS(typeId) and GENERIC_EVENT_TYPES(typeId)
metricId INTEGER NOT NULL, -- REFERENCES TARGET_INFO_GPU_METRICS(metricId)
value INTEGER NOT NULL -- Counter data value
);
CREATE TABLE MPI_COMMUNICATORS (
-- Identification of MPI communication groups.
rank INTEGER, -- Active MPI rank
timestamp INTEGER, -- Time of MPI communicator creation.
commHandle INTEGER, -- MPI communicator handle
parentHandle INTEGER, -- MPI communicator handle
localRank INTEGER, -- Local MPI rank in a communicator.
size INTEGER, -- MPI communicator size.
groupRoot INTEGER, -- Root rank (global) in MPI communicator.
groupRootUid INTEGER, -- Group root's communicator ID.
members TEXT -- MPI communicator members (index is global rank).
);
CREATE TABLE CUPTI_ACTIVITY_KIND_MEMCPY (
start INTEGER NOT NULL, -- Event start timestamp (ns).
end INTEGER NOT NULL, -- Event end timestamp (ns).
deviceId INTEGER NOT NULL, -- Device ID.
contextId INTEGER NOT NULL, -- Context ID.
streamId INTEGER NOT NULL, -- Stream ID.
correlationId INTEGER, -- REFERENCES CUPTI_ACTIVITY_KIND_RUNTIME(correlationId)
globalPid INTEGER, -- Serialized GlobalId.
bytes INTEGER NOT NULL, -- Number of bytes transferred (B).
copyKind INTEGER NOT NULL, -- REFERENCES ENUM_CUDA_MEMCPY_OPER(id)
deprecatedSrcId INTEGER, -- Deprecated, use srcDeviceId instead.
srcKind INTEGER, -- REFERENCES ENUM_CUDA_MEM_KIND(id)
dstKind INTEGER, -- REFERENCES ENUM_CUDA_MEM_KIND(id)
srcDeviceId INTEGER, -- Source device ID.
srcContextId INTEGER, -- Source context ID.
dstDeviceId INTEGER, -- Destination device ID.
dstContextId INTEGER, -- Destination context ID.
migrationCause INTEGER, -- REFERENCES ENUM_CUDA_UNIF_MEM_MIGRATION(id)
graphNodeId INTEGER, -- REFERENCES CUDA_GRAPH_EVENTS(graphNodeId)
virtualAddress INTEGER -- Virtual base address of the page/s being transferred.
);
CREATE TABLE CUPTI_ACTIVITY_KIND_MEMSET (
start INTEGER NOT NULL, -- Event start timestamp (ns).
end INTEGER NOT NULL, -- Event end timestamp (ns).
deviceId INTEGER NOT NULL, -- Device ID.
contextId INTEGER NOT NULL, -- Context ID.
streamId INTEGER NOT NULL, -- Stream ID.
correlationId INTEGER, -- REFERENCES CUPTI_ACTIVITY_KIND_RUNTIME(correlationId)
globalPid INTEGER, -- Serialized GlobalId.
value INTEGER NOT NULL, -- Value assigned to memory.
bytes INTEGER NOT NULL, -- Number of bytes set (B).
graphNodeId INTEGER, -- REFERENCES CUDA_GRAPH_EVENTS(graphNodeId)
memKind INTEGER -- REFERENCES ENUM_CUDA_MEM_KIND(id)
);
CREATE TABLE CUPTI_ACTIVITY_KIND_KERNEL (
start INTEGER NOT NULL, -- Event start timestamp (ns).
end INTEGER NOT NULL, -- Event end timestamp (ns).
deviceId INTEGER NOT NULL, -- Device ID.
contextId INTEGER NOT NULL, -- Context ID.
streamId INTEGER NOT NULL, -- Stream ID.
correlationId INTEGER, -- REFERENCES CUPTI_ACTIVITY_KIND_RUNTIME(correlationId)
globalPid INTEGER, -- Serialized GlobalId.
demangledName INTEGER NOT NULL, -- REFERENCES StringIds(id) -- Kernel function name w/ templates
shortName INTEGER NOT NULL, -- REFERENCES StringIds(id) -- Base kernel function name
mangledName INTEGER, -- REFERENCES StringIds(id) -- Raw C++ mangled kernel function name
launchType INTEGER, -- REFERENCES ENUM_CUDA_KERNEL_LAUNCH_TYPE(id)
cacheConfig INTEGER, -- REFERENCES ENUM_CUDA_FUNC_CACHE_CONFIG(id)
registersPerThread INTEGER NOT NULL, -- Number of registers required for each thread executing the kernel.
gridX INTEGER NOT NULL, -- X-dimension grid size.
gridY INTEGER NOT NULL, -- Y-dimension grid size.
gridZ INTEGER NOT NULL, -- Z-dimension grid size.
blockX INTEGER NOT NULL, -- X-dimension block size.
blockY INTEGER NOT NULL, -- Y-dimension block size.
blockZ INTEGER NOT NULL, -- Z-dimension block size.
staticSharedMemory INTEGER NOT NULL, -- Static shared memory allocated for the kernel (B).
dynamicSharedMemory INTEGER NOT NULL, -- Dynamic shared memory reserved for the kernel (B).
localMemoryPerThread INTEGER NOT NULL, -- Amount of local memory reserved for each thread (B).
localMemoryTotal INTEGER NOT NULL, -- Total amount of local memory reserved for the kernel (B).
gridId INTEGER NOT NULL, -- Unique grid ID of the kernel assigned at runtime.
sharedMemoryExecuted INTEGER, -- Shared memory size set by the driver.
graphNodeId INTEGER, -- REFERENCES CUDA_GRAPH_EVENTS(graphNodeId)
sharedMemoryLimitConfig INTEGER -- REFERENCES ENUM_CUDA_SHARED_MEM_LIMIT_CONFIG(id)
);
CREATE TABLE CUPTI_ACTIVITY_KIND_SYNCHRONIZATION (
start INTEGER NOT NULL, -- Event start timestamp (ns).
end INTEGER NOT NULL, -- Event end timestamp (ns).
deviceId INTEGER NOT NULL, -- Device ID.
contextId INTEGER NOT NULL, -- Context ID.
streamId INTEGER NOT NULL, -- Stream ID.
correlationId INTEGER, -- Correlation ID of the synchronization API to which this result is associated.
globalPid INTEGER, -- Serialized GlobalId.
syncType INTEGER NOT NULL, -- REFERENCES ENUM_CUPTI_SYNC_TYPE(id)
eventId INTEGER NOT NULL -- Event ID for which the synchronization API is called.
);
CREATE TABLE CUPTI_ACTIVITY_KIND_CUDA_EVENT (
deviceId INTEGER NOT NULL, -- Device ID.
contextId INTEGER NOT NULL, -- Context ID.
streamId INTEGER NOT NULL, -- Stream ID.
correlationId INTEGER, -- Correlation ID of the event record API to which this result is associated.
globalPid INTEGER, -- Serialized GlobalId.
eventId INTEGER NOT NULL -- Event ID for which the event record API is called.
);
CREATE TABLE CUPTI_ACTIVITY_KIND_RUNTIME (
start INTEGER NOT NULL, -- Event start timestamp (ns).
end INTEGER NOT NULL, -- Event end timestamp (ns).
eventClass INTEGER NOT NULL, -- REFERENCES ENUM_NSYS_EVENT_CLASS(id)
globalTid INTEGER, -- Serialized GlobalId.
correlationId INTEGER, -- ID used to identify events that this function call has triggered.
nameId INTEGER NOT NULL, -- REFERENCES StringIds(id) -- Function name
returnValue INTEGER NOT NULL, -- Return value of the function call.
callchainId INTEGER -- REFERENCES CUDA_CALLCHAINS(id)
);
CREATE TABLE CUDNN_EVENTS (
start INTEGER NOT NULL, -- Event start timestamp (ns).
end INTEGER NOT NULL, -- Event end timestamp (ns).
eventClass INTEGER NOT NULL, -- REFERENCES ENUM_NSYS_EVENT_CLASS(id)
globalTid INTEGER, -- Serialized GlobalId.
nameId INTEGER NOT NULL -- REFERENCES StringIds(id) -- Function name
);
CREATE TABLE CUBLAS_EVENTS (
start INTEGER NOT NULL, -- Event start timestamp (ns).
end INTEGER NOT NULL, -- Event end timestamp (ns).
eventClass INTEGER NOT NULL, -- REFERENCES ENUM_NSYS_EVENT_CLASS(id)
globalTid INTEGER, -- Serialized GlobalId.
nameId INTEGER NOT NULL -- REFERENCES StringIds(id) -- Function name
);
CREATE TABLE CUDA_GRAPH_EVENTS (
start INTEGER NOT NULL, -- Event start timestamp (ns).
end INTEGER NOT NULL, -- Event end timestamp (ns).
eventClass INTEGER NOT NULL, -- REFERENCES ENUM_NSYS_EVENT_CLASS(id)
globalTid INTEGER, -- Serialized GlobalId.
nameId INTEGER NOT NULL, -- REFERENCES StringIds(id) -- Function name
graphNodeId INTEGER NOT NULL, -- REFERENCES CUDA_GRAPH_EVENTS(graphNodeId)
originalGraphNodeId INTEGER -- Reference to the original graph node ID, if cloned node.
);
CREATE TABLE CUDA_UM_CPU_PAGE_FAULT_EVENTS (
start INTEGER NOT NULL, -- Event start timestamp (ns).
globalPid INTEGER NOT NULL, -- Serialized GlobalId.
address INTEGER NOT NULL, -- Virtual address of the page that faulted.
originalFaultPc INTEGER, -- Program counter of the CPU instruction that caused the page fault.
CpuInstruction INTEGER NOT NULL, -- REFERENCES StringIds(id) -- Function name
module INTEGER NOT NULL, -- REFERENCES StringIds(id) -- Module name
unresolvedFaultPc INTEGER -- True if the program counter was not resolved.
);
CREATE TABLE CUDA_UM_GPU_PAGE_FAULT_EVENTS (
start INTEGER NOT NULL, -- Event start timestamp (ns).
end INTEGER NOT NULL, -- Event end timestamp (ns).
globalPid INTEGER NOT NULL, -- Serialized GlobalId.
deviceId INTEGER NOT NULL, -- Device ID.
address INTEGER NOT NULL, -- Virtual address of the page that faulted.
numberOfPageFaults INTEGER NOT NULL, -- Number of page faults for the same page.
faultAccessType INTEGER NOT NULL -- REFERENCES ENUM_CUDA_UNIF_MEM_ACCESS_TYPE(id)
);
CREATE TABLE CUDA_GPU_MEMORY_USAGE_EVENTS (
start INTEGER NOT NULL, -- Event start timestamp (ns).
globalPid INTEGER NOT NULL, -- Serialized GlobalId.
deviceId INTEGER NOT NULL, -- Device ID.
contextId INTEGER NOT NULL, -- Context ID.
address INTEGER NOT NULL, -- Virtual address of the allocation/deallocation.
pc INTEGER NOT NULL, -- Program counter of the allocation/deallocation.
bytes INTEGER NOT NULL, -- Number of bytes allocated/deallocated (B).
memKind INTEGER NOT NULL, -- REFERENCES ENUM_CUDA_MEM_KIND(id)
memoryOperationType INTEGER NOT NULL, -- REFERENCES ENUM_CUDA_DEV_MEM_EVENT_OPER(id)
name TEXT, -- Variable name, if available.
correlationId INTEGER, -- REFERENCES CUPTI_ACTIVITY_KIND_RUNTIME(correlationId)
localMemoryPoolAddress INTEGER, -- Base address of the local memory pool used
localMemoryPoolReleaseThreshold INTEGER, -- Release threshold of the local memory pool used
localMemoryPoolSize INTEGER, -- Size of the local memory pool used
localMemoryPoolUtilizedSize INTEGER, -- Utilized size of the local memory pool used
importedMemoryPoolAddress INTEGER, -- Base address of the imported memory pool used
importedMemoryPoolProcessId INTEGER -- Process ID of the imported memory pool used
);
CREATE TABLE CUDA_GPU_MEMORY_POOL_EVENTS (
start INTEGER NOT NULL, -- Event start timestamp (ns).
globalPid INTEGER NOT NULL, -- Serialized GlobalId.
deviceId INTEGER NOT NULL, -- Device ID.
address INTEGER NOT NULL, -- The base virtual address of the memory pool.
operationType INTEGER NOT NULL, -- REFERENCES ENUM_CUDA_MEMPOOL_OPER(id)
poolType INTEGER NOT NULL, -- REFERENCES ENUM_CUDA_MEMPOOL_TYPE(id)
correlationId INTEGER, -- REFERENCES CUPTI_ACTIVITY_KIND_RUNTIME(correlationId)
minBytesToKeep INTEGER, -- Minimum number of bytes to keep of the memory pool.
localMemoryPoolReleaseThreshold INTEGER, -- Release threshold of the local memory pool used
localMemoryPoolSize INTEGER, -- Size of the local memory pool used
localMemoryPoolUtilizedSize INTEGER -- Utilized size of the local memory pool used
);
CREATE TABLE CUDA_CALLCHAINS (
id INTEGER NOT NULL, -- Part of PRIMARY KEY (id, stackDepth).
symbol INTEGER NOT NULL, -- REFERENCES StringIds(id) -- Function name
module INTEGER NOT NULL, -- REFERENCES StringIds(id) -- Module name
unresolved INTEGER, -- True if the symbol was not resolved.
originalIP INTEGER, -- Instruction pointer value.
stackDepth INTEGER NOT NULL, -- Zero-base index of the given function in call stack.
PRIMARY KEY (id, stackDepth)
);
CREATE TABLE MPI_RANKS (
-- Mapping of global thread IDs (gtid) to MPI ranks
globalTid INTEGER NOT NULL, -- Serialized GlobalId.
rank INTEGER NOT NULL -- MPI rank
);
CREATE TABLE MPI_P2P_EVENTS (
start INTEGER NOT NULL, -- Event start timestamp (ns).
end INTEGER, -- Event end timestamp (ns).
globalTid INTEGER, -- Serialized GlobalId.
textId INTEGER, -- REFERENCES StringIds(id) -- Registered NVTX domain
commHandle INTEGER, -- MPI communicator handle
tag INTEGER, -- MPI message tag
remoteRank INTEGER, -- MPI remote rank (destination or source)
size INTEGER, -- MPI message size in bytes
requestHandle INTEGER -- MPI request handle
);
CREATE TABLE MPI_COLLECTIVES_EVENTS (
start INTEGER NOT NULL, -- Event start timestamp (ns).
end INTEGER, -- Event end timestamp (ns).
globalTid INTEGER, -- Serialized GlobalId.
textId INTEGER, -- REFERENCES StringIds(id) -- Registered NVTX domain
commHandle INTEGER, -- MPI communicator handle
rootRank INTEGER, -- root rank in the collective
size INTEGER, -- MPI message size in bytes (send size for bidirectional ops)
recvSize INTEGER, -- MPI receive size in bytes
requestHandle INTEGER -- MPI request handle
);
CREATE TABLE MPI_START_WAIT_EVENTS (
-- MPI_Wait* and MPI_Start*
start INTEGER NOT NULL, -- Event start timestamp (ns).
end INTEGER, -- Event end timestamp (ns).
globalTid INTEGER, -- Serialized GlobalId.
textId INTEGER, -- REFERENCES StringIds(id) -- Registered NVTX domain
requestHandle INTEGER -- MPI request handle
);
CREATE TABLE MPI_OTHER_EVENTS (
-- MPI events without additional parameters
start INTEGER NOT NULL, -- Event start timestamp (ns).
end INTEGER, -- Event end timestamp (ns).
globalTid INTEGER, -- Serialized GlobalId.
textId INTEGER -- REFERENCES StringIds(id) -- Registered NVTX domain
);
CREATE TABLE NVTX_EVENTS (
start INTEGER NOT NULL, -- Event start timestamp (ns).
end INTEGER, -- Event end timestamp (ns).
eventType INTEGER NOT NULL, -- REFERENCES ENUM_NSYS_EVENT_TYPE(id)
rangeId INTEGER, -- Correlation ID returned from a nvtxRangeStart call.
category INTEGER, -- User-controlled ID that can be used to group events.
color INTEGER, -- Encoded ARGB color value.
text TEXT, -- Optional text message for non registered strings.
globalTid INTEGER, -- Serialized GlobalId.
endGlobalTid INTEGER, -- Serialized GlobalId.
textId INTEGER, -- REFERENCES StringIds(id) -- Registered NVTX domain
domainId INTEGER, -- User-controlled ID that can be used to group events.
uint64Value INTEGER, -- One of possible payload value union members.
int64Value INTEGER, -- One of possible payload value union members.
doubleValue REAL, -- One of possible payload value union members.
uint32Value INTEGER, -- One of possible payload value union members.
int32Value INTEGER, -- One of possible payload value union members.
floatValue REAL, -- One of possible payload value union members.
jsonTextId INTEGER, -- One of possible payload value union members.
jsonText TEXT -- One of possible payload value union members.
);
CREATE TABLE OPENGL_API (
start INTEGER NOT NULL, -- Event start timestamp (ns).
end INTEGER NOT NULL, -- Event end timestamp (ns).
eventClass INTEGER NOT NULL, -- REFERENCES ENUM_NSYS_EVENT_TYPE(id)
globalTid INTEGER, -- Serialized GlobalId.
endGlobalTid INTEGER, -- Serialized GlobalId.
correlationId INTEGER, -- First ID matching an API call to GPU workloads.
endCorrelationId INTEGER, -- Last ID matching an API call to GPU workloads.
nameId INTEGER NOT NULL, -- REFERENCES StringIds(id) -- First function name
endNameId INTEGER, -- REFERENCES StringIds(id) -- Last function name
returnValue INTEGER NOT NULL, -- Return value of the function call.
frameId INTEGER, -- Index of the graphics frame starting from 1.
contextId INTEGER, -- Context ID.
gpu INTEGER, -- GPU index.
display INTEGER -- Display ID.
);
CREATE TABLE OPENGL_WORKLOAD (
start INTEGER NOT NULL, -- Event start timestamp (ns).
end INTEGER NOT NULL, -- Event end timestamp (ns).
eventClass INTEGER NOT NULL, -- REFERENCES ENUM_NSYS_EVENT_TYPE(id)
globalTid INTEGER, -- Serialized GlobalId.
endGlobalTid INTEGER, -- Serialized GlobalId.
correlationId INTEGER, -- First ID matching an API call to GPU workloads.
endCorrelationId INTEGER, -- Last ID matching an API call to GPU workloads.
nameId INTEGER NOT NULL, -- REFERENCES StringIds(id) -- First function name
endNameId INTEGER, -- REFERENCES StringIds(id) -- Last function name
returnValue INTEGER NOT NULL, -- Return value of the function call.
frameId INTEGER, -- Index of the graphics frame starting from 1.
contextId INTEGER, -- Context ID.
gpu INTEGER, -- GPU index.
display INTEGER -- Display ID.
);
CREATE TABLE KHR_DEBUG_EVENTS (
eventClass INTEGER NOT NULL, -- REFERENCES ENUM_NSYS_EVENT_TYPE(id)
start INTEGER NOT NULL, -- Event start timestamp (ns).
end INTEGER, -- Event end timestamp (ns).
textId INTEGER, -- REFERENCES StringIds(id) -- Debug marker/group text
globalTid INTEGER, -- Serialized GlobalId.
source INTEGER, -- REFERENCES ENUM_OPENGL_DEBUG_SOURCE(id)
khrdType INTEGER, -- REFERENCES ENUM_OPENGL_DEBUG_TYPE(id)
id INTEGER, -- KHR event ID.
severity INTEGER, -- REFERENCES ENUM_OPENGL_DEBUG_SEVERITY(id)
correlationId INTEGER, -- ID used to correlate KHR CPU trace to GPU trace.
context INTEGER -- Context ID.
);
CREATE TABLE OSRT_API (
-- OS runtime libraries traced to gather information about low-level userspace APIs.
start INTEGER NOT NULL, -- Event start timestamp (ns).
end INTEGER NOT NULL, -- Event end timestamp (ns).
eventClass INTEGER NOT NULL, -- REFERENCES ENUM_NSYS_EVENT_CLASS(id)
globalTid INTEGER, -- Serialized GlobalId.
nameId INTEGER NOT NULL, -- REFERENCES StringIds(id) -- Function name
returnValue INTEGER NOT NULL, -- Return value of the function call.
nestingLevel INTEGER, -- Zero-base index of the nesting level.
callchainId INTEGER NOT NULL -- REFERENCES OSRT_CALLCHAINS(id)
);
CREATE TABLE OSRT_CALLCHAINS (
-- Callchains attached to OSRT events, depending on selected profiling settings.
id INTEGER NOT NULL, -- Part of PRIMARY KEY (id, stackDepth).
symbol INTEGER NOT NULL, -- REFERENCES StringIds(id) -- Function name
module INTEGER NOT NULL, -- REFERENCES StringIds(id) -- Module name
kernelMode INTEGER, -- True if kernel mode.
thumbCode INTEGER, -- True if thumb code.
unresolved INTEGER, -- True if the symbol was not resolved.
specialEntry INTEGER, -- True if artifical entry added during processing callchain.
originalIP INTEGER, -- Instruction pointer value.
unwindMethod INTEGER, -- REFERENCES ENUM_STACK_UNWIND_METHOD(id)
stackDepth INTEGER NOT NULL, -- Zero-base index of the given function in call stack.
PRIMARY KEY (id, stackDepth)
);
CREATE TABLE UnwindMethodType (
number INTEGER PRIMARY KEY,
name TEXT NOT NULL
);
CREATE TABLE PROFILER_OVERHEAD (
start INTEGER NOT NULL, -- Event start timestamp (ns).
end INTEGER NOT NULL, -- Event end timestamp (ns).
globalTid INTEGER, -- Serialized GlobalId.
nameId INTEGER NOT NULL, -- REFERENCES StringIds(id) -- Function name
returnValue INTEGER NOT NULL -- Return value of the function call.
);
CREATE TABLE SCHED_EVENTS (
-- Thread scheduling events.
start INTEGER NOT NULL, -- Event start timestamp (ns).
cpu INTEGER NOT NULL, -- ID of CPU this thread was scheduled in or out.
isSchedIn INTEGER NOT NULL, -- 0 if thread was scheduled out, non-zero otherwise.
globalTid INTEGER -- Serialized GlobalId.
);
CREATE TABLE COMPOSITE_EVENTS (
-- Thread sampling events.
id INTEGER NOT NULL PRIMARY KEY, -- ID of the composite event.
start INTEGER NOT NULL, -- Event start timestamp (ns).
cpu INTEGER, -- ID of CPU this thread was running on.
threadState INTEGER, -- REFERENCES ENUM_SAMPLING_THREAD_STATE(id)
globalTid INTEGER, -- Serialized GlobalId.
cpuCycles INTEGER NOT NULL -- Value of Performance Monitoring Unit (PMU) counter.
);
CREATE TABLE SAMPLING_CALLCHAINS (
-- Callchain entries obtained from composite events, used to construct function table views.
id INTEGER NOT NULL, -- REFERENCES COMPOSITE_EVENTS(id)
symbol INTEGER NOT NULL, -- REFERENCES StringIds(id) -- Function name
module INTEGER NOT NULL, -- REFERENCES StringIds(id) -- Module name
kernelMode INTEGER, -- True if kernel mode.
thumbCode INTEGER, -- True if thumb code.
unresolved INTEGER, -- True if the symbol was not resolved.
specialEntry INTEGER, -- True if artifical entry added during processing callchain.
originalIP INTEGER, -- Instruction pointer value.
unwindMethod INTEGER, -- REFERENCES ENUM_STACK_UNWIND_METHOD(id)
stackDepth INTEGER NOT NULL, -- Zero-base index of the given function in call stack.
PRIMARY KEY (id, stackDepth)
);
CREATE TABLE PERF_EVENT_CPU_COUNTER (
-- Sampled CPU Performance Counters.
start INTEGER NOT NULL, -- Event start timestamp (ns).
end INTEGER NOT NULL, -- Event end timestamp (ns).
vmId INTEGER, -- VM ID.
componentId INTEGER, -- Perf Event Component ID (usually CPU Core ID)
counterId INTEGER, -- REFERENCES TARGET_INFO_PERF_COUNTER(counterId)
value INTEGER -- Counter data value
);
CREATE TABLE SLI_QUERIES (
start INTEGER NOT NULL, -- Event start timestamp (ns).
end INTEGER NOT NULL, -- Event end timestamp (ns).
eventClass INTEGER NOT NULL, -- REFERENCES ENUM_NSYS_EVENT_CLASS(id)
globalTid INTEGER, -- Serialized GlobalId.
gpu INTEGER NOT NULL, -- GPU index.
frameId INTEGER NOT NULL, -- Index of the graphics frame starting from 1.
occQueryIssued INTEGER NOT NULL, -- Occlusion query issued.
occQueryAsked INTEGER NOT NULL, -- Occlusion query asked.
eventQueryIssued INTEGER NOT NULL, -- Event query issued.
eventQueryAsked INTEGER NOT NULL, -- Event query asked.
numberOfTransferEvents INTEGER NOT NULL, -- Number of transfer events.
amountOfTransferredData INTEGER NOT NULL -- Cumulative size of resource data that was transferred.
);
CREATE TABLE SLI_P2P (
start INTEGER NOT NULL, -- Event start timestamp (ns).
end INTEGER NOT NULL, -- Event end timestamp (ns).
eventClass INTEGER NOT NULL, -- REFERENCES ENUM_NSYS_EVENT_CLASS(id)
globalTid INTEGER, -- Serialized GlobalId.
gpu INTEGER NOT NULL, -- GPU index.
frameId INTEGER NOT NULL, -- Index of the graphics frame starting from 1.
transferSkipped INTEGER NOT NULL, -- Number of transfers that were skipped.
srcGpu INTEGER NOT NULL, -- Source GPU ID.
dstGpu INTEGER NOT NULL, -- Destination GPU ID.
numSubResources INTEGER NOT NULL, -- Number of sub-resources to transfer.
resourceSize INTEGER NOT NULL, -- Size of resource.
subResourceIdx INTEGER NOT NULL, -- Sub-resource index.
smplWidth INTEGER, -- Sub-resource surface width in samples.
smplHeight INTEGER, -- Sub-resource surface height in samples.
smplDepth INTEGER, -- Sub-resource surface depth in samples.
bytesPerElement INTEGER, -- Number of bytes per element.
dxgiFormat INTEGER, -- REFERENCES ENUM_DXGI_FORMAT(id)
logSurfaceNames TEXT, -- Surface name.
transferInfo INTEGER, -- REFERENCES ENUM_SLI_TRANSER(id)
isEarlyPushManagedByNvApi INTEGER, -- True if early push managed by NVAPI. False otherwise.
useAsyncP2pForResolve INTEGER, -- True if async Peer-to-Peer used for resolve. False otherwise.
transferFuncName TEXT, -- "A - BE" for asynchronous transfer, "S - BE" for synchronous transfer.
regimeName TEXT, -- Name of the regime scope that includes the resource.
debugName TEXT, -- Debug name assigned to the resource by the application code.
bindType TEXT -- Bind type.
);
CREATE TABLE SLI_STATS (
start INTEGER NOT NULL, -- Event start timestamp (ns).
end INTEGER NOT NULL, -- Event end timestamp (ns).
eventClass INTEGER NOT NULL, -- REFERENCES ENUM_NSYS_EVENT_CLASS(id)
globalTid INTEGER, -- Serialized GlobalId.
gpu INTEGER NOT NULL, -- GPU index.
countComplexFrames INTEGER NOT NULL, -- Complex frames count.
countStats INTEGER NOT NULL, -- Number of frame statistics collected for the inactive-time histogram.
totalInactiveTime INTEGER NOT NULL, -- Total inactive time (µs).
minPbSize INTEGER NOT NULL, -- Min push buffer size.
maxPbSize INTEGER NOT NULL, -- Max push buffer size.
totalPbSize INTEGER NOT NULL -- Total push buffer size.
);
CREATE TABLE DX12_API (
id INTEGER NOT NULL PRIMARY KEY,
start INTEGER NOT NULL, -- Event start timestamp (ns).
end INTEGER NOT NULL, -- Event end timestamp (ns).
eventClass INTEGER NOT NULL, -- REFERENCES ENUM_NSYS_EVENT_CLASS(id)
globalTid INTEGER, -- Serialized GlobalId.
correlationId INTEGER, -- First ID matching an API call to GPU workloads.
endCorrelationId INTEGER, -- Last ID matching an API call to GPU workloads.
nameId INTEGER NOT NULL, -- REFERENCES StringIds(id) -- Function name
shortContextId INTEGER, -- Short form of the COM interface object address.
frameId INTEGER, -- Index of the graphics frame starting from 1.
color INTEGER, -- Encoded ARGB color value.
textId INTEGER, -- REFERENCES StringIds(id) -- PIX marker text
commandListType INTEGER, -- REFERENCES ENUM_D3D12_CMD_LIST_TYPE(id)
objectNameId INTEGER, -- REFERENCES StringIds(id) -- D3D12 object name
longContextId INTEGER -- Long form of the COM interface object address.
);
CREATE TABLE DX12_WORKLOAD (
start INTEGER NOT NULL, -- Event start timestamp (ns).
end INTEGER NOT NULL, -- Event end timestamp (ns).
eventClass INTEGER NOT NULL, -- REFERENCES ENUM_NSYS_EVENT_CLASS(id)
globalTid INTEGER, -- Serialized GlobalId.
correlationId INTEGER, -- First ID matching an API call to GPU workloads.
endCorrelationId INTEGER, -- Last ID matching an API call to GPU workloads.
nameId INTEGER NOT NULL, -- REFERENCES StringIds(id) -- Function name
shortContextId INTEGER, -- Short form of the COM interface object address.
frameId INTEGER, -- Index of the graphics frame starting from 1.
gpu INTEGER, -- GPU index.
color INTEGER, -- Encoded ARGB color value.
textId INTEGER, -- REFERENCES StringIds(id) -- PIX marker text
commandListType INTEGER, -- REFERENCES ENUM_D3D12_CMD_LIST_TYPE(id)
objectNameId INTEGER, -- REFERENCES StringIds(id) -- D3D12 object name
longContextId INTEGER -- Long form of the COM interface object address.
);
CREATE TABLE DX12_MEMORY_OPERATION (
gpu INTEGER, -- GPU index.
rangeStart INTEGER, -- Offset denoting the beginning of a memory range (B).
rangeEnd INTEGER, -- Offset denoting the end of a memory range (B).
subresourceId INTEGER, -- Subresource index.
heapType INTEGER, -- REFERENCES ENUM_D3D12_HEAP_TYPE(id)
heapFlags INTEGER, -- REFERENCES ENUM_D3D12_HEAP_FLAGS(id)
cpuPageProperty INTEGER, -- REFERENCES ENUM_D3D12_PAGE_PROPERTY(id)
nvApiFlags INTEGER, -- NV specific flags. See docs for specifics.
traceEventId INTEGER NOT NULL -- REFERENCES DX12_API(id)
);
CREATE TABLE VULKAN_API (
id INTEGER NOT NULL PRIMARY KEY,
start INTEGER NOT NULL, -- Event start timestamp (ns).
end INTEGER NOT NULL, -- Event end timestamp (ns).
eventClass INTEGER NOT NULL, -- REFERENCES ENUM_NSYS_EVENT_CLASS(id)
globalTid INTEGER, -- Serialized GlobalId.
correlationId INTEGER, -- First ID matching an API call to GPU workloads.
endCorrelationId INTEGER, -- Last ID matching an API call to GPU workloads.
nameId INTEGER NOT NULL, -- REFERENCES StringIds(id) -- Function name
contextId INTEGER -- Short form of the interface object address.
);
CREATE TABLE VULKAN_WORKLOAD (
start INTEGER NOT NULL, -- Event start timestamp (ns).
end INTEGER NOT NULL, -- Event end timestamp (ns).
eventClass INTEGER NOT NULL, -- REFERENCES ENUM_NSYS_EVENT_CLASS(id)
globalTid INTEGER, -- Serialized GlobalId.
correlationId INTEGER, -- First ID matching an API call to GPU workloads.
endCorrelationId INTEGER, -- Last ID matching an API call to GPU workloads.
nameId INTEGER NOT NULL, -- REFERENCES StringIds(id) -- Function name
gpu INTEGER, -- GPU index.
contextId INTEGER, -- Short form of the interface object address.
color INTEGER, -- Encoded ARGB color value.
textId INTEGER -- REFERENCES StringIds(id) -- Vulkan CPU debug marker string
);
CREATE TABLE VULKAN_DEBUG_API (
start INTEGER NOT NULL, -- Event start timestamp (ns).
end INTEGER NOT NULL, -- Event end timestamp (ns).
eventClass INTEGER NOT NULL, -- REFERENCES ENUM_NSYS_EVENT_CLASS(id)
globalTid INTEGER, -- Serialized GlobalId.
correlationId INTEGER, -- First ID matching an API call to GPU workloads.
endCorrelationId INTEGER, -- Last ID matching an API call to GPU workloads.
nameId INTEGER NOT NULL, -- REFERENCES StringIds(id) -- Function name
contextId INTEGER, -- Short form of the interface object address.
color INTEGER, -- Encoded ARGB color value.
textId INTEGER -- REFERENCES StringIds(id) -- Vulkan CPU debug marker string
);
CREATE TABLE VULKAN_PIPELINE_CREATION_EVENTS (
id INTEGER NOT NULL PRIMARY KEY, -- ID of the pipeline creation event.
duration INTEGER, -- Event duration (ns).
flags INTEGER, -- REFERENCES ENUM_VULKAN_PIPELINE_CREATION_FLAGS(id)
traceEventId INTEGER NOT NULL -- REFERENCES VULKAN_API(id) -- ID of the attached vulkan API.
);
CREATE TABLE VULKAN_PIPELINE_STAGE_EVENTS (
id INTEGER NOT NULL PRIMARY KEY, -- ID of the pipeline stage event.
duration INTEGER, -- Event duration (ns).
flags INTEGER, -- REFERENCES ENUM_VULKAN_PIPELINE_CREATION_FLAGS(id)
creationEventId INTEGER NOT NULL -- REFERENCES VULKAN_PIPELINE_CREATION_EVENTS(id) -- ID of the attached pipeline creation event.
);
CREATE TABLE GPU_CONTEXT_SWITCH_EVENTS (
tag INTEGER NOT NULL, -- REFERENCES ENUM_GPU_CTX_SWITCH(id)
vmId INTEGER NOT NULL, -- VM ID.
seqNo INTEGER NOT NULL, -- Sequential event number.
contextId INTEGER NOT NULL, -- Context ID.
timestamp INTEGER NOT NULL, -- Event start timestamp (ns).
globalPid INTEGER, -- Serialized GlobalId.
gpuId INTEGER -- GPU index.
);
CREATE TABLE ETW_EVENTS_DEPRECATED_TABLE (
start INTEGER NOT NULL, -- Event start timestamp (ns).
end INTEGER NOT NULL, -- Event end timestamp (ns).
globalTid INTEGER, -- Serialized GlobalId.
providerName INTEGER, -- REFERENCES StringIds(id) -- Tracing events provider name
taskName INTEGER, -- REFERENCES StringIds(id) -- Event task name
description INTEGER -- REFERENCES StringIds(id) -- Decoded event value
);
CREATE TABLE OPENMP_EVENT_KIND_THREAD (
start INTEGER NOT NULL, -- Event start timestamp (ns).
end INTEGER NOT NULL, -- Event end timestamp (ns).
eventClass INTEGER NOT NULL, -- REFERENCES ENUM_NSYS_EVENT_CLASS(id)
globalTid INTEGER, -- Serialized GlobalId.
correlationId INTEGER, -- Currently unused.
nameId INTEGER NOT NULL, -- REFERENCES StringIds(id) -- Event name
eventKind INTEGER, -- REFERENCES ENUM_OPENMP_EVENT_KIND(id)
threadId INTEGER, -- Internal thread sequence starting from 1.
threadType INTEGER -- REFERENCES ENUM_OPENMP_THREAD(id)
);
CREATE TABLE OPENMP_EVENT_KIND_PARALLEL (
start INTEGER NOT NULL, -- Event start timestamp (ns).
end INTEGER NOT NULL, -- Event end timestamp (ns).
eventClass INTEGER NOT NULL, -- REFERENCES ENUM_NSYS_EVENT_CLASS(id)
globalTid INTEGER, -- Serialized GlobalId.
correlationId INTEGER, -- Currently unused.
nameId INTEGER NOT NULL, -- REFERENCES StringIds(id) -- Event name
eventKind INTEGER, -- REFERENCES ENUM_OPENMP_EVENT_KIND(id)
parallelId INTEGER, -- Internal parallel region sequence starting from 1.
parentTaskId INTEGER -- ID for task that creates this parallel region.
);
CREATE TABLE OPENMP_EVENT_KIND_SYNC_REGION_WAIT (
start INTEGER NOT NULL, -- Event start timestamp (ns).
end INTEGER NOT NULL, -- Event end timestamp (ns).
eventClass INTEGER NOT NULL, -- REFERENCES ENUM_NSYS_EVENT_CLASS(id)
globalTid INTEGER, -- Serialized GlobalId.
correlationId INTEGER, -- Currently unused.
nameId INTEGER NOT NULL, -- REFERENCES StringIds(id) -- Event name
eventKind INTEGER, -- REFERENCES ENUM_OPENMP_EVENT_KIND(id)
parallelId INTEGER, -- ID of the parallel region that this event belongs to.
taskId INTEGER, -- ID of the task that this event belongs to.
kind INTEGER -- REFERENCES ENUM_OPENMP_SYNC_REGION(id)
);
CREATE TABLE OPENMP_EVENT_KIND_SYNC_REGION (
start INTEGER NOT NULL, -- Event start timestamp (ns).
end INTEGER NOT NULL, -- Event end timestamp (ns).
eventClass INTEGER NOT NULL, -- REFERENCES ENUM_NSYS_EVENT_CLASS(id)
globalTid INTEGER, -- Serialized GlobalId.
correlationId INTEGER, -- Currently unused.
nameId INTEGER NOT NULL, -- REFERENCES StringIds(id) -- Event name
eventKind INTEGER, -- REFERENCES ENUM_OPENMP_EVENT_KIND(id)
parallelId INTEGER, -- ID of the parallel region that this event belongs to.
taskId INTEGER, -- ID of the task that this event belongs to.
kind INTEGER -- REFERENCES ENUM_OPENMP_SYNC_REGION(id)
);
CREATE TABLE OPENMP_EVENT_KIND_TASK (
start INTEGER NOT NULL, -- Event start timestamp (ns).
end INTEGER NOT NULL, -- Event end timestamp (ns).
eventClass INTEGER NOT NULL, -- REFERENCES ENUM_NSYS_EVENT_CLASS(id)
globalTid INTEGER, -- Serialized GlobalId.
correlationId INTEGER, -- Currently unused.
nameId INTEGER NOT NULL, -- REFERENCES StringIds(id) -- Event name
eventKind INTEGER, -- REFERENCES ENUM_OPENMP_EVENT_KIND(id)
parallelId INTEGER, -- ID of the parallel region that this event belongs to.
taskId INTEGER, -- ID of the task that this event belongs to.
kind INTEGER -- REFERENCES ENUM_OPENMP_TASK_FLAG(id)
);
CREATE TABLE OPENMP_EVENT_KIND_MASTER (
start INTEGER NOT NULL, -- Event start timestamp (ns).
end INTEGER NOT NULL, -- Event end timestamp (ns).
eventClass INTEGER NOT NULL, -- REFERENCES ENUM_NSYS_EVENT_CLASS(id)
globalTid INTEGER, -- Serialized GlobalId.
correlationId INTEGER, -- Currently unused.
nameId INTEGER NOT NULL, -- REFERENCES StringIds(id) -- Event name
eventKind INTEGER, -- REFERENCES ENUM_OPENMP_EVENT_KIND(id)
parallelId INTEGER, -- ID of the parallel region that this event belongs to.
taskId INTEGER -- ID of the task that this event belongs to.
);
CREATE TABLE OPENMP_EVENT_KIND_REDUCTION (
start INTEGER NOT NULL, -- Event start timestamp (ns).
end INTEGER NOT NULL, -- Event end timestamp (ns).
eventClass INTEGER NOT NULL, -- REFERENCES ENUM_NSYS_EVENT_CLASS(id)
globalTid INTEGER, -- Serialized GlobalId.
correlationId INTEGER, -- Currently unused.
nameId INTEGER NOT NULL, -- REFERENCES StringIds(id) -- Event name
eventKind INTEGER, -- REFERENCES ENUM_OPENMP_EVENT_KIND(id)
parallelId INTEGER, -- ID of the parallel region that this event belongs to.
taskId INTEGER -- ID of the task that this event belongs to.
);
CREATE TABLE OPENMP_EVENT_KIND_TASK_CREATE (
start INTEGER NOT NULL, -- Event start timestamp (ns).
end INTEGER NOT NULL, -- Event end timestamp (ns).
eventClass INTEGER NOT NULL, -- REFERENCES ENUM_NSYS_EVENT_CLASS(id)
globalTid INTEGER, -- Serialized GlobalId.
correlationId INTEGER, -- Currently unused.
nameId INTEGER NOT NULL, -- REFERENCES StringIds(id) -- Event name
eventKind INTEGER, -- REFERENCES ENUM_OPENMP_EVENT_KIND(id)
parentTaskId INTEGER, -- ID of the parent task that is creating a new task.
newTaskId INTEGER -- ID of the new task that is being created.
);
CREATE TABLE OPENMP_EVENT_KIND_TASK_SCHEDULE (
start INTEGER NOT NULL, -- Event start timestamp (ns).
end INTEGER NOT NULL, -- Event end timestamp (ns).
eventClass INTEGER NOT NULL, -- REFERENCES ENUM_NSYS_EVENT_CLASS(id)
globalTid INTEGER, -- Serialized GlobalId.
correlationId INTEGER, -- Currently unused.
nameId INTEGER NOT NULL, -- REFERENCES StringIds(id) -- Event name
eventKind INTEGER, -- REFERENCES ENUM_OPENMP_EVENT_KIND(id)
parallelId INTEGER, -- ID of the parallel region that this event belongs to.
priorTaskId INTEGER, -- ID of the task that is being switched out.
priorTaskStatus INTEGER, -- REFERENCES ENUM_OPENMP_TASK_STATUS(id)
nextTaskId INTEGER -- ID of the task that is being switched in.
);
CREATE TABLE OPENMP_EVENT_KIND_CANCEL (
start INTEGER NOT NULL, -- Event start timestamp (ns).
end INTEGER NOT NULL, -- Event end timestamp (ns).
eventClass INTEGER NOT NULL, -- REFERENCES ENUM_NSYS_EVENT_CLASS(id)
globalTid INTEGER, -- Serialized GlobalId.
correlationId INTEGER, -- Currently unused.
nameId INTEGER NOT NULL, -- REFERENCES StringIds(id) -- Event name
eventKind INTEGER, -- REFERENCES ENUM_OPENMP_EVENT_KIND(id)
taskId INTEGER -- ID of the task that is being cancelled.
);
CREATE TABLE OPENMP_EVENT_KIND_MUTEX_WAIT (
start INTEGER NOT NULL, -- Event start timestamp (ns).
end INTEGER NOT NULL, -- Event end timestamp (ns).
eventClass INTEGER NOT NULL, -- REFERENCES ENUM_NSYS_EVENT_CLASS(id)
globalTid INTEGER, -- Serialized GlobalId.
correlationId INTEGER, -- Currently unused.
nameId INTEGER NOT NULL, -- REFERENCES StringIds(id) -- Event name
eventKind INTEGER, -- REFERENCES ENUM_OPENMP_EVENT_KIND(id)
kind INTEGER, -- REFERENCES ENUM_OPENMP_MUTEX(id)
waitId INTEGER, -- ID indicating the object being waited.
taskId INTEGER -- ID of the task that this event belongs to.
);
CREATE TABLE OPENMP_EVENT_KIND_CRITICAL_SECTION (
start INTEGER NOT NULL, -- Event start timestamp (ns).
end INTEGER NOT NULL, -- Event end timestamp (ns).
eventClass INTEGER NOT NULL, -- REFERENCES ENUM_NSYS_EVENT_CLASS(id)
globalTid INTEGER, -- Serialized GlobalId.
correlationId INTEGER, -- Currently unused.
nameId INTEGER NOT NULL, -- REFERENCES StringIds(id) -- Event name
eventKind INTEGER, -- REFERENCES ENUM_OPENMP_EVENT_KIND(id)
kind INTEGER, -- REFERENCES ENUM_OPENMP_MUTEX(id)
waitId INTEGER -- ID indicating the object being held.
);
CREATE TABLE OPENMP_EVENT_KIND_MUTEX_RELEASED (
start INTEGER NOT NULL, -- Event start timestamp (ns).
end INTEGER NOT NULL, -- Event end timestamp (ns).
eventClass INTEGER NOT NULL, -- REFERENCES ENUM_NSYS_EVENT_CLASS(id)
globalTid INTEGER, -- Serialized GlobalId.
correlationId INTEGER, -- Currently unused.
nameId INTEGER NOT NULL, -- REFERENCES StringIds(id) -- Event name
eventKind INTEGER, -- REFERENCES ENUM_OPENMP_EVENT_KIND(id)
kind INTEGER, -- REFERENCES ENUM_OPENMP_MUTEX(id)
waitId INTEGER, -- ID indicating the object being released.
taskId INTEGER -- ID of the task that this event belongs to.
);
CREATE TABLE OPENMP_EVENT_KIND_LOCK_INIT (
start INTEGER NOT NULL, -- Event start timestamp (ns).
end INTEGER NOT NULL, -- Event end timestamp (ns).
eventClass INTEGER NOT NULL, -- REFERENCES ENUM_NSYS_EVENT_CLASS(id)
globalTid INTEGER, -- Serialized GlobalId.
correlationId INTEGER, -- Currently unused.
nameId INTEGER NOT NULL, -- REFERENCES StringIds(id) -- Event name
eventKind INTEGER, -- REFERENCES ENUM_OPENMP_EVENT_KIND(id)
kind INTEGER, -- REFERENCES ENUM_OPENMP_MUTEX(id)
waitId INTEGER -- ID indicating object being created/destroyed.
);
CREATE TABLE OPENMP_EVENT_KIND_LOCK_DESTROY (
start INTEGER NOT NULL, -- Event start timestamp (ns).
end INTEGER NOT NULL, -- Event end timestamp (ns).
eventClass INTEGER NOT NULL, -- REFERENCES ENUM_NSYS_EVENT_CLASS(id)
globalTid INTEGER, -- Serialized GlobalId.
correlationId INTEGER, -- Currently unused.
nameId INTEGER NOT NULL, -- REFERENCES StringIds(id) -- Event name
eventKind INTEGER, -- REFERENCES ENUM_OPENMP_EVENT_KIND(id)
kind INTEGER, -- REFERENCES ENUM_OPENMP_MUTEX(id)
waitId INTEGER -- ID indicating object being created/destroyed.
);
CREATE TABLE OPENMP_EVENT_KIND_WORKSHARE (
start INTEGER NOT NULL, -- Event start timestamp (ns).
end INTEGER NOT NULL, -- Event end timestamp (ns).
eventClass INTEGER NOT NULL, -- REFERENCES ENUM_NSYS_EVENT_CLASS(id)
globalTid INTEGER, -- Serialized GlobalId.
correlationId INTEGER, -- Currently unused.
nameId INTEGER NOT NULL, -- REFERENCES StringIds(id) -- Event name
eventKind INTEGER, -- REFERENCES ENUM_OPENMP_EVENT_KIND(id)
kind INTEGER, -- REFERENCES ENUM_OPENMP_WORK(id)
parallelId INTEGER, -- ID of the parallel region that this event belongs to.
taskId INTEGER, -- ID of the task that this event belongs to.
count INTEGER -- Measure of the quantity of work involved in the region.
);
CREATE TABLE OPENMP_EVENT_KIND_DISPATCH (
start INTEGER NOT NULL, -- Event start timestamp (ns).
end INTEGER NOT NULL, -- Event end timestamp (ns).
eventClass INTEGER NOT NULL, -- REFERENCES ENUM_NSYS_EVENT_CLASS(id)
globalTid INTEGER, -- Serialized GlobalId.
correlationId INTEGER, -- Currently unused.
nameId INTEGER NOT NULL, -- REFERENCES StringIds(id) -- Event name
eventKind INTEGER, -- REFERENCES ENUM_OPENMP_EVENT_KIND(id)
kind INTEGER, -- REFERENCES ENUM_OPENMP_DISPATCH(id)
parallelId INTEGER, -- ID of the parallel region that this event belongs to.
taskId INTEGER -- ID of the task that this event belongs to.
);
CREATE TABLE OPENMP_EVENT_KIND_FLUSH (
start INTEGER NOT NULL, -- Event start timestamp (ns).
end INTEGER NOT NULL, -- Event end timestamp (ns).
eventClass INTEGER NOT NULL, -- REFERENCES ENUM_NSYS_EVENT_CLASS(id)
globalTid INTEGER, -- Serialized GlobalId.
correlationId INTEGER, -- Currently unused.
nameId INTEGER NOT NULL, -- REFERENCES StringIds(id) -- Event name
eventKind INTEGER, -- REFERENCES ENUM_OPENMP_EVENT_KIND(id)
threadId INTEGER -- ID of the thread that this event belongs to.
);
CREATE TABLE D3D11_PIX_DEBUG_API (
-- D3D11 debug marker events.
start INTEGER NOT NULL, -- Event start timestamp (ns).
end INTEGER NOT NULL, -- Event end timestamp (ns).
globalTid INTEGER, -- Serialized GlobalId.
correlationId INTEGER, -- First ID matching an API call to GPU workloads.
endCorrelationId INTEGER, -- Last ID matching an API call to GPU workloads.
nameId INTEGER NOT NULL, -- REFERENCES StringIds(id) -- Function name
shortContextId INTEGER, -- Short form of the COM interface object address.
frameId INTEGER, -- Index of the graphics frame starting from 1.
color INTEGER, -- Encoded ARGB color value.
textId INTEGER -- REFERENCES StringIds(id) -- PIX marker text
);
CREATE TABLE D3D12_PIX_DEBUG_API (
-- D3D12 debug marker events.
start INTEGER NOT NULL, -- Event start timestamp (ns).
end INTEGER NOT NULL, -- Event end timestamp (ns).
globalTid INTEGER, -- Serialized GlobalId.
correlationId INTEGER, -- First ID matching an API call to GPU workloads.
endCorrelationId INTEGER, -- Last ID matching an API call to GPU workloads.
nameId INTEGER NOT NULL, -- REFERENCES StringIds(id) -- Function name
shortContextId INTEGER, -- Short form of the COM interface object address.
frameId INTEGER, -- Index of the graphics frame starting from 1.
color INTEGER, -- Encoded ARGB color value.
textId INTEGER, -- REFERENCES StringIds(id) -- PIX marker text
commandListType INTEGER, -- REFERENCES ENUM_D3D12_CMD_LIST_TYPE(id)
objectNameId INTEGER, -- REFERENCES StringIds(id) -- D3D12 object name
longContextId INTEGER -- Long form of the COM interface object address.
);
CREATE TABLE WDDM_EVICT_ALLOCATION_EVENTS (
-- Raw ETW EvictAllocation events.
start INTEGER NOT NULL, -- Event start timestamp (ns).
end INTEGER NOT NULL, -- Event end timestamp (ns).
globalTid INTEGER, -- Serialized GlobalId.
gpu INTEGER NOT NULL, -- GPU index.
allocationHandle INTEGER NOT NULL -- Global allocation handle.
);
CREATE TABLE WDDM_PAGING_QUEUE_PACKET_START_EVENTS (
-- Raw ETW PagingQueuePacketStart events.
start INTEGER NOT NULL, -- Event start timestamp (ns).
end INTEGER NOT NULL, -- Event end timestamp (ns).
globalTid INTEGER, -- Serialized GlobalId.
gpu INTEGER NOT NULL, -- GPU index.
dxgDevice INTEGER, -- Address of an IDXGIDevice.
dxgAdapter INTEGER, -- Address of an IDXGIAdapter.
pagingQueue INTEGER NOT NULL, -- Address of the paging queue.
pagingQueuePacket INTEGER NOT NULL, -- Address of the paging queue packet.
sequenceId INTEGER NOT NULL, -- Internal sequence starting from 0.
alloc INTEGER, -- Allocation handle.
vidMmOpType INTEGER NOT NULL, -- REFERENCES ENUM_WDDM_VIDMM_OP_TYPE(id)
pagingQueueType INTEGER NOT NULL -- REFERENCES ENUM_WDDM_PAGING_QUEUE_TYPE(id)
);
CREATE TABLE WDDM_PAGING_QUEUE_PACKET_STOP_EVENTS (
-- Raw ETW PagingQueuePacketStop events.
start INTEGER NOT NULL, -- Event start timestamp (ns).
end INTEGER NOT NULL, -- Event end timestamp (ns).
globalTid INTEGER, -- Serialized GlobalId.
gpu INTEGER NOT NULL, -- GPU index.
pagingQueue INTEGER NOT NULL, -- Address of the paging queue.
pagingQueuePacket INTEGER NOT NULL, -- Address of the paging queue packet.
sequenceId INTEGER NOT NULL -- Internal sequence starting from 0.
);
CREATE TABLE WDDM_PAGING_QUEUE_PACKET_INFO_EVENTS (
-- Raw ETW PagingQueuePacketInfo events.
start INTEGER NOT NULL, -- Event start timestamp (ns).
end INTEGER NOT NULL, -- Event end timestamp (ns).
globalTid INTEGER, -- Serialized GlobalId.
gpu INTEGER NOT NULL, -- GPU index.
pagingQueue INTEGER NOT NULL, -- Address of the paging queue.
pagingQueuePacket INTEGER NOT NULL, -- Address of the paging queue packet.
sequenceId INTEGER NOT NULL -- Internal sequence starting from 0.
);
CREATE TABLE WDDM_QUEUE_PACKET_START_EVENTS (
-- Raw ETW QueuePacketStart events.
start INTEGER NOT NULL, -- Event start timestamp (ns).
end INTEGER NOT NULL, -- Event end timestamp (ns).
globalTid INTEGER, -- Serialized GlobalId.
gpu INTEGER NOT NULL, -- GPU index.
context INTEGER NOT NULL, -- The context ID of WDDM queue.
dmaBufferSize INTEGER NOT NULL, -- The dma buffer size.
dmaBuffer INTEGER NOT NULL, -- The reported address of dma buffer.
queuePacket INTEGER NOT NULL, -- The address of queue packet.
progressFenceValue INTEGER NOT NULL, -- The fence value.
packetType INTEGER NOT NULL, -- REFERENCES ENUM_WDDM_PACKET_TYPE(id)
submitSequence INTEGER NOT NULL, -- Internal sequence starting from 1.
allocationListSize INTEGER NOT NULL, -- The number of allocations referenced.
patchLocationListSize INTEGER NOT NULL, -- The number of patch locations.
present INTEGER NOT NULL, -- True or False if the packet is a present packet.
engineType INTEGER NOT NULL, -- REFERENCES ENUM_WDDM_ENGINE_TYPE(id)
syncObject INTEGER -- The address of fence object.
);
CREATE TABLE WDDM_QUEUE_PACKET_STOP_EVENTS (
-- Raw ETW QueuePacketStop events.
start INTEGER NOT NULL, -- Event start timestamp (ns).
end INTEGER NOT NULL, -- Event end timestamp (ns).
globalTid INTEGER, -- Serialized GlobalId.
gpu INTEGER NOT NULL, -- GPU index.
context INTEGER NOT NULL, -- The context ID of WDDM queue.
queuePacket INTEGER NOT NULL, -- The address of queue packet.
packetType INTEGER NOT NULL, -- REFERENCES ENUM_WDDM_PACKET_TYPE(id)
submitSequence INTEGER NOT NULL, -- Internal sequence starting from 1.
preempted INTEGER NOT NULL, -- True or False if the packet is preempted.
timeouted INTEGER NOT NULL, -- True or False if the packet is timeouted.
engineType INTEGER NOT NULL -- REFERENCES ENUM_WDDM_ENGINE_TYPE(id)
);
CREATE TABLE WDDM_QUEUE_PACKET_INFO_EVENTS (
-- Raw ETW QueuePacketInfo events.
start INTEGER NOT NULL, -- Event start timestamp (ns).
end INTEGER NOT NULL, -- Event end timestamp (ns).
globalTid INTEGER, -- Serialized GlobalId.
gpu INTEGER NOT NULL, -- GPU index.
context INTEGER NOT NULL, -- The context ID of WDDM queue.
packetType INTEGER NOT NULL, -- REFERENCES ENUM_WDDM_PACKET_TYPE(id)
submitSequence INTEGER NOT NULL, -- Internal sequence starting from 1.
engineType INTEGER NOT NULL -- REFERENCES ENUM_WDDM_ENGINE_TYPE(id)
);
CREATE TABLE WDDM_DMA_PACKET_START_EVENTS (
-- Raw ETW DmaPacketStart events.
start INTEGER NOT NULL, -- Event start timestamp (ns).
end INTEGER NOT NULL, -- Event end timestamp (ns).
globalTid INTEGER, -- Serialized GlobalId.
gpu INTEGER NOT NULL, -- GPU index.
context INTEGER NOT NULL, -- The context ID of WDDM queue.
queuePacketContext INTEGER NOT NULL, -- The queue packet context.
uliSubmissionId INTEGER NOT NULL, -- The queue packet submission ID.
dmaBuffer INTEGER NOT NULL, -- The reported address of dma buffer.
packetType INTEGER NOT NULL, -- REFERENCES ENUM_WDDM_PACKET_TYPE(id)
ulQueueSubmitSequence INTEGER NOT NULL, -- Internal sequence starting from 1.
quantumStatus INTEGER NOT NULL, -- The quantum Status.
engineType INTEGER NOT NULL -- REFERENCES ENUM_WDDM_ENGINE_TYPE(id)
);
CREATE TABLE WDDM_DMA_PACKET_STOP_EVENTS (
-- Raw ETW DmaPacketStop events.
start INTEGER NOT NULL, -- Event start timestamp (ns).
end INTEGER NOT NULL, -- Event end timestamp (ns).
globalTid INTEGER, -- Serialized GlobalId.
gpu INTEGER NOT NULL, -- GPU index.
context INTEGER NOT NULL, -- The context ID of WDDM queue.
uliCompletionId INTEGER NOT NULL, -- The queue packet completion ID.
packetType INTEGER NOT NULL, -- REFERENCES ENUM_WDDM_PACKET_TYPE(id)
ulQueueSubmitSequence INTEGER NOT NULL, -- Internal sequence starting from 1.
preempted INTEGER NOT NULL, -- True or False if the packet is preempted.
engineType INTEGER NOT NULL -- REFERENCES ENUM_WDDM_ENGINE_TYPE(id)
);
CREATE TABLE WDDM_DMA_PACKET_INFO_EVENTS (
-- Raw ETW DmaPacketInfo events.
start INTEGER NOT NULL, -- Event start timestamp (ns).
end INTEGER NOT NULL, -- Event end timestamp (ns).
globalTid INTEGER, -- Serialized GlobalId.
gpu INTEGER NOT NULL, -- GPU index.
context INTEGER NOT NULL, -- The context ID of WDDM queue.
uliCompletionId INTEGER NOT NULL, -- The queue packet completion ID.
faultedVirtualAddress INTEGER NOT NULL, -- The virtual address of faulted process.
faultedProcessHandle INTEGER NOT NULL, -- The address of faulted process.
packetType INTEGER NOT NULL, -- REFERENCES ENUM_WDDM_PACKET_TYPE(id)
ulQueueSubmitSequence INTEGER NOT NULL, -- Internal sequence starting from 1.
interruptType INTEGER NOT NULL, -- REFERENCES ENUM_WDDM_INTERRUPT_TYPE(id)
quantumStatus INTEGER NOT NULL, -- The quantum Status.
pageFaultFlags INTEGER NOT NULL, -- The page fault flag ID.
engineType INTEGER NOT NULL -- REFERENCES ENUM_WDDM_ENGINE_TYPE(id)
);
CREATE TABLE WDDM_HW_QUEUE_EVENTS (
-- Raw ETW HwQueueStart events.
start INTEGER NOT NULL, -- Event start timestamp (ns).
end INTEGER NOT NULL, -- Event end timestamp (ns).
globalTid INTEGER, -- Serialized GlobalId.
gpu INTEGER NOT NULL, -- GPU index.
context INTEGER NOT NULL, -- The context ID of WDDM queue.
hwQueue INTEGER NOT NULL, -- The address of HW queue.
parentDxgHwQueue INTEGER NOT NULL -- The address of parent Dxg HW queue.
);
CREATE TABLE NVVIDEO_ENCODER_API (
-- NV Video Encoder API traced to gather information about NVIDIA Video Codek SDK Encoder APIs.
start INTEGER NOT NULL, -- Event start timestamp (ns).
end INTEGER NOT NULL, -- Event end timestamp (ns).
eventClass INTEGER NOT NULL, -- REFERENCES ENUM_NSYS_EVENT_CLASS(id)
globalTid INTEGER, -- Serialized GlobalId.
nameId INTEGER NOT NULL -- REFERENCES StringIds(id) -- Function name
);
CREATE TABLE NVVIDEO_DECODER_API (
-- NV Video Encoder API traced to gather information about NVIDIA Video Codek SDK Decoder APIs.
start INTEGER NOT NULL, -- Event start timestamp (ns).
end INTEGER NOT NULL, -- Event end timestamp (ns).
eventClass INTEGER NOT NULL, -- REFERENCES ENUM_NSYS_EVENT_CLASS(id)
globalTid INTEGER, -- Serialized GlobalId.
nameId INTEGER NOT NULL -- REFERENCES StringIds(id) -- Function name
);
CREATE TABLE NVVIDEO_JPEG_API (
-- NV Video Encoder API traced to gather information about NVIDIA Video Codek SDK JPEG APIs.
start INTEGER NOT NULL, -- Event start timestamp (ns).
end INTEGER NOT NULL, -- Event end timestamp (ns).
eventClass INTEGER NOT NULL, -- REFERENCES ENUM_NSYS_EVENT_CLASS(id)
globalTid INTEGER, -- Serialized GlobalId.
nameId INTEGER NOT NULL -- REFERENCES StringIds(id) -- Function name
);
CREATE TABLE GPU_MEMORY_BUDGET_EVENTS (
-- Raw ETW VidMmProcessBudgetChange events.
timestamp INTEGER NOT NULL, -- Event start timestamp (ns).
globalTid INTEGER, -- Serialized GlobalId.
gpu INTEGER NOT NULL, -- GPU index.
newBudget INTEGER, -- The new budget size in bytes.
segmentGroup INTEGER -- The segment group ID.
);
CREATE TABLE GPU_MEMORY_USAGE_EVENTS (
-- Raw ETW VidMmProcessUsageChange events.
timestamp INTEGER NOT NULL, -- Event start timestamp (ns).
globalTid INTEGER, -- Serialized GlobalId.
gpu INTEGER NOT NULL, -- GPU index.
newUsage INTEGER, -- The new usage size in bytes.
segmentGroup INTEGER -- The segment group ID.
);
CREATE TABLE DEMOTED_BYTES_EVENTS (
-- Raw ETW VidMmProcessDemotedCommitmentChange events.
timestamp INTEGER NOT NULL, -- Event start timestamp (ns).
globalTid INTEGER, -- Serialized GlobalId.
gpu INTEGER NOT NULL, -- GPU index.
commitment INTEGER -- Total demoted bytes.
);
CREATE TABLE TOTAL_BYTES_RESIDENT_IN_SEGMENT_EVENTS (
-- Raw ETW TotalBytesResidentInSegment events.
timestamp INTEGER NOT NULL, -- Event start timestamp (ns).
globalTid INTEGER, -- Serialized GlobalId.
gpu INTEGER NOT NULL, -- GPU index.
totalBytesResident INTEGER, -- Total bytes resident in segment.
segmentGroup INTEGER, -- The segment group ID.
segmentId INTEGER -- The segment ID.
);
CREATE TABLE MEMORY_TRANSFER_EVENTS (
-- Raw ETW Memory Transfer events.
start INTEGER NOT NULL, -- Event start timestamp (ns).
globalTid INTEGER, -- Serialized GlobalId.
gpu INTEGER, -- GPU index.
taskId INTEGER NOT NULL, -- The event task ID.
eventId INTEGER NOT NULL, -- Event ID.
allocationGlobalHandle INTEGER NOT NULL, -- Address of the global allocation handle.
dmaBuffer INTEGER NOT NULL, -- The reported address of dma buffer.
size INTEGER NOT NULL, -- The size of the dma buffer in bytes.
offset INTEGER NOT NULL, -- The offset from the start of the reported dma buffer in bytes.
memoryTransferType INTEGER NOT NULL -- REFERENCES ENUM_ETW_MEMORY_TRANSFER_TYPE(id)
);
CREATE TABLE NV_LOAD_BALANCE_MASTER_EVENTS (
-- Raw ETW NV-wgf2um LoadBalanceMaster events.
start INTEGER NOT NULL, -- Event start timestamp (ns).
end INTEGER NOT NULL, -- Event end timestamp (ns).
globalTid INTEGER NOT NULL, -- Serialized GlobalId.
gpu INTEGER NOT NULL, -- GPU index.
eventId INTEGER NOT NULL, -- Event ID.
task TEXT NOT NULL, -- The task name.
frameCount INTEGER NOT NULL, -- The frame ID.
frameTime REAL NOT NULL, -- Frame duration.
averageFrameTime REAL NOT NULL, -- Average of frame duration.
averageLatency REAL NOT NULL, -- Average of latency.
minLatency REAL NOT NULL, -- The minimum latency.
averageQueuedFrames REAL NOT NULL, -- Average number of queued frames.
totalActiveMs REAL NOT NULL, -- Total active time in milliseconds.
totalIdleMs REAL NOT NULL, -- Total idle time in milliseconds.
idlePercent REAL NOT NULL, -- The percentage of idle time.
isGPUAlmostOneFrameAhead INTEGER NOT NULL -- True or False if GPU is almost one frame ahead.
);
CREATE TABLE NV_LOAD_BALANCE_EVENTS (
-- Raw ETW NV-wgf2um LoadBalance events.
start INTEGER NOT NULL, -- Event start timestamp (ns).
end INTEGER NOT NULL, -- Event end timestamp (ns).
globalTid INTEGER NOT NULL, -- Serialized GlobalId.
gpu INTEGER NOT NULL, -- GPU index.
eventId INTEGER NOT NULL, -- Event ID.
task TEXT NOT NULL, -- The task name.
averageFPS REAL NOT NULL, -- Average frame per second.
queuedFrames REAL NOT NULL, -- The amount of queued frames.
averageQueuedFrames REAL NOT NULL, -- Average number of queued frames.
currentCPUTime REAL NOT NULL, -- The current CPU time.
averageCPUTime REAL NOT NULL, -- Average CPU time.
averageStallTime REAL NOT NULL, -- Average of stall time.
averageCPUIdleTime REAL NOT NULL, -- Average CPU idle time.
isGPUAlmostOneFrameAhead INTEGER NOT NULL -- True or False if GPU is almost one frame ahead.
);
CREATE TABLE PROCESSES (
-- Names and identifiers of processes captured in the report.
globalPid INTEGER, -- Serialized GlobalId.
pid INTEGER, -- The process ID.
name TEXT -- The process name.
);
CREATE TABLE CUPTI_ACTIVITY_KIND_OPENACC_DATA (
-- OpenACC data events collected using CUPTI.
start INTEGER NOT NULL, -- Event start timestamp (ns).
end INTEGER NOT NULL, -- Event end timestamp (ns).
nameId INTEGER NOT NULL, -- REFERENCES StringIds(id) -- Event name
globalTid INTEGER, -- Serialized GlobalId.
eventKind INTEGER NOT NULL, -- REFERENCES ENUM_OPENACC_EVENT_KIND(id)
DeviceType INTEGER NOT NULL, -- REFERENCES ENUM_OPENACC_DEVICE(id)
lineNo INTEGER NOT NULL, -- Line number of the directive or program construct.
cuDeviceId INTEGER NOT NULL, -- CUDA device ID. Valid only if deviceType is acc_device_nvidia.
cuContextId INTEGER NOT NULL, -- CUDA context ID. Valid only if deviceType is acc_device_nvidia.
cuStreamId INTEGER NOT NULL, -- CUDA stream ID. Valid only if deviceType is acc_device_nvidia.
srcFile INTEGER, -- REFERENCES StringIds(id) -- Source file name or path
funcName INTEGER, -- REFERENCES StringIds(id) -- Function in which event occurred
bytes INTEGER, -- Number of bytes.
varName INTEGER -- REFERENCES StringIds(id) -- Variable name
);
CREATE TABLE CUPTI_ACTIVITY_KIND_OPENACC_LAUNCH (
-- OpenACC launch events collected using CUPTI.
start INTEGER NOT NULL, -- Event start timestamp (ns).
end INTEGER NOT NULL, -- Event end timestamp (ns).
nameId INTEGER NOT NULL, -- REFERENCES StringIds(id) -- Event name
globalTid INTEGER, -- Serialized GlobalId.
eventKind INTEGER NOT NULL, -- REFERENCES ENUM_OPENACC_EVENT_KIND(id)
DeviceType INTEGER NOT NULL, -- REFERENCES ENUM_OPENACC_DEVICE(id)
lineNo INTEGER NOT NULL, -- Line number of the directive or program construct.
cuDeviceId INTEGER NOT NULL, -- CUDA device ID. Valid only if deviceType is acc_device_nvidia.
cuContextId INTEGER NOT NULL, -- CUDA context ID. Valid only if deviceType is acc_device_nvidia.
cuStreamId INTEGER NOT NULL, -- CUDA stream ID. Valid only if deviceType is acc_device_nvidia.
srcFile INTEGER, -- REFERENCES StringIds(id) -- Source file name or path
funcName INTEGER, -- REFERENCES StringIds(id) -- Function in which event occurred
numGangs INTEGER, -- Number of gangs created for this kernel launch.
numWorkers INTEGER, -- Number of workers created for this kernel launch.
vectorLength INTEGER, -- Number of vector lanes created for this kernel launch.
kernelName INTEGER -- REFERENCES StringIds(id) -- Kernel name
);
CREATE TABLE CUPTI_ACTIVITY_KIND_OPENACC_OTHER (
-- OpenACC other events collected using CUPTI.
start INTEGER NOT NULL, -- Event start timestamp (ns).
end INTEGER NOT NULL, -- Event end timestamp (ns).
nameId INTEGER NOT NULL, -- REFERENCES StringIds(id) -- Event name
globalTid INTEGER, -- Serialized GlobalId.
eventKind INTEGER NOT NULL, -- REFERENCES ENUM_OPENACC_EVENT_KIND(id)
DeviceType INTEGER NOT NULL, -- REFERENCES ENUM_OPENACC_DEVICE(id)
lineNo INTEGER NOT NULL, -- Line number of the directive or program construct.
cuDeviceId INTEGER NOT NULL, -- CUDA device ID. Valid only if deviceType is acc_device_nvidia.
cuContextId INTEGER NOT NULL, -- CUDA context ID. Valid only if deviceType is acc_device_nvidia.
cuStreamId INTEGER NOT NULL, -- CUDA stream ID. Valid only if deviceType is acc_device_nvidia.
srcFile INTEGER, -- REFERENCES StringIds(id) -- Source file name or path
funcName INTEGER -- REFERENCES StringIds(id) -- Function in which event occurred
);
CREATE TABLE NET_NIC_METRIC (
start INTEGER NOT NULL, -- Event start timestamp (ns).
end INTEGER NOT NULL, -- Event end timestamp (ns).
globalId INTEGER NOT NULL, -- Serialized GlobalId.
metricsListId INTEGER NOT NULL, -- REFERENCES TARGET_INFO_NETWORK_METRICS(metricsListId)
metricsIdx INTEGER NOT NULL, -- REFERENCES TARGET_INFO_NETWORK_METRICS(metricsIdx)
value INTEGER NOT NULL -- Counter data value
);
CREATE TABLE NET_IB_SWITCH_METRIC (
start INTEGER NOT NULL, -- Event start timestamp (ns).
end INTEGER NOT NULL, -- Event end timestamp (ns).
globalId INTEGER NOT NULL, -- Serialized GlobalId.
metricsListId INTEGER NOT NULL, -- REFERENCES TARGET_INFO_NETWORK_METRICS(metricsListId)
metricsIdx INTEGER NOT NULL, -- REFERENCES TARGET_INFO_NETWORK_METRICS(metricsIdx)
value INTEGER NOT NULL -- Counter data value
);
SQLite Schema Event Values
Here are the set values stored in enums in the Nsight Systems SQLite schema
CUDA Event Class Values
0 - TRACE_PROCESS_EVENT_CUDA_RUNTIME
1 - TRACE_PROCESS_EVENT_CUDA_DRIVER
13 - TRACE_PROCESS_EVENT_CUDA_EGL_DRIVER
28 - TRACE_PROCESS_EVENT_CUDNN
29 - TRACE_PROCESS_EVENT_CUBLAS
33 - TRACE_PROCESS_EVENT_CUDNN_START
34 - TRACE_PROCESS_EVENT_CUDNN_FINISH
35 - TRACE_PROCESS_EVENT_CUBLAS_START
36 - TRACE_PROCESS_EVENT_CUBLAS_FINISH
67 - TRACE_PROCESS_EVENT_CUDABACKTRACE
77 - TRACE_PROCESS_EVENT_CUDA_GRAPH_NODE_CREATION
See CUPTI documentation for detailed information on collected event and data types.
NVTX Event Type Values
33 - NvtxCategory
34 - NvtxMark
39 - NvtxThread
59 - NvtxPushPopRange
60 - NvtxStartEndRange
75 - NvtxDomainCreate
76 - NvtxDomainDestroy
The difference between text and textId columns is that if an NVTX event message was passed via call to nvtxDomainRegisterString function, then the message will be available through textId field, otherwise the text field will contain the message if it was provided.
OpenGL Events
KHR event class values
62 - KhrDebugPushPopRange
63 - KhrDebugGpuPushPopRange
KHR source kind values
0x8249 - GL_DEBUG_SOURCE_THIRD_PARTY
0x824A - GL_DEBUG_SOURCE_APPLICATION
KHR type values
0x824C - GL_DEBUG_TYPE_ERROR
0x824D - GL_DEBUG_TYPE_DEPRECATED_BEHAVIOR
0x824E - GL_DEBUG_TYPE_UNDEFINED_BEHAVIOR
0x824F - GL_DEBUG_TYPE_PORTABILITY
0x8250 - GL_DEBUG_TYPE_PERFORMANCE
0x8251 - GL_DEBUG_TYPE_OTHER
0x8268 - GL_DEBUG_TYPE_MARKER
0x8269 - GL_DEBUG_TYPE_PUSH_GROUP
0x826A - GL_DEBUG_TYPE_POP_GROUP
KHR severity values
0x826B - GL_DEBUG_SEVERITY_NOTIFICATION
0x9146 - GL_DEBUG_SEVERITY_HIGH
0x9147 - GL_DEBUG_SEVERITY_MEDIUM
0x9148 - GL_DEBUG_SEVERITY_LOW
OSRT Event Class Values
OS runtime libraries can be traced to gather information about low-level userspace APIs. This traces the system call wrappers and thread synchronization interfaces exposed by the C runtime and POSIX Threads (pthread) libraries. This does not perform a complete runtime library API trace, but instead focuses on the functions that can take a long time to execute, or could potentially cause your thread be unscheduled from the CPU while waiting for an event to complete.
OSRT events may have callchains attached to them, depending on selected profiling settings. In such cases, one can use callchainId column to select relevant callchains from OSRT_CALLCHAINS table
OSRT event class values
27 - TRACE_PROCESS_EVENT_OS_RUNTIME
31 - TRACE_PROCESS_EVENT_OS_RUNTIME_START
32 - TRACE_PROCESS_EVENT_OS_RUNTIME_FINISH
DX12 Event Class Values
41 - TRACE_PROCESS_EVENT_DX12_API
42 - TRACE_PROCESS_EVENT_DX12_WORKLOAD
43 - TRACE_PROCESS_EVENT_DX12_START
44 - TRACE_PROCESS_EVENT_DX12_FINISH
52 - TRACE_PROCESS_EVENT_DX12_DISPLAY
59 - TRACE_PROCESS_EVENT_DX12_CREATE_OBJECT
PIX Event Class Values
65 - TRACE_PROCESS_EVENT_DX12_DEBUG_API
75 - TRACE_PROCESS_EVENT_DX11_DEBUG_API
Vulkan Event Class Values
53 - TRACE_PROCESS_EVENT_VULKAN_API
54 - TRACE_PROCESS_EVENT_VULKAN_WORKLOAD
55 - TRACE_PROCESS_EVENT_VULKAN_START
56 - TRACE_PROCESS_EVENT_VULKAN_FINISH
60 - TRACE_PROCESS_EVENT_VULKAN_CREATE_OBJECT
66 - TRACE_PROCESS_EVENT_VULKAN_DEBUG_API
Vulkan Flags
VALID_BIT = 0x00000001
CACHE_HIT_BIT = 0x00000002
BASE_PIPELINE_ACCELERATION_BIT = 0x00000004
SLI Event Class Values
62 - TRACE_PROCESS_EVENT_SLI
63 - TRACE_PROCESS_EVENT_SLI_START
64 - TRACE_PROCESS_EVENT_SLI_FINISH
SLI Transfer Info Values
0 - P2P_SKIPPED
1 - P2P_EARLY_PUSH
2 - P2P_PUSH_FAILED
3 - P2P_2WAY_OR_PULL
4 - P2P_PRESENT
5 - P2P_DX12_INIT_PUSH_ON_WRITE
WDDM Event Values
VIDMM operation type values
0 - None
101 - RestoreSegments
102 - PurgeSegments
103 - CleanupPrimary
104 - AllocatePagingBufferResources
105 - FreePagingBufferResources
106 - ReportVidMmState
107 - RunApertureCoherencyTest
108 - RunUnmapToDummyPageTest
109 - DeferredCommand
110 - SuspendMemorySegmentAccess
111 - ResumeMemorySegmentAccess
112 - EvictAndFlush
113 - CommitVirtualAddressRange
114 - UncommitVirtualAddressRange
115 - DestroyVirtualAddressAllocator
116 - PageInDevice
117 - MapContextAllocation
118 - InitPagingProcessVaSpace
200 - CloseAllocation
202 - ComplexLock
203 - PinAllocation
204 - FlushPendingGpuAccess
205 - UnpinAllocation
206 - MakeResident
207 - Evict
208 - LockInAperture
209 - InitContextAllocation
210 - ReclaimAllocation
211 - DiscardAllocation
212 - SetAllocationPriority
1000 - EvictSystemMemoryOfferList
Paging queue type values
0 - VIDMM_PAGING_QUEUE_TYPE_UMD
1 - VIDMM_PAGING_QUEUE_TYPE_Default
2 - VIDMM_PAGING_QUEUE_TYPE_Evict
3 - VIDMM_PAGING_QUEUE_TYPE_Reclaim
Packet type values
0 - DXGKETW_RENDER_COMMAND_BUFFER
1 - DXGKETW_DEFERRED_COMMAND_BUFFER
2 - DXGKETW_SYSTEM_COMMAND_BUFFER
3 - DXGKETW_MMIOFLIP_COMMAND_BUFFER
4 - DXGKETW_WAIT_COMMAND_BUFFER
5 - DXGKETW_SIGNAL_COMMAND_BUFFER
6 - DXGKETW_DEVICE_COMMAND_BUFFER
7 - DXGKETW_SOFTWARE_COMMAND_BUFFER
Engine type values
0 - DXGK_ENGINE_TYPE_OTHER
1 - DXGK_ENGINE_TYPE_3D
2 - DXGK_ENGINE_TYPE_VIDEO_DECODE
3 - DXGK_ENGINE_TYPE_VIDEO_ENCODE
4 - DXGK_ENGINE_TYPE_VIDEO_PROCESSING
5 - DXGK_ENGINE_TYPE_SCENE_ASSEMBLY
6 - DXGK_ENGINE_TYPE_COPY
7 - DXGK_ENGINE_TYPE_OVERLAY
8 - DXGK_ENGINE_TYPE_CRYPTO
DMA interrupt type values
1 = DXGK_INTERRUPT_DMA_COMPLETED
2 = DXGK_INTERRUPT_DMA_PREEMPTED
4 = DXGK_INTERRUPT_DMA_FAULTED
9 = DXGK_INTERRUPT_DMA_PAGE_FAULTED
Queue type values
0 = Queue_Packet
1 = Dma_Packet
2 = Paging_Queue_Packet
Driver Events
Load balance event type values
1 - LoadBalanceEvent_GPU
8 - LoadBalanceEvent_CPU
21 - LoadBalanceMasterEvent_GPU
22 - LoadBalanceMasterEvent_CPU
OpenMP Events
OpenMP event class values
78 - TRACE_PROCESS_EVENT_OPENMP
79 - TRACE_PROCESS_EVENT_OPENMP_START
80 - TRACE_PROCESS_EVENT_OPENMP_FINISH
OpenMP event kind values
15 - OPENMP_EVENT_KIND_TASK_CREATE
16 - OPENMP_EVENT_KIND_TASK_SCHEDULE
17 - OPENMP_EVENT_KIND_CANCEL
20 - OPENMP_EVENT_KIND_MUTEX_RELEASED
21 - OPENMP_EVENT_KIND_LOCK_INIT
22 - OPENMP_EVENT_KIND_LOCK_DESTROY
25 - OPENMP_EVENT_KIND_DISPATCH
26 - OPENMP_EVENT_KIND_FLUSH
27 - OPENMP_EVENT_KIND_THREAD
28 - OPENMP_EVENT_KIND_PARALLEL
29 - OPENMP_EVENT_KIND_SYNC_REGION_WAIT
30 - OPENMP_EVENT_KIND_SYNC_REGION
31 - OPENMP_EVENT_KIND_TASK
32 - OPENMP_EVENT_KIND_MASTER
33 - OPENMP_EVENT_KIND_REDUCTION
34 - OPENMP_EVENT_KIND_MUTEX_WAIT
35 - OPENMP_EVENT_KIND_CRITICAL_SECTION
36 - OPENMP_EVENT_KIND_WORKSHARE
OpenMP thread type values
1 - OpenMP Initial Thread
2 - OpenMP Worker Thread
3 - OpenMP Internal Thread
4 - Unknown
OpenMP sync region kind values
1 - Barrier
2 - Implicit barrier
3 - Explicit barrier
4 - Implementation-dependent barrier
5 - Taskwait
6 - Taskgroup
OpenMP task kind values
1 - Initial task
2 - Implicit task
3 - Explicit task
OpenMP prior task status values
1 - Task completed
2 - Task yielded to another task
3 - Task was cancelled
7 - Task was switched out for other reasons
OpenMP mutex kind values
1 - Waiting for lock
2 - Testing lock
3 - Waiting for nested lock
4 - Tesing nested lock
5 - Waitng for entering critical section region
6 - Waiting for entering atomic region
7 - Waiting for entering ordered region
OpenMP critical section kind values
5 - Critical section region
6 - Atomic region
7 - Ordered region
OpenMP workshare kind values
1 - Loop region
2 - Sections region
3 - Single region (executor)
4 - Single region (waiting)
5 - Workshare region
6 - Distrubute region
7 - Taskloop region
OpenMP dispatch kind values
1 - Iteration
2 - Section
Common SQLite Examples
Common Helper Commands
When utilizing sqlite3 command line tool, it’s helpful to have data printed as named columns, this can be done with:
.mode column
.headers on
Default column width is determined by the data in the first row of results. If this doesn’t work out well, you can specify widths manually.
.width 10 20 50
Obtaining Sample Report
CLI interface of Nsight Systems was used to profile radixSortThrust CUDA sample, then the resulting .nsys-rep file was exported using the nsys export.
nsys profile --trace=cuda,osrt radixSortThrust
nsys export --type sqlite report1.nsys-rep
Serialized Process and Thread Identifiers
Nsight Systems stores identifiers where events originated in serialized form. For events that have globalTid or globalPid fields exported, use the following code to extract numeric TID and PID.
SELECT globalTid / 0x1000000 % 0x1000000 AS PID, globalTid % 0x1000000 AS TID FROM TABLE_NAME;
Note: globalTid field includes both TID and PID values, while globalPid only containes the PID value.
Correlate CUDA Kernel Launches With CUDA API Kernel Launches
ALTER TABLE CUPTI_ACTIVITY_KIND_RUNTIME ADD COLUMN name TEXT;
ALTER TABLE CUPTI_ACTIVITY_KIND_RUNTIME ADD COLUMN kernelName TEXT;

UPDATE CUPTI_ACTIVITY_KIND_RUNTIME SET kernelName =
    (SELECT value FROM StringIds
    JOIN CUPTI_ACTIVITY_KIND_KERNEL AS cuda_gpu
        ON cuda_gpu.shortName = StringIds.id
        AND CUPTI_ACTIVITY_KIND_RUNTIME.correlationId = cuda_gpu.correlationId);

UPDATE CUPTI_ACTIVITY_KIND_RUNTIME SET name =
    (SELECT value FROM StringIds WHERE nameId = StringIds.id);
Select 10 longest CUDA API ranges that resulted in kernel execution.
SELECT name, kernelName, start, end FROM CUPTI_ACTIVITY_KIND_RUNTIME
    WHERE kernelName IS NOT NULL ORDER BY end - start LIMIT 10;
Results:
name                    kernelName               start       end
----------------------  -----------------------  ----------  ----------
cudaLaunchKernel_v7000  RadixSortScanBinsKernel  658863435   658868490
cudaLaunchKernel_v7000  RadixSortScanBinsKernel  609755015   609760075
cudaLaunchKernel_v7000  RadixSortScanBinsKernel  632683286   632688349
cudaLaunchKernel_v7000  RadixSortScanBinsKernel  606495356   606500439
cudaLaunchKernel_v7000  RadixSortScanBinsKernel  603114486   603119586
cudaLaunchKernel_v7000  RadixSortScanBinsKernel  802729785   802734906
cudaLaunchKernel_v7000  RadixSortScanBinsKernel  593381170   593386294
cudaLaunchKernel_v7000  RadixSortScanBinsKernel  658759955   658765090
cudaLaunchKernel_v7000  RadixSortScanBinsKernel  681549917   681555059
cudaLaunchKernel_v7000  RadixSortScanBinsKernel  717812527   717817671
Remove Ranges Overlapping With Overhead
Use the this query to count CUDA API ranges overlapping with the overhead ones.
Replace “SELECT COUNT(*)” with “DELETE” to remove such ranges.
SELECT COUNT(*) FROM CUPTI_ACTIVITY_KIND_RUNTIME WHERE rowid IN
(
    SELECT cuda.rowid
    FROM PROFILER_OVERHEAD as overhead
    INNER JOIN CUPTI_ACTIVITY_KIND_RUNTIME as cuda ON
    (cuda.start BETWEEN overhead.start and overhead.end)
    OR (cuda.end BETWEEN overhead.start and overhead.end)
    OR (cuda.start < overhead.start AND cuda.end > overhead.end)
);
Results:
COUNT(*)
----------
1095
Find CUDA API Calls That Resulted in Original Graph Node Creation.
SELECT graph.graphNodeId, api.start, graph.start as graphStart, api.end,
    api.globalTid, api.correlationId, api.globalTid,
    (SELECT value FROM StringIds where api.nameId == id) as name
FROM CUPTI_ACTIVITY_KIND_RUNTIME as api
JOIN
    (
        SELECT start, graphNodeId, globalTid from CUDA_GRAPH_EVENTS
        GROUP BY graphNodeId
        HAVING COUNT(originalGraphNodeId) = 0
    ) as graph
ON api.globalTid == graph.globalTid AND api.start < graph.start AND api.end > graph.start
ORDER BY graphNodeId;
Results:
graphNodeId  start       graphStart  end         globalTid        correlationId  globalTid        name
-----------  ----------  ----------  ----------  ---------------  -------------  ---------------  -----------------------------
1            584366518   584378040   584379102   281560221750233  109            281560221750233  cudaGraphAddMemcpyNode_v10000
2            584379402   584382428   584383139   281560221750233  110            281560221750233  cudaGraphAddMemsetNode_v10000
3            584390663   584395352   584396053   281560221750233  111            281560221750233  cudaGraphAddKernelNode_v10000
4            584396314   584397857   584398438   281560221750233  112            281560221750233  cudaGraphAddMemsetNode_v10000
5            584398759   584400311   584400812   281560221750233  113            281560221750233  cudaGraphAddKernelNode_v10000
6            584401083   584403047   584403527   281560221750233  114            281560221750233  cudaGraphAddMemcpyNode_v10000
7            584403928   584404920   584405491   281560221750233  115            281560221750233  cudaGraphAddHostNode_v10000
29           632107852   632117921   632121407   281560221750233  144            281560221750233  cudaMemcpyAsync_v3020
30           632122168   632125545   632127989   281560221750233  145            281560221750233  cudaMemsetAsync_v3020
31           632131546   632133339   632135584   281560221750233  147            281560221750233  cudaMemsetAsync_v3020
34           632162514   632167393   632169297   281560221750233  151            281560221750233  cudaMemcpyAsync_v3020
35           632170068   632173334   632175388   281560221750233  152            281560221750233  cudaLaunchHostFunc_v10000
Backtraces for OSRT Ranges
Adding text columns makes results of the query below more human-readable.
ALTER TABLE OSRT_API ADD COLUMN name TEXT;
UPDATE OSRT_API SET name = (SELECT value FROM StringIds WHERE OSRT_API.nameId = StringIds.id);

ALTER TABLE OSRT_CALLCHAINS ADD COLUMN symbolName TEXT;
UPDATE OSRT_CALLCHAINS SET symbolName = (SELECT value FROM StringIds WHERE symbol = StringIds.id);

ALTER TABLE OSRT_CALLCHAINS ADD COLUMN moduleName TEXT;
UPDATE OSRT_CALLCHAINS SET moduleName = (SELECT value FROM StringIds WHERE module = StringIds.id);
Print backtrace of the longest OSRT range
SELECT globalTid / 0x1000000 % 0x1000000 AS PID, globalTid % 0x1000000 AS TID,
    start, end, name, callchainId, stackDepth, symbolName, moduleName
FROM OSRT_API LEFT JOIN OSRT_CALLCHAINS ON callchainId == OSRT_CALLCHAINS.id
WHERE OSRT_API.rowid IN (SELECT rowid FROM OSRT_API ORDER BY end - start DESC LIMIT 1)
ORDER BY stackDepth LIMIT 10;
Results:
PID         TID         start       end         name                    callchainId  stackDepth  symbolName                      moduleName
----------  ----------  ----------  ----------  ----------------------  -----------  ----------  ------------------------------  ----------------------------------------
19163       19176       360897690   860966851   pthread_cond_timedwait  88           0           pthread_cond_timedwait@GLIBC_2  /lib/x86_64-linux-gnu/libpthread-2.27.so
19163       19176       360897690   860966851   pthread_cond_timedwait  88           1           0x7fbc983b7227                  /usr/lib/x86_64-linux-gnu/libcuda.so.418
19163       19176       360897690   860966851   pthread_cond_timedwait  88           2           0x7fbc9835d5c7                  /usr/lib/x86_64-linux-gnu/libcuda.so.418
19163       19176       360897690   860966851   pthread_cond_timedwait  88           3           0x7fbc983b64a8                  /usr/lib/x86_64-linux-gnu/libcuda.so.418
19163       19176       360897690   860966851   pthread_cond_timedwait  88           4           start_thread                    /lib/x86_64-linux-gnu/libpthread-2.27.so
19163       19176       360897690   860966851   pthread_cond_timedwait  88           5           __clone                         /lib/x86_64-linux-gnu/libc-2.27.so
Profiled processes output streams
ALTER TABLE ProcessStreams ADD COLUMN filename TEXT;
UPDATE ProcessStreams SET filename = (SELECT value FROM StringIds WHERE ProcessStreams.filenameId = StringIds.id);

ALTER TABLE ProcessStreams ADD COLUMN content TEXT;
UPDATE ProcessStreams SET content = (SELECT value FROM StringIds WHERE ProcessStreams.contentId = StringIds.id);
Select all collected stdout and stderr streams.
select globalPid / 0x1000000 % 0x1000000 AS PID, filename, content from ProcessStreams;
Results:
PID         filename                                                 content
----------  -------------------------------------------------------  --------------------------------------------------------------------------------------------------------------------
19163       /tmp/nvidia/nsight_systems/streams/pid_19163_stdout.log  /home/user_name/NVIDIA_CUDA-10.1_Samples/6_Advanced/radixSortThrust/radixSortThrust Starting...

GPU Device 0: "Quadro P2000" with compute capability 6.1


Sorting 1048576 32-bit unsigned int keys and values

radixSortThrust, Throughput = 401.0872 MElements/s, Time = 0.00261 s, Size = 1048576 elements
Test passed

19163       /tmp/nvidia/nsight_systems/streams/pid_19163_stderr.log
Thread Summary
Please note, that Nsight Systems applies additional logic during sampling events processing to work around lost events. This means that the results of the below query might differ slightly from the ones shown in “Analysis summary” tab.
Thread summary calculated using CPU cycles (when available).
SELECT
    globalTid / 0x1000000 % 0x1000000 AS PID,
    globalTid % 0x1000000 AS TID,
    ROUND(100.0 * SUM(cpuCycles) /
        (
            SELECT SUM(cpuCycles) FROM COMPOSITE_EVENTS
            GROUP BY globalTid / 0x1000000000000 % 0x100
        ),
        2
    ) as CPU_utilization,
    (SELECT value FROM StringIds WHERE id =
        (
            SELECT nameId FROM ThreadNames
            WHERE ThreadNames.globalTid = COMPOSITE_EVENTS.globalTid
        )
    ) as thread_name
FROM COMPOSITE_EVENTS
GROUP BY globalTid
ORDER BY CPU_utilization DESC
LIMIT 10;
Results:
PID         TID         CPU_utilization  thread_name
----------  ----------  ---------------  ---------------
19163       19163       98.4             radixSortThrust
19163       19168       1.35             CUPTI worker th
19163       19166       0.25             [NS]
Thread running time may be calculated using scheduling data, when PMU counter data was not collected.
CREATE INDEX sched_start ON SCHED_EVENTS (start);

CREATE TABLE CPU_USAGE AS
SELECT
    first.globalTid as globalTid,
    (SELECT nameId FROM ThreadNames WHERE ThreadNames.globalTid = first.globalTid) as nameId,
    sum(second.start - first.start) as total_duration,
    count() as ranges_count
FROM SCHED_EVENTS as first
LEFT JOIN SCHED_EVENTS as second
ON second.rowid =
    (
        SELECT rowid
        FROM SCHED_EVENTS
        WHERE start > first.start AND globalTid = first.globalTid
        ORDER BY start ASC
        LIMIT 1
    )
WHERE first.isSchedIn != 0
GROUP BY first.globalTid
ORDER BY total_duration DESC;

SELECT
    globalTid / 0x1000000 % 0x1000000 AS PID,
    globalTid % 0x1000000 AS TID,
    (SELECT value FROM StringIds where nameId == id) as thread_name,
    ROUND(100.0 * total_duration / (SELECT SUM(total_duration) FROM CPU_USAGE), 2) as CPU_utilization
FROM CPU_USAGE
ORDER BY CPU_utilization DESC;
Results:
PID         TID         thread_name      CPU_utilization
----------  ----------  ---------------  ---------------
19163       19163       radixSortThrust  93.74
19163       19169       radixSortThrust  3.22
19163       19168       CUPTI worker th  2.46
19163       19166       [NS]             0.44
19163       19172       radixSortThrust  0.07
19163       19167       [NS Comms]       0.05
19163       19176       radixSortThrust  0.02
19163       19170       radixSortThrust  0.0
Function Table
These examples demonstrate how to calculate Flat and BottomUp (for top level only) views statistics.
To set up:
ALTER TABLE SAMPLING_CALLCHAINS ADD COLUMN symbolName TEXT;
UPDATE SAMPLING_CALLCHAINS SET symbolName = (SELECT value FROM StringIds WHERE symbol = StringIds.id);

ALTER TABLE SAMPLING_CALLCHAINS ADD COLUMN moduleName TEXT;
UPDATE SAMPLING_CALLCHAINS SET moduleName = (SELECT value FROM StringIds WHERE module = StringIds.id);
To get flat view:
SELECT symbolName, moduleName, ROUND(100.0 * sum(cpuCycles) /
    (SELECT SUM(cpuCycles) FROM COMPOSITE_EVENTS), 2) AS flatTimePercentage
FROM SAMPLING_CALLCHAINS
LEFT JOIN COMPOSITE_EVENTS ON SAMPLING_CALLCHAINS.id == COMPOSITE_EVENTS.id
GROUP BY symbol, module
ORDER BY flatTimePercentage DESC
LIMIT 5;
To get BottomUp view (top level only):
SELECT symbolName, moduleName, ROUND(100.0 * sum(cpuCycles) /
    (SELECT SUM(cpuCycles) FROM COMPOSITE_EVENTS), 2) AS selfTimePercentage
FROM SAMPLING_CALLCHAINS
LEFT JOIN COMPOSITE_EVENTS ON SAMPLING_CALLCHAINS.id == COMPOSITE_EVENTS.id
WHERE stackDepth == 0
GROUP BY symbol, module
ORDER BY selfTimePercentage DESC
LIMIT 5;
Results:
symbolName   moduleName   flatTimePercentage
-----------  -----------  ------------------
[Max depth]  [Max depth]  99.92
thrust::zip  /home/user_  24.17
thrust::zip  /home/user_  24.17
thrust::det  /home/user_  24.17
thrust::det  /home/user_  24.17
symbolName      moduleName                                   selfTimePercentage
--------------  -------------------------------------------  ------------------
0x7fbc984982b6  /usr/lib/x86_64-linux-gnu/libcuda.so.418.39  5.29
0x7fbc982d0010  /usr/lib/x86_64-linux-gnu/libcuda.so.418.39  2.81
thrust::iterat  /home/user_name/NVIDIA_CUDA-10.1_Samples/6_  2.23
thrust::iterat  /home/user_name/NVIDIA_CUDA-10.1_Samples/6_  1.55
void thrust::i  /home/user_name/NVIDIA_CUDA-10.1_Samples/6_  1.55
DX12 API Frame Duration Histogram
The example demonstrates how to calculate DX12 CPU frames durartion and construct a histogram out of it.
CREATE INDEX DX12_API_ENDTS ON DX12_API (end);

CREATE TEMP VIEW DX12_API_FPS AS SELECT end AS start,
    (SELECT end FROM DX12_API
        WHERE end > outer.end AND nameId == (SELECT id FROM StringIds
            WHERE value == "IDXGISwapChain::Present")
        ORDER BY end ASC LIMIT 1) AS end
FROM DX12_API AS outer
    WHERE nameId == (SELECT id FROM StringIds WHERE value == "IDXGISwapChain::Present")
ORDER BY end;
Number of frames with a duration of [X, X + 1) milliseconds.
SELECT
    CAST((end - start) / 1000000.0 AS INT) AS duration_ms,
    count(*)
FROM DX12_API_FPS
WHERE end IS NOT NULL
GROUP BY duration_ms
ORDER BY duration_ms;
Results:
duration_ms  count(*)
-----------  ----------
3            1
4            2
5            7
6            153
7            19
8            116
9            16
10           8
11           2
12           2
13           1
14           4
16           3
17           2
18           1
GPU Context Switch Events Enumeration
GPU context duration is between first BEGIN and a matching END event.
SELECT (CASE tag WHEN 8 THEN "BEGIN" WHEN 7 THEN "END" END) AS tag,
    globalPid / 0x1000000 % 0x1000000 AS PID,
    vmId, seqNo, contextId, timestamp, gpuId FROM GPU_CONTEXT_SWITCH_EVENTS
WHERE tag in (7, 8) ORDER BY seqNo LIMIT 10;
Results:
tag         PID         vmId        seqNo       contextId   timestamp   gpuId
----------  ----------  ----------  ----------  ----------  ----------  ----------
BEGIN       23371       0           0           1048578     56759171    0
BEGIN       23371       0           1           1048578     56927765    0
BEGIN       23371       0           3           1048578     63799379    0
END         23371       0           4           1048578     63918806    0
BEGIN       19397       0           5           1048577     64014692    0
BEGIN       19397       0           6           1048577     64250369    0
BEGIN       19397       0           8           1048577     1918310004  0
END         19397       0           9           1048577     1918521098  0
BEGIN       19397       0           10          1048577     2024164744  0
BEGIN       19397       0           11          1048577     2024358650  0
Resolve NVTX Category Name
The example demonstrates how to resolve NVTX category name for NVTX marks and ranges.
WITH
  event AS (
    SELECT *
    FROM NVTX_EVENTS
    WHERE eventType IN (34, 59, 60) -- mark, push/pop, start/end
  ),
  category AS (
    SELECT
      category,
      domainId,
      text AS categoryName
    FROM NVTX_EVENTS
    WHERE eventType == 33 --  new category
  )
SELECT
  start,
  end,
  globalTid,
  eventType,
  domainId,
  category,
  categoryName,
  text
FROM event JOIN category USING (category, domainId)
ORDER BY start;
Results:
start       end         globalTid        eventType   domainId    category    categoryName               text
----------  ----------  ---------------  ----------  ----------  ----------  -------------------------  ----------------
18281150    18311960    281534938484214  59          0           1           FirstCategoryUnderDefault  Push Pop Range A
18288187    18306674    281534938484214  59          0           2           SecondCategoryUnderDefaul  Push Pop Range B
18294247                281534938484214  34          0           1           FirstCategoryUnderDefault  Mark A
18300034                281534938484214  34          0           2           SecondCategoryUnderDefaul  Mark B
18345546    18372595    281534938484214  60          1           1           FirstCategoryUnderMyDomai  Start End Range
18352924    18378342    281534938484214  60          1           2           SecondCategoryUnderMyDoma  Start End Range
18359634                281534938484214  34          1           1           FirstCategoryUnderMyDomai  Mark A
18365448                281534938484214  34          1           2           SecondCategoryUnderMyDoma  Mark B
Rename CUDA Kernels with NVTX
The example demonstrates how to map innermost NVTX push-pop range to a matching CUDA kernel run.
ALTER TABLE CUPTI_ACTIVITY_KIND_KERNEL ADD COLUMN nvtxRange TEXT;
CREATE INDEX nvtx_start ON NVTX_EVENTS (start);


UPDATE CUPTI_ACTIVITY_KIND_KERNEL SET nvtxRange = (
    SELECT NVTX_EVENTS.text
    FROM NVTX_EVENTS JOIN CUPTI_ACTIVITY_KIND_RUNTIME ON
        NVTX_EVENTS.eventType == 59 AND
        NVTX_EVENTS.globalTid == CUPTI_ACTIVITY_KIND_RUNTIME.globalTid AND
        NVTX_EVENTS.start <= CUPTI_ACTIVITY_KIND_RUNTIME.start AND
        NVTX_EVENTS.end >= CUPTI_ACTIVITY_KIND_RUNTIME.end
    WHERE
        CUPTI_ACTIVITY_KIND_KERNEL.correlationId == CUPTI_ACTIVITY_KIND_RUNTIME.correlationId
    ORDER BY NVTX_EVENTS.start DESC LIMIT 1
);

SELECT start, end, globalPid, StringIds.value as shortName, nvtxRange
FROM CUPTI_ACTIVITY_KIND_KERNEL JOIN StringIds ON shortName == id
ORDER BY start LIMIT 6;
Results:
start       end         globalPid          shortName      nvtxRange
----------  ----------  -----------------  -------------  ----------
526545376   526676256   72057700439031808  MatrixMulCUDA
526899648   527030368   72057700439031808  MatrixMulCUDA  Add
527031648   527162272   72057700439031808  MatrixMulCUDA  Add
527163584   527294176   72057700439031808  MatrixMulCUDA  My Kernel
527296160   527426592   72057700439031808  MatrixMulCUDA  My Range
527428096   527558656   72057700439031808  MatrixMulCUDA
Select CUDA Calls With Backtraces
ALTER TABLE CUPTI_ACTIVITY_KIND_RUNTIME ADD COLUMN name TEXT;
UPDATE CUPTI_ACTIVITY_KIND_RUNTIME SET name = (SELECT value FROM StringIds WHERE CUPTI_ACTIVITY_KIND_RUNTIME.nameId = StringIds.id);

ALTER TABLE CUDA_CALLCHAINS ADD COLUMN symbolName TEXT;
UPDATE CUDA_CALLCHAINS SET symbolName = (SELECT value FROM StringIds WHERE symbol = StringIds.id);

SELECT globalTid % 0x1000000 AS TID,
    start, end, name, callchainId, stackDepth, symbolName
FROM CUDA_CALLCHAINS JOIN CUPTI_ACTIVITY_KIND_RUNTIME ON callchainId == CUDA_CALLCHAINS.id
ORDER BY callchainId, stackDepth LIMIT 11;
Results:
TID         start       end         name           callchainId  stackDepth  symbolName
----------  ----------  ----------  -------------  -----------  ----------  --------------
11928       168976467   169077826   cuMemAlloc_v2  1            0           0x7f13c44f02ab
11928       168976467   169077826   cuMemAlloc_v2  1            1           0x7f13c44f0b8f
11928       168976467   169077826   cuMemAlloc_v2  1            2           0x7f13c44f3719
11928       168976467   169077826   cuMemAlloc_v2  1            3           cuMemAlloc_v2
11928       168976467   169077826   cuMemAlloc_v2  1            4           cudart::driver
11928       168976467   169077826   cuMemAlloc_v2  1            5           cudart::cudaAp
11928       168976467   169077826   cuMemAlloc_v2  1            6           cudaMalloc
11928       168976467   169077826   cuMemAlloc_v2  1            7           cudaError cuda
11928       168976467   169077826   cuMemAlloc_v2  1            8           main
11928       168976467   169077826   cuMemAlloc_v2  1            9           __libc_start_m
11928       168976467   169077826   cuMemAlloc_v2  1            10          _start
SLI Peer-to-Peer Query
The example demonstrates how to query SLI Peer-to-Peer events with resource size greater than value and within a time range sorted by resource size descending.
SELECT *
FROM SLI_P2P
WHERE resourceSize < 98304 AND start > 1568063100 AND end < 1579468901
ORDER BY resourceSize DESC;
Results:
start       end         eventClass  globalTid          gpu         frameId     transferSkipped  srcGpu      dstGpu      numSubResources  resourceSize  subResourceIdx  smplWidth   smplHeight  smplDepth   bytesPerElement  dxgiFormat  logSurfaceNames  transferInfo  isEarlyPushManagedByNvApi  useAsyncP2pForResolve  transferFuncName  regimeName  debugName   bindType
----------  ----------  ----------  -----------------  ----------  ----------  ---------------  ----------  ----------  ---------------  ------------  --------------  ----------  ----------  ----------  ---------------  ----------  ---------------  ------------  -------------------------  ---------------------  ----------------  ----------  ----------  ----------
1570351100  1570351101  62          72057698056667136  0           771         0                256         512         1                1048576       0               256         256         1           16               2                            3             0                          0
1570379300  1570379301  62          72057698056667136  0           771         0                256         512         1                1048576       0               64          64          64          4                31                           3             0                          0
1572316400  1572316401  62          72057698056667136  0           773         0                256         512         1                1048576       0               256         256         1           16               2                            3             0                          0
1572345400  1572345401  62          72057698056667136  0           773         0                256         512         1                1048576       0               64          64          64          4                31                           3             0                          0
1574734300  1574734301  62          72057698056667136  0           775         0                256         512         1                1048576       0               256         256         1           16               2                            3             0                          0
1574767200  1574767201  62          72057698056667136  0           775         0                256         512         1                1048576       0               64          64          64          4                31                           3             0                          0
Generic Events
Syscall usage histogram by PID:
SELECT json_extract(data, '$.common_pid') AS PID, count(*) AS total
FROM GENERIC_EVENTS WHERE PID IS NOT NULL AND typeId = (
  SELECT typeId FROM GENERIC_EVENT_TYPES
  WHERE json_extract(data, '$.Name') = "raw_syscalls:sys_enter")
GROUP BY PID
ORDER BY total DESC
LIMIT 10;
Results:
PID         total
----------  ----------
5551        32811
9680        3988
4328        1477
9564        1246
4376        1204
4377        1167
4357        656
4355        655
4356        640
4354        633
Fetching Generic Events in JSON Format
Text and JSON export modes don’t include generic events. Use the below queries (without LIMIT clause) to extract JSON lines representation of generic events, types and sources.
SELECT json_insert('{}',
    '$.sourceId', sourceId,
    '$.data', json(data)
)
FROM GENERIC_EVENT_SOURCES LIMIT 2;

SELECT json_insert('{}',
    '$.typeId', typeId,
    '$.sourceId', sourceId,
    '$.data', json(data)
)
FROM GENERIC_EVENT_TYPES LIMIT 2;

SELECT json_insert('{}',
    '$.rawTimestamp', rawTimestamp,
    '$.timestamp', timestamp,
    '$.typeId', typeId,
    '$.data', json(data)
)
FROM GENERIC_EVENTS LIMIT 2;
Results:
json_insert('{}',
    '$.sourceId', sourceId,
    '$.data', json(data)
)
---------------------------------------------------------------------------------------------------------------
{"sourceId":72057602627862528,"data":{"Name":"FTrace","TimeSource":"ClockMonotonicRaw","SourceGroup":"FTrace"}}
json_insert('{}',
    '$.typeId', typeId,
    '$.sourceId', sourceId,
    '$.data', json(data)
)
--------------------------------------------------------------------------------------------------------------------
{"typeId":72057602627862547,"sourceId":72057602627862528,"data":{"Name":"raw_syscalls:sys_enter","Format":"\"NR %ld (%lx, %lx, %lx, %lx, %lx, %lx)\", REC->id, REC->args[0], REC->args[1], REC->args[2], REC->args[3], REC->args[4], REC->args[5]","Fields":[{"Name":"common_pid","Prefix":"int","Suffix":""},{"Name":"id","Prefix":"long","S
{"typeId":72057602627862670,"sourceId":72057602627862528,"data":{"Name":"irq:irq_handler_entry","Format":"\"irq=%d name=%s\", REC->irq, __get_str(name)","Fields":[{"Name":"common_pid","Prefix":"int","Suffix":""},{"Name":"irq","Prefix":"int","Suffix":""},{"Name":"name","Prefix":"__data_loc char[]","Suffix":""},{"Name":"common_type",
json_insert('{}',
    '$.rawTimestamp', rawTimestamp,
    '$.timestamp', timestamp,
    '$.typeId', typeId,
    '$.data', json(data)
)
--------------------------------------------------------------------------------------------------------------------
{"rawTimestamp":1183694330725221,"timestamp":6236683,"typeId":72057602627862670,"data":{"common_pid":"0","irq":"66","name":"327696","common_type":"142","common_flags":"9","common_preempt_count":"0"}}
{"rawTimestamp":1183694333695687,"timestamp":9207149,"typeId":72057602627862670,"data":{"common_pid":"0","irq":"66","name":"327696","common_type":"142","common_flags":"9","common_preempt_count":"0"}}
Arrow Format Description
The Arrow type exported file uses the IPC stream format to store the data in a file. The tables can be read by opening the file as an arrow stream. For example one can use the open_stream function from the arrow python package. For more information on the interfaces that can be used to read an IPC stream file, please refer to the Apache Arrow documentation [1, 2].
The name of each table is included in the schema metadata. Thus, while reading each table, the user can extract the table title from the metadata. The table name metadata field has the key table_name. The titles of all the available tables can be found in section SQLite Schema Reference.
JSON and Text Format Description
JSON and TXT export formats are generated by serializing buffered messages, each on a new line. First, all collected events are processed. Then strings are serialized, followed by stdout, stderr streams if any, followed by thread names.
Output layout:
{Event #1}
{Event #2}
...
{Event #N}
{Strings}
{Streams}
{Threads}
For easier grepping of JSON output, the --separate-strings switch may be used to force manual splitting of strings, streams and thread names data.
Example line split: nsys export --export-json --separate-strings sample.nsys-rep -- -
{"type":"String","id":"3720","value":"Process 14944 was launched by the profiler"}
{"type":"String","id":"3721","value":"Profiling has started."}
{"type":"String","id":"3722","value":"Profiler attached to the process."}
{"type":"String","id":"3723","value":"Profiling has stopped."}
{"type":"ThreadName","globalTid":"72057844756653436","nameId":"14","priority":"10"}
{"type":"ThreadName","globalTid":"72057844756657940","nameId":"15","priority":"10"}
{"type":"ThreadName","globalTid":"72057844756654400","nameId":"24","priority":"10"}
Compare with: nsys export --export-json sample.nsys-rep -- -
{"data":["[Unknown]","[Unknown kernel module]","[Max depth]","[Broken backtraces]",
  "[Called from Java]","QnxKernelTrace","mm_","task_submit","class_id","syncpt_id",
  "syncpt_thresh","pid","tid","FTrace","[NSys]","[NSys Comms]", "..." ,"Process
  14944 was launched by the profiler","Profiling has started.","Profiler attached
  to the process.","Profiling has stopped."]}
{"data":[{"nameIdx":"14","priority":"10","globalTid":"72057844756653436"},
  {"nameIdx":"15","priority":"10","globalTid":"72057844756657940"},{"nameIdx":"24",
  "priority":"10","globalTid":"72057844756654400"}]}
Note, that only last few lines are shown here for clarity and that carriage returns and indents were added to avoid wrapping documentation.
Statistical Analysis
Statistical Reports Shipped With Nsight Systems
The Nsight Systems development team created and maintains a set of report scripts for some of the commonly requested statistical reports. These scripts will be updated to adapt to any changes in SQLite schema or internal data structures.
These scripts are located in the Nsight Systems package in the Target-<architecture>/reports directory. The following standard reports are available:
Note: The ability to display mangled names is a recent addition to the report file format, and requires that the profile data be captured with a recent version of Nsys. Re-exporting an existing report file is not sufficient. If the raw, mangled kernel name data is not available, the default demangled names will be used.
Note: All time values given in nanoseconds by default. If you wish to output the results using a different time unit, use the --timeunit option when running the recipe.
Report Formatters Shipped With Nsight Systems
The following formats are available in Nsight Systems
Expert Systems Analysis
The Nsight Systems expert system is a feature aimed at automatic detection of performance optimization opportunities in an application’s profile. It uses a set of predefined rules to determine if the application has known bad patterns.
Using Expert System from the CLI
usage:
nsys [global-options] analyze [options]
       [nsys-rep-or-sqlite-file]
If a .nsys-rep file is given as the input file and there is no .sqlite file with the same name in the same directory, it will be generated.
Note: The Expert System view in the GUI will give you the equivalent command line.
Using Expert System from the GUI
The Expert System View can be found in the same drop-down as the Events View. If there is no .sqlite file with the same name as the .nsys-rep file in the same directory, it will be generated.
The Expert System View has the following components:
Drop-down to select the rule to be run
Rule description and advice summary
CLI command that will give the same result
Table containing results of running the rule
Settings button that allows users to specify the rule’s arguments
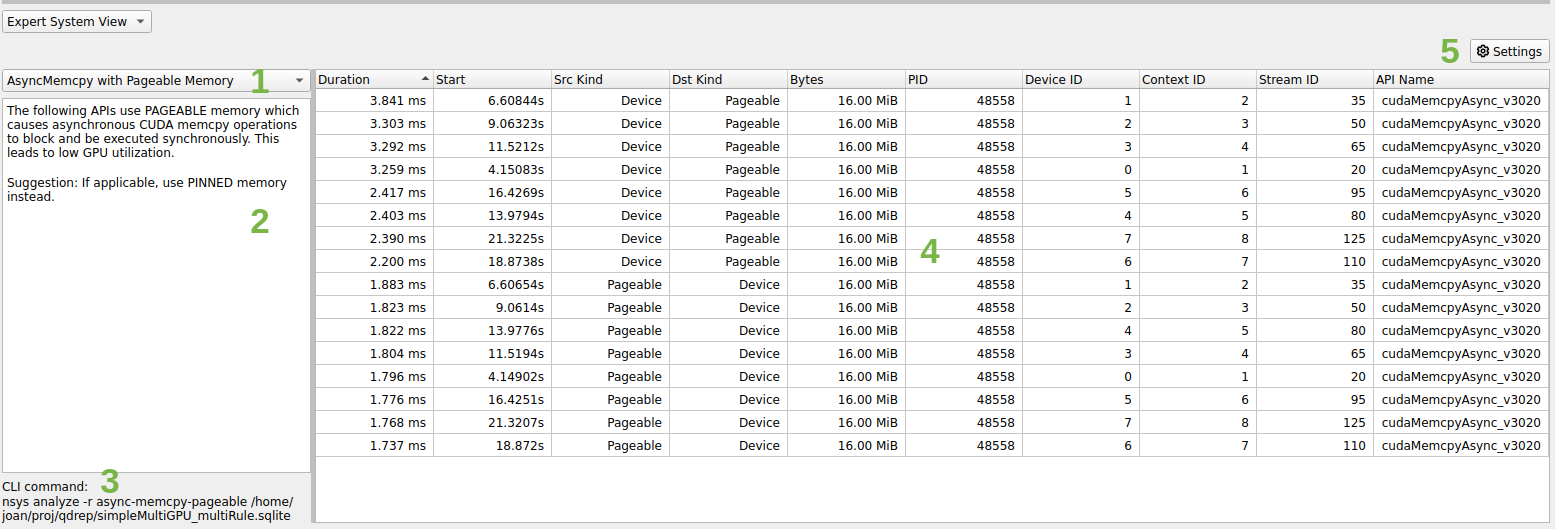
A context menu is available to correlate the table entry with the timeline. The options are the same as the Events View:
Zoom to Selected on Timeline (ctrl+double-click)
The highlighting is not supported for rules that do not return an event but rather an arbitrary time range (e.g. GPU utilization rules).
The CLI and GUI share the same rule scripts and messages. There might be some formatting differences between the output table in GUI and CLI.
Expert System Rules
Rules are scripts that run on the SQLite DB output from Nsight Systems to find common improvable usage patterns.
Each rule has an advice summary with explanation of the problem found and suggestions to address it. Only the top 50 results are displayed by default.
There are currently six rules in the expert system. They are described below. Additional rules will be made available in a future version of Nsight Systems.
Multi-Report Analysis
PREVIEW FEATURE
Nsight Systems Multi-Report Analysis is new functionality that is being added to the Nsight Systems tool to better support complex statistical analysis across multiple result files. Possible use cases for this functionality include:
Multi-Node Analysis - When you run Nsight Systems across a cluster, it typically generates one result file per rank on the cluster. While you can load multiple result files into the GUI for visualization, this analysis system allows you to run statistical analysis across all of the result files.
Multi-Pass Analysis - Some features in Nsight Systems cannot be run together due to overhead or hardware considerations. For example, there are frequently more CPU performance counters available than your CPU has registers. Using this analysis, you could run multiple runs with different sets of counters and then analyze the results together.
Multi-Run Analysis - Sometimes you want to compare two runs that were not taken at the same time together. Perhaps you ran the tool on two different hardware configurations and want to see what changed. Perhaps you are doing regression testing or performance improvement analysis and want to check your status. Comparing those result files statistically can show patterns.
Analysis Steps
Note
Prior to using multi-report analysis, please make sure that you have installed all required dependencies. See Installing Multi-Report Analysis System in the Installation Guide for more information.
Generate the reports - Generate the reports as you always have, in fact, you can use reports that you have generated previously.
Set up - Choose the recipe (See Available Recipes, below), give it any required parameters, and run.
Launch Analysis - Nsight Systems will run the analysis, using your local system or Dask, as you have selected.
Output - the output is an .nsys-analysis file, which can then be opened within the Nsight Systems GUI.
View the data - depending on your recipe, you can have any number of visualizations, from simple tabular information to Jupyter notebooks which can be opened inside the GUI.
Available Recipes
All recipes are run using the new “recipe” CLI command switch.
usage:
nsys recipe [args] <recipe-name> [recipe args]
Nsight Systems provides several initial analysis recipes, mostly based around making our existing statistics and expert systems rules run multi-report.
These recipes can be found at <target-linux-x64>/python/packages/nsys_recipe. They are written in Python, and you can edit them if you would like. However, be advised that as this is a preview release, it is likely that the APIs will change between now and the final release. Additional recipes will be added before the product release and on an ongoing basis.
Statistics and Expert Systems Recipes
The following stats and expert systems options from Nsight Systems are available as recipes. For more information about them please use nsys recipe [recipe name] --help or see Nsight Systems Report Scripts in this documentation
cuda_api_sum - CUDA API Summary
cuda_api_sync - CUDA Synchronization APIs
cuda_gpu_kern_sum - CUDA GPU Kernel Summary
cuda_gpu_mem_size_sum - CUDA GPU MemOps Summary (by Size)
cuda_gpu_mem_time_sum - CUDA GPU MemOps Summary (by Time)
cuda_memcpy_async - CUDA Async Memcpy with Pageable Memory
cuda_memcpy_sync - CUDA Synchronous Memcpy
cuda_memset_sync - CUDA Synchronous Memset
dx12_mem_ops - DX12 Memory Operations
gpu_gaps - GPU Gaps
gpu_time_util - GPU Time Utilization
nvtx_gpu_proj_trace - NVTX GPU Trace
nvtx_sum - NVTX Range Summary
osrt_sum - OS Runtime Summary
Please note that all recipes are in the form of python scripts. You may alter the given recipes or write your own to meet your needs. Refer to Tutorial: Create a User-Defined Recipe for an example of how to do this
Heatmap Recipes
cuda_gpu_time_util_map - CUDA GPU Kernel Time Utilization Heatmap
gpu_metric_util_map - GPU Metric Utilization Heatmap
Both recipes generate a Jupyter notebook with code cells ready to plot the heatmap chart:
cuda_gpu_time_util_map -- CUDA GPU Kernel Time Utilization Heatmap

$ nsys recipe cuda_gpu_time_util_map --help
usage: cuda_gpu_time_util_map.py [-h] [--output OUTPUT] [--force-overwrite]
                                 [--start time] [--end time]
                                 [--nvtx range[@domain]] [--rows limit]
                                 [--bins BINS] --dir DIR
                                 [--mode {none,concurrent,dask-futures}]

This recipe calculates the percentage of GPU utilization based on the presence
of CUDA kernels. Note that the utilization refers to the "time" utilization
and not the "resource" utilization. If multiple kernels run concurrently,
their utilization will be added up and may exceed 100%.

options:
  -h, --help            show this help message and exit

Context:
  --mode {none,concurrent,dask-futures}
                        Mode to run tasks

Recipe:
  --output OUTPUT       Output directory name
  --force-overwrite     Overwrite existing directory
  --start time          Start time used for filtering in nanoseconds
  --end time            End time used for filtering in nanoseconds
  --nvtx range[@domain]
                        NVTX range and domain used for filtering
  --rows limit          Maximum number of rows per input file
  --bins BINS           Number of bins
  --dir DIR             Directory of nsys-rep files
gpu_metric_util_map -- GPU Metric Utilization Heatmap

$ nsys recipe gpu_metric_util_map --help
usage: gpu_metric_util_map.py [-h] [--output OUTPUT] [--force-overwrite]
                              [--start time] [--end time]
                              [--nvtx range[@domain]] [--rows limit]
                              [--bins BINS] --dir DIR
                              [--mode {none,concurrent,dask-futures}]

This recipe calculates the percentage of SM Active, SM Issue, and Tensor
Active metrics.

options:
  -h, --help            show this help message and exit

Context:
  --mode {none,concurrent,dask-futures}
                        Mode to run tasks

Recipe:
  --output OUTPUT       Output directory name
  --force-overwrite     Overwrite existing directory
  --start time          Start time used for filtering in nanoseconds
  --end time            End time used for filtering in nanoseconds
  --nvtx range[@domain]
                        NVTX range and domain used for filtering
  --rows limit          Maximum number of rows per input file
  --bins BINS           Number of bins
  --dir DIR             Directory of nsys-rep files
Pacing Recipes
cuda_gpu_kern_pace - CUDA GPU Kernel Pacing
nvtx_pace - NVTX Pacing
Both recipes generate a Jupyter notebook with code cells ready to plot various graphs showing the progress of the target operation/range for each rank:
cuda_gpu_kern_pace -- CUDA GPU Kernel Pacing

$ nsys recipe cuda_gpu_kern_pace --help
usage: cuda_gpu_kern_pace.py [-h] [--output OUTPUT] [--force-overwrite] --name
                             NAME --dir DIR
                             [--mode {none,concurrent,dask-futures}]

This recipe investigates the progress and consistency of an iteration based
application.

optional arguments:
  -h, --help            show this help message and exit

Context:
  --mode {none,concurrent,dask-futures}
                        Mode to run tasks

Recipe:
  --output OUTPUT       Output directory name
  --force-overwrite     Overwrite existing directory
  --name NAME           Name of the kernel used as delineator between
                        iterations
  --dir DIR             Directory of nsys-rep files
nvtx_pace -- NVTX Pacing

$ nsys recipe nvtx_pace --help
usage: nvtx_pace.py [-h] [--output OUTPUT] [--force-overwrite] [--gpu] --name
                    NAME --dir DIR [--mode {none,concurrent,dask-futures}]

This recipe investigates the progress and consistency of an iteration based
application.

optional arguments:
  -h, --help            show this help message and exit

Context:
  --mode {none,concurrent,dask-futures}
                        Mode to run tasks

Recipe:
  --output OUTPUT       Output directory name
  --force-overwrite     Overwrite existing directory
  --gpu                 GPU projection
  --name NAME           Name of the NVTX range used as delineator between
                        iterations
  --dir DIR             Directory of nsys-rep files
Additional Statistics Recipes
mpi_sum - MPI Summary
nccl_sum - NCCL Summary
nvtx_gpu_proj_sum - NVTX GPU Projection Summary
All recipes generate a Jupyter notebook with code cells ready to plot various statistical graphs:
mpi_sum -- MPI Summary

$ nsys recipe mpi_sum --help
usage: mpi_sum.py [-h] [--output OUTPUT] [--force-overwrite] --dir DIR
                  [--mode {none,concurrent,dask-futures}]

This recipe provides a summary of MPI functions and their execution times.

optional arguments:
  -h, --help            show this help message and exit

Context:
  --mode {none,concurrent,dask-futures}
                        Mode to run tasks

Recipe:
  --output OUTPUT       Output directory name
  --force-overwrite     Overwrite existing directory
  --dir DIR             Directory of nsys-rep files
nccl_sum -- NCCL Summary

$ nsys recipe nccl_sum --help
usage: nccl_sum.py [-h] [--output OUTPUT] [--force-overwrite] [--gpu] --dir
                   DIR [--mode {none,concurrent,dask-futures}]

This recipe provides a summary of NCCL functions and their execution times.

optional arguments:
  -h, --help            show this help message and exit

Context:
  --mode {none,concurrent,dask-futures}
                        Mode to run tasks

Recipe:
  --output OUTPUT       Output directory name
  --force-overwrite     Overwrite existing directory
  --gpu                 GPU projection
  --dir DIR             Directory of nsys-rep files
nvtx_gpu_proj_sum -- NVTX GPU Projection Summary

$ nsys recipe nvtx_gpu_proj_sum --help
usage: nvtx_gpu_proj_sum.py [-h] [--output OUTPUT] [--force-overwrite] [--gpu]
                            --dir DIR [--mode {none,concurrent,dask-futures}]

This recipe provides a summary of NVTX time ranges projected from the CPU onto
the GPU, and their execution times.

optional arguments:
  -h, --help            show this help message and exit

Context:
  --mode {none,concurrent,dask-futures}
                        Mode to run tasks

Recipe:
  --output OUTPUT       Output directory name
  --force-overwrite     Overwrite existing directory
  --gpu                 GPU projection
  --dir DIR             Directory of nsys-rep files
Opening in Jupyter Notebook
Running the recipe command creates a new analysis file (.nsys-analysis). Open the Nsight Systems GUI and select File->Open, and pick your file.
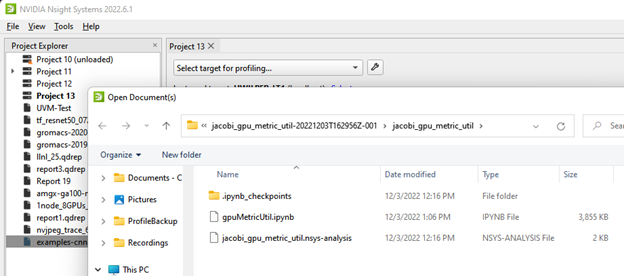
Open the folder icon and click on the notebook icon to open the Jupyter notebook.
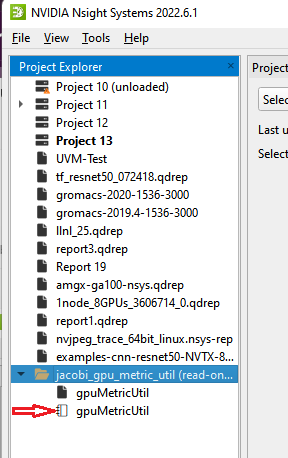
Run the Jupyter notebook:
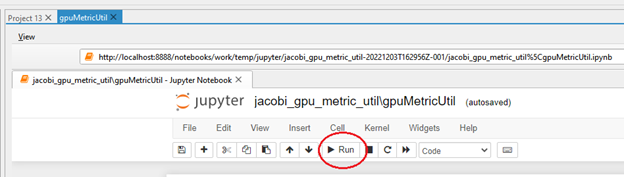
And the output appears on-screen. In this case a heat map of activity running a Jacobi solver.
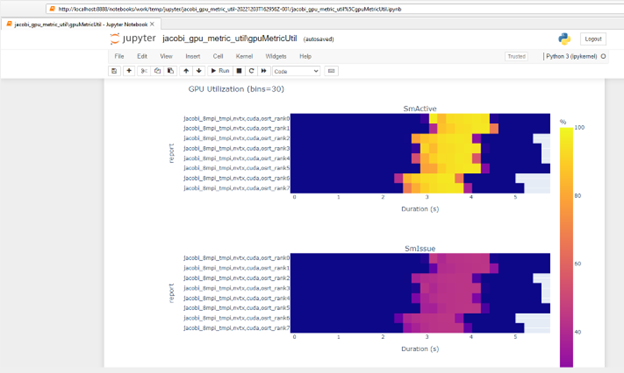
Configuring Dask
The multi-report analysis system does not offer options to configure the Dask environment. However, you could achieve this by modifying the recipe script directly or using one of the following from Dask’s configuration system:
YAML files: Dask by default searches for all YAML files in
~/.config/dask/or/etc/dask/. This search path can be changed using the environment variableDASK_ROOT_CONFIGorDASK_CONFIG. See Dask documentation for the complete list of locations and the lookup order. Example:$ cat example.yaml 'Distributed': 'scheduler': 'allowed-failures': 5Environment variables: Dask searches for all environment variables that start with
DASK_, then transforms keys by converting to lower-case and changing double-underscores to nested structures. See Dask documentation for the complete list of variables. Example:DASK_DISTRIBUTED__SCHEDULER__ALLOWED_FAILURES=5
Dask Client
With no configuration set, the dask-futures mode option initializes the Dask Client with the default arguments, which results in creating a LocalCluster in the background. The following are the YAML/environment variables that could be set to change the default behavior:
distributed.comm.timeouts.connect / DASK_DISTRIBUTED__COMM__TIMEOUTS__CONNECT
client-name / DASK_CLIENT_NAME
scheduler-address / DASK_SCHEDULER_ADDRESS
distributed.client.heartbeat / DASK_DISTRIBUTED__CLIENT__HEARTBEAT
distributed.client.scheduler-info-interval / DASK_DISTRIBUTED__CLIENT__SCHEDULER_INFO_INTERVAL
distributed.client.preload / DASK_DISTRIBUTED__CLIENT__PRELOAD
distributed.client.preload-argv / DASK_DISTRIBUTED__CLIENT__PRELOAD_ARGV
Recipe’s environment variables
Recipe has its own list of environment variables to make the configuration more complete and flexible. These environment variables are either missing from Dask’s configuration system or specific to the recipe system:
NSYS_DASK_SCHEDULER_FILE: Path to a file with scheduler information. It will be used to initialize the Dask Client.
NSYS_DIR: Path to the directory of Nsight Systems containing the target and host directories. The nsys executable and the recipe dependencies will be searched in this directory instead of the one deduced from the currently running recipe file path.
Tutorial: Create a User-Defined Recipe
The Nsight Systems recipe system is designed to be extensible and we hope that many users will use it to create their own recipes. This short tutorial will highlight the steps needed to create a recipe that is a customized version of one of the recipes that is included in the Nsight Systems recipe package.
Step 1: Create the recipe directory and script
Make a new directory in the
<install-dir>/target-linux-x64/python/packages/nsys_recipe folder based on
the name of your new recipe. For this example, we will call our new recipe
new_metric_util_map. We will copy the existing gpu_metric_util_map.py script
and create a new script called
new_metric_util_map.py in the new_metric_util_map directory. We will also
copy the heatmap.ipynb file into the new_metric_util_map directory. Type these
steps in a Linux terminal window:
> cd <install-dir>/target-linux-x64/python/packages/nsys_recipe
> mkdir new_metric_util_map
> cp gpu_metric_util_map/metadata.json new_metric_util_map/metadata.json
> cp gpu_metric_util_map/heatmap.ipynb new_metric_util_map/heatmap.ipynb
Replace the module name in metadata.json with new_metric_util_map and update the display name and description to your preference. Also, rename the class name GpuMetricUtilMap in gpu_metric_util_map.py to NewMetricUtilMap. We will discuss the detailed functionality of the new recipe code in the subsequent steps.
Step 2: Modify the mapper function
Many recipes are structured as a map-reduce algorithm. The mapper function is called for every .nsys-rep file in the report directory. The mapper function performs a series of calculations on the events in each Nsight Systems report and produces an intermediate data set. The intermediate results are then combined by the reduce function to produce the final results. The mapper function can be called in parallel, either on multiple cores of a single node (using the concurrent python module), or multiple ranks of a multi-node recipe analysis (using the Dask distributed module).
When we create a new recipe, we need to create a class that derives from the Recipe base class. For our example, that class will be called NewMetricUtilMap (which we had renamed in step 1).
The mapper function is called mapper_func(). It will first convert the .nsys-rep file into an SQLite database, if the SQLite file does not already exist. It then reads all the necessary tables from the SQLite file into Pandas Dataframes needed by the recipe. GPU Metric data is stored using a database schema table called GENERIC_EVENTS. For extra flexibility, GENERIC_EVENTS represents the data as a JSON object, which is stored as a string. The NewMetricUtilMap class extracts fields from the JSON object and accumulates them over the histogram bins of the heat map.
The original script retrieved three GPU metrics: SM Active, SM Issue, and Tensor Active. In our new version of the script, we will extract a fourth metric, Unallocated Warps in Active SMs.
Find this line (approximately line 65):
metric_cols = ['SM Active', 'SM Issue', 'Tensor Active']
Add the Unallocated Warps in Active SMs metric:
metric_cols = ['SM Active', 'SM Issue', 'Tensor Active', 'Unallocated Warps in Active SMs']
Step 3: Modify the reduce function
Our new mapper function will extract four GPU metrics and return them as a Pandas DataFrame. The reduce function receives a list of DataFrames, one for each .nsys-rep file in the analysis, and combines them into a single DataFrame using the Pandas concat function. Since the reducer function is generic in our case, no modifications are needed. However, if you would like to add any additional post-processing, you can do so in this function.
Step 4: Add a plot to the Jupyter notebook
Our new recipe class will create a Parquet output file with all the data produced by the reducer function, using the to_parquet() function. It will also create a Jupyter notebook file using the create_notebook() function.
In this step, we will change the create_notebook() function to produce a plot for our fourth metric. To do this, we need to change these two lines (located in the second cell of new_metric_util_map/heatmap.ipynb):
metrics = ('SM Active', 'SM Issue', 'Tensor Active')
fig = make_subplots(3, 1, subplot_titles=metrics)
To this:
metrics = ('SM Active', 'SM Issue', 'Tensor Active', 'Unallocated Warps in Active SMs')
fig = make_subplots(4, 1, subplot_titles=metrics)
That completes all the modifications for our NewMetricUtilMap class.
Step 5: Run the new recipe
If the new recipe is located in the default recipe directory nsys_recipe/recipes,
we can directly run it using the nsys recipe command like this:
> nsys recipe new_metric_util_map --input <directory of reports>
It is also possible to have a recipe located outside of this directory. In this
case, you need to set the environment variable NSYS_RECIPE_PATH to the directory
containing the recipe when running the nsys recipe command.
When successful, the recipe should produce a new recipe result directory called new_metric_util_map-1.
If we open the Jupyter notebook in that recipe and execute the code, we should see our new heatmap along with the three plots produced by the original version of the recipe. Here is an example:
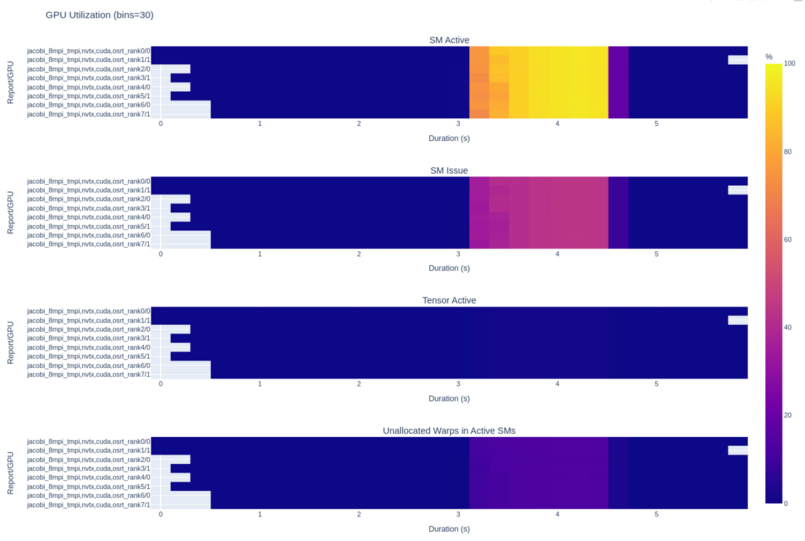
Import NVTXT
ImportNvtxt is an utility which allows conversion of a NVTXT file to a Nsight Systems report file (*.nsys-rep) or to merge it with an existing report file.
Note: NvtxtImport supports custom TimeBase values. Only these values are supported:
Manual — timestamps are set using absolute values.
Relative — timestamps are set using relative values with regards to report file which is being merged with nvtxt file.
ClockMonotonicRaw — timestamps values in nvtxt file are considered to be gathered on the same target as the report file which is to be merged with nvtxt using
clock_gettime(CLOCK_MONOTONIC_RAW, ...)call.CNTVCT — timestamps values in nvtxt file are considered to be gathered on the same target as the report file which is to be merged with nvtxt using CNTVCT values.
You can get usage info via help message:
Print help message:
-h [ --help ]
Show information about report file:
--cmd info -i [--input] arg
Create report file from existing nvtxt file:
--cmd create -n [--nvtxt] arg -o [--output] arg [-m [--mode] mode_name mode_args] [--target <Hw:Vm>] [--update_report_time]
Merge nvtxt file to existing report file:
--cmd merge -i [--input] arg -n [--nvtxt] arg -o [--output] arg [-m [--mode] mode_name mode_args] [--target <Hw:Vm>] [--update_report_time]
Modes description:
lerp - Insert with linear interpolation
--mode lerp --ns_a arg --ns_b arg [--nvtxt_a arg --nvtxt_b arg]
lin - insert with linear equation
--mode lin --ns_a arg --freq arg [--nvtxt_a arg]
Modes’ parameters:
ns_a- a nanoseconds valuens_b- a nanoseconds value (greater thanns_a)nvtxt_a- an nvtxt file’s time unit value corresponding tons_ananosecondsnvtxt_b- an nvtxt file’s time unit value corresponding tons_bnanosecondsfreq- the nvtxt file’s timer frequency--target <Hw:Vm>- specify target id, e.g.--target 0:1--update_report_time- prolong report’s profiling session time while merging if needed. Without this option all events outside the profiling session time window will be skipped during merging.
Commands
Info
To find out report’s start and end time use info command.
Usage:
ImportNvtxt --cmd info -i [--input] arg
Example:
ImportNvtxt info Report.nsys-rep
Analysis start (ns) 83501026500000
Analysis end (ns)   83506375000000
Create
You can create a report file using existing NVTXT with create command.
Usage:
ImportNvtxt --cmd create -n [--nvtxt] arg -o [--output] arg [-m [--mode] mode_name mode_args]
Available modes are:
lerp — insert with linear interpolation.
lin — insert with linear equation.
Usage for lerp mode is:
--mode lerp --ns_a arg --ns_b arg [--nvtxt_a arg --nvtxt_b arg]
with:
ns_a— a nanoseconds value.ns_b— a nanoseconds value (greater thanns_a).nvtxt_a— an nvtxt file’s time unit value corresponding tons_ananoseconds.nvtxt_b— an nvtxt file’s time unit value corresponding tons_bnanoseconds.
If nvtxt_a and nvtxt_b are not specified, they are respectively set to nvtxt file’s minimum and maximum time value.
Usage for lin mode is:
--mode lin --ns_a arg --freq arg [--nvtxt_a arg]
with:
ns_a— a nanoseconds value.freq— the nvtxt file’s timer frequency.nvtxt_a— an nvtxt file’s time unit value corresponding tons_ananoseconds.
If nvtxt_a is not specified, it is set to nvtxt file’s minimum time value.
Examples:
ImportNvtxt --cmd create -n Sample.nvtxt -o Report.nsys-rep
The output will be a new generated report file which can be opened and viewed by Nsight Systems.
Merge
To merge NVTXT file with an existing report file use merge command.
Usage:
ImportNvtxt --cmd merge -i [--input] arg -n [--nvtxt] arg -o [--output] arg [-m [--mode] mode_name mode_args]
Available modes are:
lerp — insert with linear interpolation.
lin — insert with linear equation.
Usage for lerp mode is:
--mode lerp --ns_a arg --ns_b arg [--nvtxt_a arg --nvtxt_b arg]
with:
ns_a— a nanoseconds value.ns_b— a nanoseconds value (greater thanns_a).nvtxt_a— an nvtxt file’s time unit value corresponding tons_ananoseconds.nvtxt_b— an nvtxt file’s time unit value corresponding tons_bnanoseconds.
If nvtxt_a and nvtxt_b are not specified, they are respectively set to nvtxt file’s minimum and maximum time value.
Usage for lin mode is:
--mode lin --ns_a arg --freq arg [--nvtxt_a arg]
with:
ns_a— a nanoseconds value.freq— the nvtxt file’s timer frequency.nvtxt_a— an nvtxt file’s time unit value corresponding tons_ananoseconds.
If nvtxt_a is not specified, it is set to nvtxt file’s minimum time value.
Time values in <filename.nvtxt> are assumed to be nanoseconds if no mode specified.
Example
ImportNvtxt --cmd merge -i Report.nsys-rep -n Sample.nvtxt -o NewReport.nsys-rep
Visual Studio Integration
NVIDIA Nsight Integration is a Visual Studio extension that allows you to access the power of Nsight Systems from within Visual Studio.
When Nsight Systems is installed along with NVIDIA Nsight Integration, Nsight Systems activities will appear under the NVIDIA Nsight menu in the Visual Studio menu bar. These activities launch Nsight Systems with the current project settings and executable.
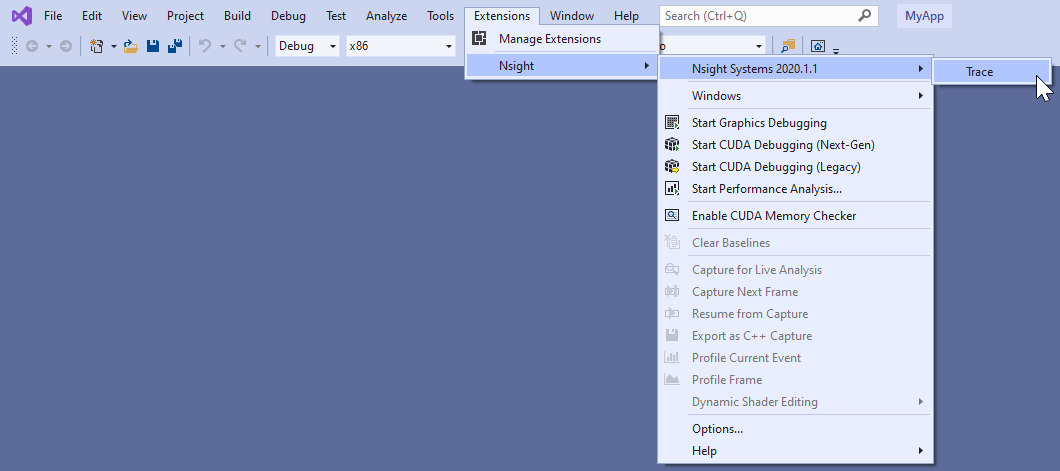
Selecting the “Trace” command will launch Nsight Systems, create a new Nsight Systems project and apply settings from the current Visual Studio project:
Target application path
Command line parameters
Working folder
If the “Trace” command has already been used with this Visual Studio project then Nsight Systems will load the respective Nsight Systems project and any previously captured trace sessions will be available for review using the Nsight Systems project explorer tree.
For more information about using Nsight Systems from within Visual Studio, please visit
Troubleshooting
General Troubleshooting
Profiling
If the profiler behaves unexpectedly during the profiling session, or the profiling session fails to start, try the following steps:
Close the host application.
Restart the target device.
Start the host application and connect to the target device.
Nsight Systems uses a settings file (NVIDIA Nsight Systems.ini) on the host to store information about loaded projects, report files, window layout configuration, etc. Location of the settings file is described in the Help → About dialog. Deleting the settings file will restore Nsight Systems to a fresh state, but all projects and reports will disappear from the Project Explorer.
Environment Variables
By default, Nsight Systems writes temporary files to /tmp directory. If you are using a system that does not allow writing to /tmp or where the /tmp directory has limited storage you can use the TMPDIR environment variable to set a different location. An example:
TMPDIR=/testdata ./bin/nsys profile -t cuda matrixMul
Environment variable control support for Windows target trace is not available, but there is a quick workaround:
Create a batch file that sets the env vars and launches your application.
Set Nsight Systems to launch the batch file as its target, i.e. set the project settings target path to the path of batch file.
Start the trace. Nsight Systems will launch the batch file in a new cmd instance and trace any child process it launches. In fact, it will trace the whole process tree whose root is the cmd running your batch file.
WebGL Testing
Nsight Systems cannot profile using the default Chrome launch command. To profile WebGL please follow the following command structure:
“C:\Program Files (x86)\Google\Chrome\Application\chrome.exe”
       --inprocess-gpu --no-sandbox --disable-gpu-watchdog --use-angle=gl
       https://webglsamples.org/aquarium/aquarium.html
Common Issues with QNX Targets
Make sure that
traceloggerutility is available and can be run on the target.Make sure that
/tmpdirectory is accessible and supports sub-directories.When switching between Nsight Systems versions, processes related to the previous version, including profiled applications forked by the daemon, must be killed before the new version is used. If you experience issues after switching between Nsight Systems versions, try rebooting the target.
CLI Troubleshooting
If you have collected a report file using the CLI and the report will not open in the GUI, check to see that your GUI version is the same or greater than the CLI version you used. If it is not, download a new version of the Nsight Systems GUI and you will be able to load and visualize your report.
This situation occurs most frequently when you update Nsight Systems using a CLI only package, such as the package available from the NVIDIA HPC SDK.
Launch Processes in Stopped State
In many cases, it is important to profile an application from the very beginning of its execution. When launching processes, Nsight Systems takes care of it by making sure that the profiling session is fully initialized before making the exec() system call on Linux.
If the process launch capabilities of Nsight Systems are not sufficient, the application should be launched manually, and the profiler should be configured to attach to the already launched process. One approach would be to call sleep() somewhere early in the application code, which would provide time for the user to attach to the process in Nsight Systems Embedded Platforms Edition, but there are two other more convenient mechanisms that can be used on Linux, without the need to recompile the application. (Note that the rest of this section is only applicable to Linux-based target devices.)
Both mechanisms ensure that between the time the process is created (and therefore its PID is known) and the time any of the application’s code is called, the process is stopped and waits for a signal to be delivered before continuing.
LD_PRELOAD
The first mechanism uses LD_PRELOAD environment variable. It only works with dynamically linked binaries, since static binaries do not invoke the runtime linker, and therefore are not affected by the LD_PRELOAD environment variable.
For ARMv7 binaries, preload
/opt/nvidia/nsight_systems/libLauncher32.so
Otherwise if running from host, preload
/opt/nvidia/nsight_systems/libLauncher64.so
Otherwise if running from CLI, preload
[installation_directory]/libLauncher64.so
The most common way to do that is to specify the environment variable as part of the process launch command, for example:
$ LD_PRELOAD=/opt/nvidia/nsight_systems/libLauncher64.so ./my-aarch64-binary --arguments
When loaded, this library will send itself a SIGSTOP signal, which is equivalent to typing Ctrl+Z in the terminal. The process is now a background job, and you can use standard commands like jobs, fg and bg to control them. Use jobs -l to see the PID of the launched process.
When attaching to a stopped process, Nsight Systems will send SIGCONT signal, which is equivalent to using the bg command.
Launcher
The second mechanism can be used with any binary. Use [installation_directory]/launcher to launch your application, for example:
$ /opt/nvidia/nsight_systems/launcher ./my-binary --arguments
The process will be launched, daemonized, and wait for SIGUSR1 signal. After attaching to the process with Nsight Systems, the user needs to manually resume execution of the process from command line:
$ pkill -USR1 launcher
Note
Note that pkill will send the signal to any process with the matching name. If that is not desirable, use kill to send it to a specific process. The standard output and error streams are redirected to /tmp/stdout_<PID>.txt and /tmp/stderr_<PID>.txt.
The launcher mechanism is more complex and less automated than the LD_PRELOAD option, but gives more control to the user.
GUI Troubleshooting
If opening the Nsight Systems Linux GUI fails with one of the following errors, you may be missing some required libraries:
This application failed to start because it could not find or load the Qt platform plugin "xcb" in "". Available platform plugins are: xcb. Reinstalling the application may fix this problem.
or
error while loading shared libraries: [library_name]: cannot open shared object file: No such file or directory
Ubuntu 18.04/20.04/22.04 and CentOS 7/8/9 with root privileges
Launch the following command, which will install all the required libraries in system directories:
[installation_path]/host-linux-[arch]/Scripts/DependenciesInstaller/install-dependencies.sh
Launch the Linux GUI as usual.
Ubuntu 18.04/20.04/22.04 and CentOS 7/8/9 without root privileges
Choose the directory where dependencies will be installed (
dependencies_path). This directory should be writeable for the current user.Launch the following command (if it has already been run, move to the next step), which will install all the required libraries in
[dependencies_path]:[installation_path]/host-linux-[arch]/Scripts/DependenciesInstaller/install-dependencies-without-root.sh [dependencies_path]
Further, use the following command to launch the Linux GUI:
source [installation_path]/host-linux-[arch]/Scripts/DependenciesInstaller/setup-dependencies-environment.sh [dependencies_path] && [installation_path]/host-linux-x64/nsys-ui
Other platforms, or if the previous steps did not help
Launch Nsight Systems using the following command line to determine which libraries are missing and install them.
$ QT_DEBUG_PLUGINS=1 ./nsys-ui
If the workload does not run when launched via Nsight Systems or the timeline is empty, check the stderr.log and stdout.log (click on drop-down menu showing Timeline View and click on Files) to see the errors encountered by the app.
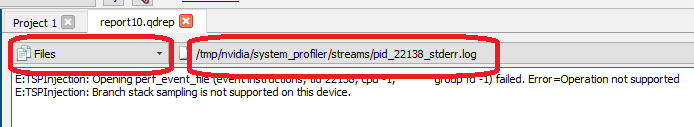
Symbol Resolution
If stack trace information is missing symbols and you have a symbol file, you can manually re-resolve using the ResolveSymbols utility. This can be done by right-clicking the report file in the Project Explorer window and selecting “Resolve Symbols…”.
Alternatively, you can find the utility as a separate executable in the [installation_path]\Host directory. This utility works with ELF format files, with Windows PDB directories and symbol servers, or with files where each line is in the format <start><length><name>.
Short |
Long |
Argument |
Description |
|---|---|---|---|
-h |
|
Help message providing information about available options. |
|
-l |
|
Print global process IDs list |
|
-s |
|
filename |
Path to symbol file |
-b |
|
address |
If set then <start> in symbol file is treated as relative address starting from this base address |
-p |
|
pid |
Which process in the report should be resolved. May be omitted if there is only one process in the report. |
-f |
|
This option forces use of a given symbol file. |
|
-i |
|
filename |
Path to the report with unresolved symbols. |
-o |
|
filename |
Path and name of the output file. If it is omitted then “resolved” suffix is added to the original filename. |
-d |
|
directory paths |
List of symbol folder paths, separated by semi-colon characters. Available only on Windows. |
-v |
|
server URLs |
List of symbol servers that uses the same format as |
-n |
|
Ignore the symbol locations stored in the |
Broken Backtraces on Tegra
In Nsight Systems Embedded Platforms Edition, in the symbols table there is a special entry called Broken backtraces. This entry is used to denote the point in the call chain where the unwinding algorithms used by Nsight Systems could not determine what is the next (caller) function.
Broken backtraces happen because there is no information related to the current function that the unwinding algorithms can use. In the Top-Down view, these functions are immediate children of the Broken backtraces row.
One can eliminate broken backtraces by modifying the build system to provide at least one kind of unwind information. The types of unwind information, used by the algorithms in Nsight Systems, include the following:
For ARMv7 binaries:
DWARF information in ELF sections:
.debug_frame,.zdebug_frame,.eh_frame,.eh_frame_hdr. This information is the most precise..zdebug_frameis a compressed version of.debug_frame, so at most one of them is typically present..eh_frame_hdris a companion section for.eh_frameand might be absent.Compiler flag:
-g.Exception handling information in EHABI format provided in
.ARM.exidxand.ARM.extabELF sections..ARM.extabmight be absent if all information is compact enough to be encoded into.ARM.exidx.Compiler flag:
-funwind-tables.Frame pointers (built into the
.textsection).Compiler flag:
-fno-omit-frame-pointer.
For Aarch64 binaries:
DWARF information in ELF sections:
.debug_frame,.zdebug_frame,.eh_frame,.eh_frame_hdr. See additional comments above.Compiler flag:
-g.Frame pointers (built into the
.textsection).Compiler flag:
-fno-omit-frame-pointer.
The following ELF sections should be considered empty if they have size of 4 bytes: .debug_frame, .eh_frame, .ARM.exidx. In this case, these sections only contain termination records and no useful information.
For GCC, use the following compiler invocation to see which compiler flags are enabled in your toolchain by default (for example, to check if -funwind-tables is enabled by default):
$ gcc -Q --help=common
For GCC and Clang, add -### to the compiler invocation command to see which compiler flags are actually being used.
Since EHABI and DWARF information is compiled on per-unit basis (every .cpp or .c file, as well as every static library, can be built with or without this information), presence of the ELF sections does not guarantee that every function has necessary unwind information.
Frame pointers are required by the Aarch64 Procedure Call Standard. Adding frame pointers slows down execution time, but in most cases the difference is negligible.
Debug Versions of ELF Files
Often, after a binary is built, especially if it is built with debug information (-g compiler flag), it gets stripped before deploying or installing. In this case, ELF sections that contain useful information, such as non-export function names or unwind information, can get stripped as well.
One solution is to deploy or install the original unstripped library instead of the stripped one, but in many cases this would be inconvenient. Nsight Systems can use missing information from alternative locations.
For target devices with Ubuntu, see Debug Symbol Packages. These packages typically install debug ELF files with /usr/lib/debug prefix. Nsight Systems can find debug libraries there, and if it matches the original library (e.g., the built-in BuildID is the same), it will be picked up and used to provide symbol names and unwind information.
Many packages have debug companions in the same repository and can be directly installed with APT (apt-get). Look for packages with the -dbg suffix. For other packages, refer to the Debug Symbol Packages wiki page on how to add the debs package repository. After setting up the repository and running apt-get update, look for packages with -dbgsym suffix.
To verify that a debug version of a library has been picked up and downloaded from the target device, look in the Module Summary section of Analysis Summary:
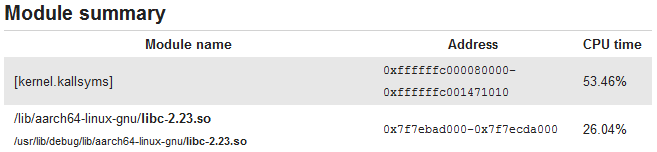
Logging
To enable logging on the host, refer to this config file:
host-linux-x64/nvlog.config.template
When reporting any bugs please include the build version number as described in the Help → About dialog. If possible, attach log files and report (.nsys-rep) files, as they already contain necessary version information.
Verbose Remote Logging on Linux Targets
Verbose logging is available when connecting to a Linux-based device from the GUI on the host. This extra debug information is not available when launching via the command line. Nsight Systems installs its executable and library files into the following directory:
/opt/nvidia/nsight_systems/
To enable verbose logging on the target device, when launched from the host, follow these steps:
Close the host application.
Restart the target device.
Place
nvlog.configfrom host directory to the/opt/nvidia/nsight_systemsdirectory on target.From SSH console, launch the following command:
sudo /opt/nvidia/nsight_systems/nsys --daemon --debug
Start the host application and connect to the target device.
Logs on the target devices are collected into this file (if enabled):
nsys.log
in the directory where nsys command was launched.
Please note that in some cases, debug logging can significantly slow down the profiler.
Verbose CLI Logging on Linux Targets
To enable verbose logging of the Nsight Systems CLI and the target application’s injection behavior:
In the target-linux-x64 directory, rename the nvlog.config.template file to nvlog.config.
Inside that file, change the line
$ }}{{{}nsys-ui.log
to
$ }}{{{}nsys-agent.log
Run a collection and the
target-linux.x64directory should include a file namednsys-agent.log.
Please note that in some cases, debug logging can significantly slow down the profiler.
Verbose Logging on Windows Targets
Verbose logging is available when connecting to a Windows-based device from the GUI on the host. Nsight Systems installs its executable and library files into the following directory by default:
C:\Program Files\NVIDIA Corporation\Nsight Systems 2023.3
To enable verbose logging on the target device, when launched from the host, follow these steps:
Close the host application.
Terminate the
nsysprocess.Place
nvlog.configfrom host directory next to Nsight Systems Windows agent on the target deviceLocal Windows target:
C:\Program Files\NVIDIA Corporation\Nsight Systems 2023.3\target-windows-x64
Remote Windows target:
C:\Users\<user name>\AppData\Local\Temp\nvidia\nsight_systems
Start the host application and connect to the target device.
Logs on the target devices are collected into this file (if enabled):
nsight-sys.log
in the same directory as Nsight Systems Windows agent.
Please note that in some cases debug logging can significantly slow down the profiler.
Other Resources
Looking for information to help you use Nsight Systems the most effectively? Here are some more resources you might want to review:
Training Seminars
NVIDIA Deep Learning Institute Training - Self-Paced Online Course Optimizing CUDA Machine Learning Codes With Nsight Profiling Tools
2018 NCSA Blue Waters Webinar - Video Only Introduction to NVIDIA Nsight Systems
Blog Posts
NVIDIA developer blogs, these are longer form, technical pieces written by tool and domain experts.
2021 - Optimizing DX12 Resource Uploads to the GPU Using CPU-Visible VRAM
2019 - Migrating to NVIDIA Nsight Tools from NVVP and nvprof
2019 - Transitioning to Nsight Systems from NVIDIA Visual Profiler / nvprof
2019 - TensorFlow Performance Logging Plugin nvtx-plugins-tf Goes Public
2020 - Understanding the Visualization of Overhead and Latency in Nsight Systems
2021 - Optimizing DX12 Resource Uploads to the GPU Using CPU-Visible VRAM
Feature Videos
Short videos, only a minute or two, to introduce new features.
Conference Presentations
GTC 2023 Optimizing at Scale: Investigating Hidden Bottlenecks for Multi-Node Workloads
GTC 2023 Ray-Tracing Development using NVIDIA Nsight Graphics and NVIDIA Nsight Systems
GTC 2022 - Optimizing Communication with Nsight Systems Network Profiling
GTC 2022 - Optimizing Vulkan 1.3 Applications with Nsight Graphics & Nsight Systems
GTC 2021 - Tuning GPU Network and Memory Usage in Apache Spark
GTC 2020 - Scaling the Transformer Model Implementation in PyTorch Across Multiple Nodes
GTC 2019 - Using Nsight Tools to Optimize the NAMD Molecular Dynamics Simulation Program
GTC 2018 - Optimizing HPC Simulation and Visualization Codes Using NVIDIA Nsight Systems
GTC 2018 - Israel - Boost DNN Training Performance using NVIDIA Tools
Siggraph 2018 - Taming the Beast; Using NVIDIA Tools to Unlock Hidden GPU Performance
For More Support
To file a bug report or to ask a question on the Nsight Systems forums, you will need to register with the NVIDIA Developer Program. See the FAQ. You do not need to register to read the forums.
After that, you can access Nsight Systems Forums and the NVIDIA Bug Tracking System.
To submit feedback directly from the GUI, go to Help->Send Feedback and fill out the form. Enter your email address if you would like to hear back from the Nsight Systems team.