

Getting Started with the CUDA Debugger#
Walkthrough: Launching and Debugging a CUDA Application#
In the following walkthrough, we present some of the more common procedures that you might use to debug a CUDA-based application. We use a sample application called Matrix Multiply as an example. The CUDA Toolkit CUDA Samples and the NVIDIA/cuda-samples repository on GitHub includes this sample application.
Open the Sample Project and Set Breakpoints#
From Visual Studio Code, open the directory from the CUDA Samples called matrixMul.
For assistance in locating sample applications, see Working with Samples.
Note
This file contains code for the CPU (i.e.
matrixMultiply()) and GPU (i.e.matrixMultiplyCUDA(), any function specified with a__global__or__device__keyword).First, let’s set some breakpoints in GPU code.
Open the file called
matrixMul.cu, and find the CUDA kernel functionmatrixMulCUDA().Set a breakpoint at:
int aStep = BLOCK_SIZE
Set another breakpoint at the statement that begins with:
for {int a = aBegin, b = bBegin;
Now, let’s set some breakpoints in CPU code:
In the same file,
matrixMul.cu, find the CPU functionmatrixMultiply().Set one breakpoint at:
if (block_size == 16)
Set another breakpoint at the statement that begins with:
printf("done\n");
Create a Launch Configuration#
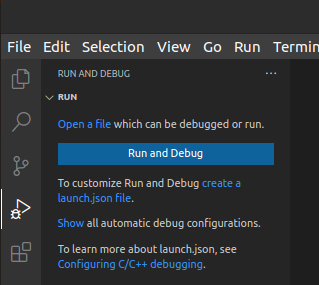
In order to debug our application we must first create a launch configuration. To create a launch.json first go to the Run and Debug tab and click create a launch.json file.
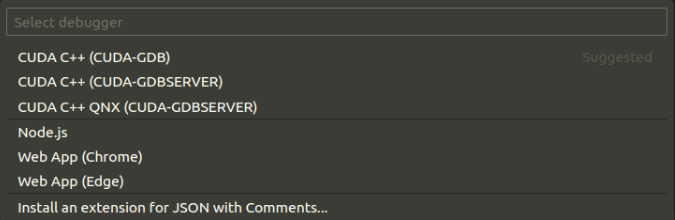
Select CUDA C++ (CUDA-GDB) for the environment.
Here is the launch configuration generated for CUDA debugging:
{
    "version": "0.2.0",
    "configurations": [
        {
            "name": "CUDA C++: Launch",
            "type": "cuda-gdb",
            "request": "launch",
            "program": ""
        }
    ]
}
In the launch.json change the program property to ${workspaceFolder}/build/matrixMul.
Note
${workspaceFolder} is a predefined variable that represents the path to the folder that is opened in VS Code.
Other attributes available for the launch configuration include:
debuggerPath: The path to cuda-gdb. If unspecified, the path will be searched for cuda-gdb.
args: Command-line arguments to pass to the debuggee.
initCommands: List of GDB commands sent before starting inferior.
breakOnLaunch: Break on the first instruction of every launched kernel.
onAPIError: Indicates the action to perform if a driver API or runtime API error occurs. Valid values are
hide,ignore, andstop.logFile: Can be set to ${workspaceFolder}/myLogFile.txt, for example, to enable logging in cuda-gdb for helping customer support root cause any encountered issues. Log files can be uploaded using the Nsight VSCE Developer Forum.
Build the Sample and Launch the Debugger#
In order to build our application, we must first create integrate our build system with a task. Go to the Command Palette and execute the Tasks: Configure Default Build Task command.
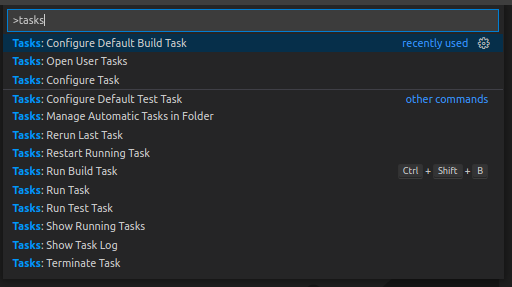
Here is the task configuration that is generated:
{
    "version": "2.0.0",
    "tasks": [
        {
            "label": "echo",
            "type": "shell",
            "command": "echo Hello",
            "problemMatcher": [],
            "group": {
                "kind": "build",
                "isDefault": true
            }
        }
    ]
}
Make the following changes to configure the task to build the matrixMul project for debugging:
Change the
commandproperty tocmake -B build -DCMAKE_BUILD_TYPE=Debug -DENABLE_CUDA_DEBUG=ON && cmake --build build. TheDebugbuild type generates unoptimized code with symbolic information, andENABLE_CUDA_DEBUGenables device-side debug symbols required by cuda-gdb.Add
"$nvcc"to theproblemMatcherarray. This will detect nvcc build errors and propagate them to the Visual Studio Code Problems panel.
To build the tasks go to the Command Palette again and run the Tasks: Run Build Task task. View the Problems and Terminal panels for error messages.
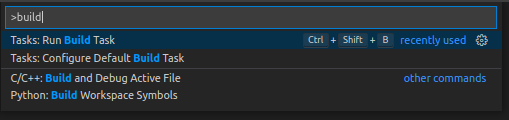
To start debugging either go to the Run and Debug tab and click the Start Debugging button or simply press F5.
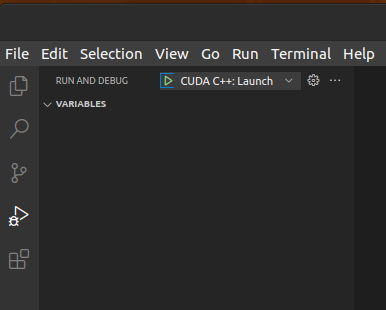
You’ve started the debugging session. In the Control GPU Execution and Inspect State topics we’ll look at some of the tools you typically use during a debugging session.
Walkthrough: Debugging a Running CUDA Application Using Attach#
In this walkthrough, we will attach to, and debug a running CUDA-based application. As with the last walkthrough, we will use Matrix Multiply as our application. The CUDA Toolkit CUDA Samples and the NVIDIA/cuda-samples repository on GitHub includes this sample application.
Open the Sample Project, Make a Small Edit, and Set Breakpoints#
From Visual Studio Code, open the directory from the CUDA Samples called matrixMul.
For assistance in locating sample applications, see Working with Samples.
Note
This file contains code for the CPU (i.e.
matrixMultiply()) and GPU (i.e.matrixMultiplyCUDA(), any function specified with a__global__or__device__keyword).Add
sleep(100);after the firstprintfof themain()entry point. This will effectively pause the program, so that we can attach to the running process.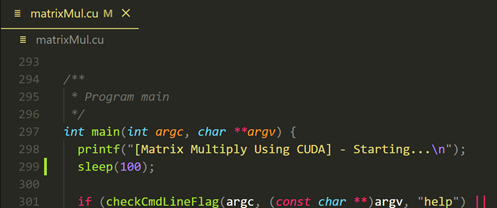
Then we set some breakpoints, just like in the launch walkthrough. First, in the GPU code.
Open the file called
matrixMul.cu, and find the CUDA kernel functionmatrixMulCUDA().Set a breakpoint at:
int aStep = BLOCK_SIZE
Set another breakpoint at the statement that begins with:
for {int a = aBegin, b = bBegin;
Followed by setting some breakpoints in CPU code:
In the same file,
matrixMul.cu, find the CPU functionmatrixMultiply().Set one breakpoint at:
if (block_size == 16)
Set another breakpoint at the statement that begins with:
printf("done\n");
Create a Launch Configuration to Attach to a Running Process#
In order to debug our application we must first create a launch configuration. To create a launch.json first go to the Run and Debug tab and click create a launch.json file.
Select CUDA C++ (CUDA-GDB) for the environment.
Here is the launch configuration generated for CUDA debugging:
{
    "version": "0.2.0",
    "configurations": [
        {
            "name": "CUDA C++: Attach",
            "type": "cuda-gdb",
            "request": "attach",
            "processId": "${command:cuda.pickProcess}"
        }
    ]
}
Note
${command:cuda.pickProcess} is a predefined variable that represents the function that opens the processPicker to select the process to choose from in VS Code.
Other attributes available for the launch configuration include:
debuggerPath: The path to cuda-gdb. If unspecified, the path will be searched for cuda-gdb.
args: Command-line arguments to pass to the debuggee.
initCommands: List of GDB commands sent before starting inferior.
breakOnLaunch: Break on the first instruction of every launched kernel.
onAPIError: Indicates the action to perform if a driver API or runtime API error occurs. Valid values are
hide,ignore, andstop.logFile: Can be set to ${workspaceFolder}/myLogFile.txt, for example, to enable logging in cuda-gdb for helping customer support root cause any encountered issues. Log files can be uploaded using the Nsight VSCE Developer Forum.
Build the Sample#
In order to build our application, we must first create integrate our build system with a task. Go to the Command Palette and execute the Tasks: Configure Default Build Task command.
Here is the task configuration that is generated:
{
    "version": "2.0.0",
    "tasks": [
        {
            "label": "echo",
            "type": "shell",
            "command": "echo Hello",
            "problemMatcher": [],
            "group": {
                "kind": "build",
                "isDefault": true
            }
        }
    ]
}
Make the following changes to configure the task to build the matrixMul project for debugging:
Change the
commandproperty tocmake -B build -DCMAKE_BUILD_TYPE=Debug -DENABLE_CUDA_DEBUG=ON && cmake --build build. TheDebugbuild type generates unoptimized code with symbolic information, andENABLE_CUDA_DEBUGenables device-side debug symbols required by cuda-gdb.Add
"$nvcc"to theproblemMatcherarray. This will detect nvcc build errors and propagate them to the Visual Studio Code Problems panel.
To build the tasks go to the Command Palette again and run the Tasks: Run Build Task task. View the Problems and Terminal panels for error messages.
Launch the Application#
Start matrixMul in the background by running ./build/matrixMul & on the terminal in the matrixMul folder.
Launch the Debugger and Attach to the Running Application#
Before the sleep(100) expires, launch the debugger to attach to the program.
To start debugging either go to the Run and Debug tab and click the Start Debugging button or simply press F5.
A process picker will appear. Choose matrixMul to begin your debugging session.

Once the sleep(100) expires, your code execution will stop at the first instruction executed after the sleep(100) at which you had a breakpoint. You can step, press F5 to continue, or press SHIFT-F5 to detach and allow the application to run freely.
Once, the application terminates, remove the first breakpoint you hit and repeat process to find that you can hit other breakpoints.
In the Control GPU Execution and Inspect State topics we’ll look at some of the tools you typically use during a debugging session.
Walkthrough: Launching and Debugging a remote application using cuda-gdbserver#
In the following walkthrough, we present some of the more common procedures that you might use to debug a CUDA-based application on a remote target machine. We use a sample application called Matrix Multiply as an example. The CUDA Toolkit CUDA Samples and the NVIDIA/cuda-samples repository on GitHub includes this sample application.
Open the Sample Project and Set Breakpoints#
On the local machine,
From Visual Studio Code, open the directory from the CUDA Samples called matrixMul.
For assistance in locating sample applications, see Working with Samples.
Note
This file contains code for the CPU (i.e.
matrixMultiply()) and GPU (i.e.matrixMultiplyCUDA(), any function specified with a__global__or__device__keyword).First, let’s set some breakpoints in GPU code.
Open the file called
matrixMul.cu, and find the CUDA kernel functionmatrixMulCUDA().Set a breakpoint at:
int aStep = BLOCK_SIZE
Set another breakpoint at the statement that begins with:
for {int a = aBegin, b = bBegin;
Now, let’s set some breakpoints in CPU code:
In the same file,
matrixMul.cu, find the CPU functionmatrixMultiply().Set one breakpoint at:
if (block_size == 16)
Set another breakpoint at the statement that begins with:
printf("done\n");
Create a Launch Configuration#
In order to debug our application we must first create a launch configuration. To create a launch.json first go to the Run and Debug tab and click create a launch.json file.
Select CUDA C++ (CUDA-GDBSERVER) for the environment.
Here is the launch configuration generated for CUDA debugging:
{
    "version": "0.2.0",
    "configurations": [
        {
            "name": "CUDA GDB Server: Launch",
            "type": "cuda-gdbserver",
            "request": "launch",
            "server": "cuda-gdbserver",
            "program": "",
            "target": {
                "host": "localhost",
                "port": "2345"
            },
            "sysroot": "",
            "debuggerPath": ""
        }
    ]
}
In the launch.json,
change the
programproperty to${workspaceFolder}/build/matrixMul, andset the target properties (host and port) to the host and port of the cuda-gdbserver you would be running.
Note
${workspaceFolder} is a predefined variable that represents the path to the folder that is opened in VS Code.
Other attributes available for the launch configuration include:
additionalSOLibSearchPath: The directory where the debugger searches for shared libraries.
args: Command-line arguments to pass to the debuggee.
autostart: Auto-start configuration for cuda-gdbserver. When set, the extension starts cuda-gdbserver automatically; see the next section. Modes:
local,linux-remote, andlinux-remote-upload.server: Path to the cuda-gdbserver executable or command name. Defaults to
cuda-gdbserver.breakOnLaunch: Break on the first instruction of every launched kernel.
cwd: The current working directory (cwd) for the debuggee process.
debuggerPath: The path to cuda-gdb. If unspecified, the path will be searched for cuda-gdb.
environment: Array containing objects that specify environment variables.
envFile: Absolute path to a file containing VAR=VALUE lines to specify environment variables.
initCommands: List of GDB commands sent before starting inferior.
logFile: Absolute path to the file to log interaction with cuda-gdb. Can be set to ${workspaceFolder}/myLogFile.txt, for example, to enable logging in cuda-gdb for helping customer support root cause any encountered issues. Log files can be uploaded using the Nsight VSCE Developer Forum.
onAPIError: Indicates the action to perform if a driver API or runtime API error occurs. Valid values are
hide,ignore, andstop.program: Path to the program to debug.
stopAtEntry: Break on the first instruction of the debuggee.
sysroot: Local directory with copies of target libraries.
Target:
Host: Target host to connect to.
Port: Target port to connect to.
Connect commands: Commands to run.
verboseLogging: Set to true to produce verbose log output.
Build the Sample#
In order to build our application, we must first create integrate our build system with a task. Go to the Command Palette and execute the Tasks: Configure Default Build Task command.
Here is the task configuration that is generated:
{
    "version": "2.0.0",
    "tasks": [
        {
            "label": "echo",
            "type": "shell",
            "command": "echo Hello",
            "problemMatcher": [],
            "group": {
                "kind": "build",
                "isDefault": true
            }
        }
    ]
}
Make the following changes to configure the task to build the matrixMul project for debugging:
Change the
commandproperty tocmake -B build -DCMAKE_BUILD_TYPE=Debug -DENABLE_CUDA_DEBUG=ON && cmake --build build. TheDebugbuild type generates unoptimized code with symbolic information, andENABLE_CUDA_DEBUGenables device-side debug symbols required by cuda-gdb.Add
"$nvcc"to theproblemMatcherarray. This will detect nvcc build errors and propagate them to the Visual Studio Code Problems panel.
To build the tasks go to the Command Palette again and run the Tasks: Run Build Task task. View the Problems and Terminal panels for error messages.
Start cuda-gdbserver on the remote machine#
After the sample has been built, the extension can start cuda-gdbserver for you. Add the autostart property to the launch configuration. Three modes are available:
local: starts cuda-gdbserver on the local machine. Use this when the GPU and the debugger are on the same machine but you want to use the cuda-gdbserver code path, for example to match a remote deployment or to exercise server-based scripting locally.linux-remote: starts cuda-gdbserver on a remote Linux machine over SSH. The debuggee executable must already be on the target; setautostart.remoteExecutableto its remote path.linux-remote-upload: starts cuda-gdbserver on a remote Linux machine and uploads the debuggee executable to the target’sTMPDIR(fallback:/tmp). Every debug session syncs the executable withrsync(transferring only when it changed; falls back to SFTP if rsync is unavailable).
Here is a launch configuration that uploads the debuggee and starts cuda-gdbserver on the remote machine. Add it to the configurations array in your launch.json:
{
    "name": "CUDA GDB Server: Auto-start (Remote + Upload)",
    "type": "cuda-gdbserver",
    "request": "launch",
    "autostart": {
        "mode": "linux-remote-upload",
        "sshUsername": "",
        "sshKeyPath": ""
    },
    "program": "${workspaceFolder}/build/matrixMul",
    "target": {
        "host": "remote-host",
        "port": "2345",
        "server": "cuda-gdbserver"
    }
}
For linux-remote mode, additionally set autostart.remoteExecutable to the path of the executable on the target.
The SSH-related properties are optional. If they are omitted, the extension uses values from your SSH configuration when available, otherwise it uses the local username, port 22, and a default SSH key. If no key is available, the extension prompts for a password; encrypted keys trigger a passphrase prompt.
To start debugging either
go to the
Run and Debugtab and click theStart Debuggingbutton, orsimply press
F5.
The extension starts cuda-gdbserver, connects the debugger to it, and stops at your breakpoints.
Note
You can still start cuda-gdbserver manually on the target (for example, cuda-gdbserver remote-host:2345 /tmp/matrixMul) and omit the autostart property; the debugger then connects to the already-running server specified by target.
Walkthrough: Launching and Debugging a remote application running on a QNX host using cuda-gdbserver#
In the following walkthrough, we present some of the more common procedures that you might use to debug a CUDA-based application on a remote target machine, running QNX. We use a sample application called Matrix Multiply as an example. The CUDA Toolkit CUDA Samples and the NVIDIA/cuda-samples repository on GitHub includes this sample application.
For information on what version of samples are supported on DriveOS QNX please see NVIDIA DRIVE Documentation.
Open the Sample Project and Set Breakpoints#
On the local machine,
From Visual Studio Code, open the directory from the CUDA Samples called matrixMul.
For assistance in locating sample applications, see Working with Samples.
Note
This file contains code for the CPU (i.e.
matrixMultiply()) and GPU (i.e.matrixMultiplyCUDA(), any function specified with a__global__or__device__keyword).First, let’s set some breakpoints in GPU code.
Open the file called
matrixMul.cu, and find the CUDA kernel functionmatrixMulCUDA().Set a breakpoint at:
int aStep = BLOCK_SIZE
Set another breakpoint at the statement that begins with:
for {int a = aBegin, b = bBegin;
Now, let’s set some breakpoints in CPU code:
In the same file,
matrixMul.cu, find the CPU functionmatrixMultiply().Set one breakpoint at:
if (block_size == 16)
Set another breakpoint at the statement that begins with:
printf("done\n");
Create a Launch Configuration#
In order to debug our application we must first create a launch configuration. To create a launch.json first go to the Run and Debug tab and click create a launch.json file.
Select CUDA C++ QNX (CUDA-GDBSERVER) for the environment.
Here is the launch configuration generated for CUDA debugging:
{
    "version": "0.2.0",
    "configurations": [
        {
            "name": "CUDA QNX GDB Server: Launch",
            "type": "cuda-qnx-gdbserver",
            "request": "launch",
            "program": "${workspaceFolder}/a.out",
            "executableUploadPath": "/path/to/debuggee/on/target",
            "target": {
                "host": "qnx-target-host",
                "port": "2346"
            },
            "sysroot": "/path/to/qnx-sysroot",
            "debuggerPath": ""
        }
    ]
}
In the launch.json,
change the
programproperty to the path of the executable to debug,set
executableUploadPathto the destination path on the QNX target where CUDA-GDB will place the debuggee executable,set the target properties (host and port) to the host and port of the cuda-gdbserver running on the QNX target,
set
sysrootto the path of the QNX sysroot on the host, andset
debuggerPathto be the path to cuda-qnx-gdb on the host system.
Note
${workspaceFolder} is a predefined variable that represents the path to the folder that is opened in VS Code.
Other attributes available for the launch configuration include:
additionalSOLibSearchPath: The directory where the debugger searches for shared libraries.
args: Command-line arguments to pass to the debuggee.
autostart: Auto-start configuration for cuda-gdbserver on the QNX target. When set, the extension starts cuda-gdbserver automatically; see the next section. Modes:
qnx-remoteandqnx-remote-upload.executableUploadPath: Destination path on the QNX target where CUDA-GDB uploads the debuggee executable each debug session.
breakOnLaunch: Break on the first instruction of every launched kernel.
cwd: The current working directory (cwd) for the debuggee process.
debuggerPath: The path to cuda-qnx-gdb. If unspecified, the path will be searched for cuda-qnx-gdb.
environment: Array containing objects that specify environment variables.
envFile: Absolute path to a file containing VAR=VALUE lines to specify environment variables.
initCommands: List of GDB commands sent before starting inferior.
logFile: Absolute path to the file to log interaction with cuda-qnx-gdb. Can be set to ${workspaceFolder}/myLogFile.txt, for example, to enable logging in cuda-qnx-gdb for helping customer support root cause any encountered issues. Log files can be uploaded using the Nsight VSCE Developer Forum.
onAPIError: Indicates the action to perform if a driver API or runtime API error occurs. Valid values are
hide,ignore, andstop.program: Path to the program to debug.
stopAtEntry: Break on the first instruction of the debuggee.
sysroot: Local directory with copies of target libraries.
Target:
Host: Target host to connect to.
Port: Target port to connect to.
Server: Path to cuda-gdbserver on the QNX target. Required for
qnx-remotemode (where the server is already present); not needed forqnx-remote-upload(the extension derives the path from the upload location). Defaults tocuda-gdbserver.Connect commands: Commands to run.
verboseLogging: Set to true to produce verbose log output.
Build the Sample#
Cross compile the sample using instructions from https://developer.nvidia.com/docs/drive/drive-os/6.0.6/public/drive-os-qnx-installation/common/topics/installation/build-samples/build-run-sample-apps-qnx.html
Start cuda-gdbserver on the QNX target#
After the sample has been built, the extension can start cuda-gdbserver on the QNX target for you. Add the autostart property to the launch configuration. Two modes are available:
qnx-remote: starts cuda-gdbserver already present on the QNX target. CUDA-GDB uploads the debuggee executable to the directory specified byremoteUploadPath(default:TMPDIR, fallback/tmp) every debug session.qnx-remote-upload: uploads a QNX-compatible cuda-gdbserver binary from the host machine to the target and starts it there. Setautostart.localCudaGdbServerPathto the local path of the binary. Every debug session syncs the binary withrsync(transferring only when it changed; falls back to SFTP if rsync is unavailable). CUDA-GDB also uploads the debuggee executable every debug session.
Note
Unlike the Linux linux-remote mode (where the debuggee must already be on the target), both QNX modes have CUDA-GDB upload the debuggee executable automatically. The -upload suffix in qnx-remote-upload refers to uploading the cuda-gdbserver binary, not the debuggee.
Here is a launch configuration that starts a cuda-gdbserver already present on the QNX target:
{
    "name": "CUDA QNX GDB Server: Auto-start (Remote)",
    "type": "cuda-qnx-gdbserver",
    "request": "launch",
    "autostart": {
        "mode": "qnx-remote",
        "sshUsername": "",
        "sshKeyPath": "",
        "remoteUploadPath": "/storage"
    },
    "program": "${workspaceFolder}/build/matrixMul",
    "target": {
        "host": "qnx-target-host",
        "port": "2346",
        "server": "path/to/cuda-gdbserver"
    },
    "sysroot": "/path/to/qnx-sysroot",
    "debuggerPath": "/path/to/cuda-qnx-gdb"
}
For qnx-remote-upload mode, replace the autostart value with:
"autostart": {
    "mode": "qnx-remote-upload",
    "localCudaGdbServerPath": "/path/to/qnx-cuda-gdbserver",
    "remoteUploadPath": "/storage"
}
Additional autostart properties for QNX:
remoteUploadPath: remote directory on the QNX target where files are uploaded and cuda-gdbserver runs. If not specified, the target’s
TMPDIRis used, with fallback to/tmp.serverEnvironment: environment variables (array of
name/valueobjects) to set in the shell when starting cuda-gdbserver on the target.
The SSH-related properties are optional. If they are omitted, the extension uses values from your SSH configuration when available, otherwise it uses the local username, port 22, and a default SSH key. If no key is available, the extension prompts for a password; encrypted keys trigger a passphrase prompt.
To start debugging either
go to the
Run and Debugtab and click theStart Debuggingbutton, orsimply press
F5.
Note
You can still start cuda-gdbserver manually on the QNX target and omit the autostart property; the debugger then connects to the already-running server specified by target.
Notices
Notice
NVIDIA® Nsight™ Application Development Environment for Heterogeneous Platforms, Visual Studio Code Edition 2026.1.0 User Guide
THE INFORMATION IN THIS GUIDE AND ALL OTHER INFORMATION CONTAINED IN NVIDIA DOCUMENTATION REFERENCED IN THIS GUIDE IS PROVIDED “AS IS.” NVIDIA MAKES NO WARRANTIES, EXPRESSED, IMPLIED, STATUTORY, OR OTHERWISE WITH RESPECT TO THE INFORMATION FOR THE PRODUCT, AND EXPRESSLY DISCLAIMS ALL IMPLIED WARRANTIES OF NONINFRINGEMENT, MERCHANTABILITY, AND FITNESS FOR A PARTICULAR PURPOSE. Notwithstanding any damages that customer might incur for any reason whatsoever, NVIDIA’s aggregate and cumulative liability towards customer for the product described in this guide shall be limited in accordance with the NVIDIA terms and conditions of sale for the product.
THE NVIDIA PRODUCT DESCRIBED IN THIS GUIDE IS NOT FAULT TOLERANT AND IS NOT DESIGNED, MANUFACTURED OR INTENDED FOR USE IN CONNECTION WITH THE DESIGN, CONSTRUCTION, MAINTENANCE, AND/OR OPERATION OF ANY SYSTEM WHERE THE USE OR A FAILURE OF SUCH SYSTEM COULD RESULT IN A SITUATION THAT THREATENS THE SAFETY OF HUMAN LIFE OR SEVERE PHYSICAL HARM OR PROPERTY DAMAGE (INCLUDING, FOR EXAMPLE, USE IN CONNECTION WITH ANY NUCLEAR, AVIONICS, LIFE SUPPORT OR OTHER LIFE CRITICAL APPLICATION). NVIDIA EXPRESSLY DISCLAIMS ANY EXPRESS OR IMPLIED WARRANTY OF FITNESS FOR SUCH HIGH RISK USES. NVIDIA SHALL NOT BE LIABLE TO CUSTOMER OR ANY THIRD PARTY, IN WHOLE OR IN PART, FOR ANY CLAIMS OR DAMAGES ARISING FROM SUCH HIGH RISK USES.
NVIDIA makes no representation or warranty that the product described in this guide will be suitable for any specified use without further testing or modification. Testing of all parameters of each product is not necessarily performed by NVIDIA. It is customer’s sole responsibility to ensure the product is suitable and fit for the application planned by customer and to do the necessary testing for the application in order to avoid a default of the application or the product. Weaknesses in customer’s product designs may affect the quality and reliability of the NVIDIA product and may result in additional or different conditions and/or requirements beyond those contained in this guide. NVIDIA does not accept any liability related to any default, damage, costs or problem which may be based on or attributable to: (i) the use of the NVIDIA product in any manner that is contrary to this guide, or (ii) customer product designs.
Other than the right for customer to use the information in this guide with the product, no other license, either expressed or implied, is hereby granted by NVIDIA under this guide. Reproduction of information in this guide is permissible only if reproduction is approved by NVIDIA in writing, is reproduced without alteration, and is accompanied by all associated conditions, limitations, and notices.
Trademarks
NVIDIA, the NVIDIA logo, and cuBLAS, CUDA, CUDA-GDB, CUDA-MEMCHECK, cuDNN, cuFFT, cuSPARSE, DIGITS, DGX, DGX-1, DGX Station, NVIDIA DRIVE, NVIDIA DRIVE AGX, NVIDIA DRIVE Software, NVIDIA DRIVE OS, NVIDIA Developer Zone (aka “DevZone”), GRID, Jetson, NVIDIA Jetson Nano, NVIDIA Jetson AGX Xavier, NVIDIA Jetson TX2, NVIDIA Jetson TX2i, NVIDIA Jetson TX1, NVIDIA Jetson TK1, Kepler, NGX, NVIDIA GPU Cloud, Maxwell, Multimedia API, NCCL, NVIDIA Nsight Compute, NVIDIA Nsight Eclipse Edition, NVIDIA Nsight Graphics, NVIDIA Nsight Integration, NVIDIA Nsight Systems, NVIDIA Nsight Visual Studio Edition, NVIDIA Nsight Visual Studio Code Edition, NVLink, nvprof, Pascal, NVIDIA SDK Manager, Tegra, TensorRT, Tesla, Visual Profiler, VisionWorks and Volta are trademarks and/or registered trademarks of NVIDIA Corporation in the United States and other countries. Other company and product names may be trademarks of the respective companies with which they are associated.