1. Other Analysis Reports
Learn about other analysis reports in the following sections:
OpenCL support in NVIDIA Nsight Visual Studio Edition has been deprecated and will be removed in a future release.
2. The Summary Report
The Summary Report is a synopsis of the data recorded during a single capture session. It contains data about the capture itself, such as the duration of the capture. It also contains a summary of the domain-specific data. For example, if you were analyzing a DirectX application, the Summary Report would contain a section specifically on the DirectX data collected. The Summary Report also contains a Session Overview, and links to more detailed reports.
2.1. Session Overview
The Session Overview section of the Summary Report contains an overview of the capture that was performed, and includes hyperlinks to more detailed information on other report pages. This shows the very basic information about the capture, such as the target application, the capture duration, date, command line parameters, and any other variables.
The header of each section includes direct links to all available reports for this domain. For example, you can directly jump to the timeline with a single click from the top of page.
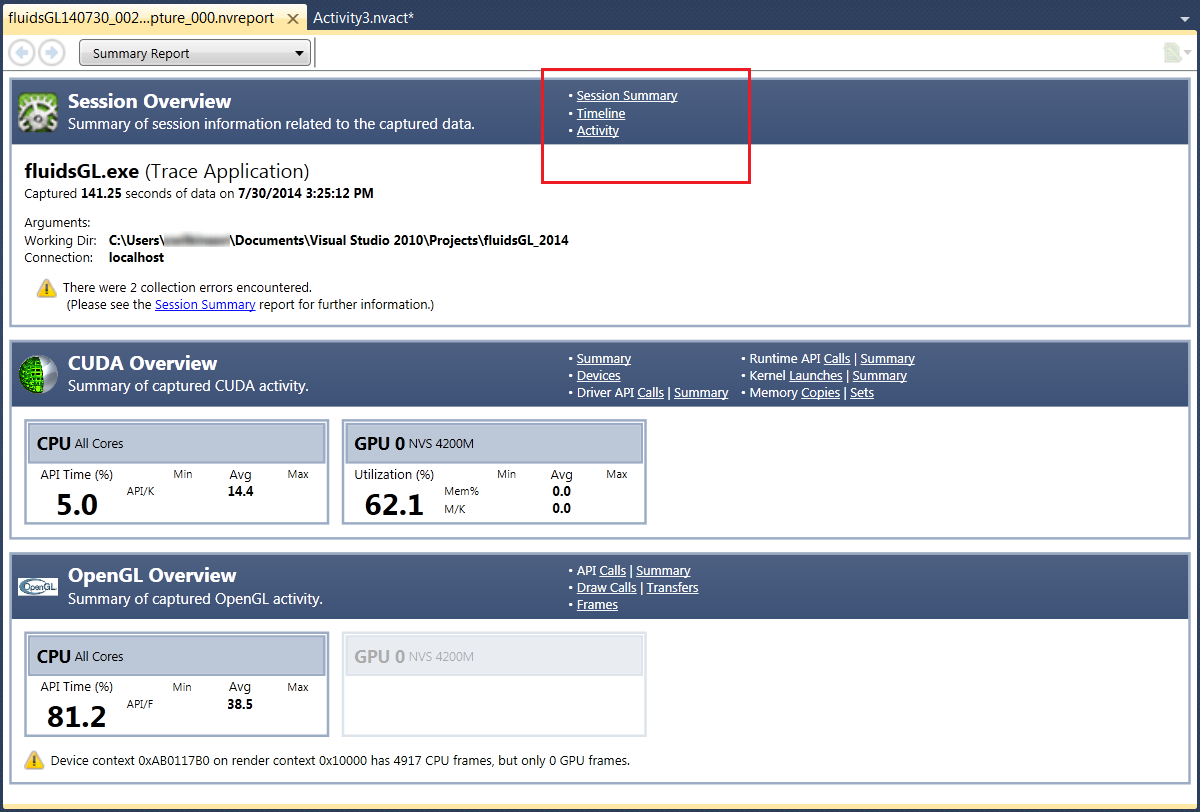
This screen will display a warning message, if something went wrong during data capture or loading the report file.
2.2. Process Overview
If the analysis activity you have selected is either a System Trace or System Profile, the Summary Report will also display a section called the Process Overview in between the Session Overview and domain-specific overviews. The Process Overview displays a summary of process information related to the data that has been captured.
2.3. Domain-Specific Overview
On the Summary Report, below the Session Overview and Process Overview sections, are the domain-specific overviews. Depending on the analysis activity that you select, these could be one or more of the following:
-
CUDA Overview (as displayed above)
-
OpenCL Overview
-
DirectX Overview
-
OpenGL Overview
This overview section displays information for both CPU and GPU activity. In the CPU summary section, the overall percentage displayed represents how much time is spent executing an API call, in respect to the overall capture time.
In the GPU summary section, the utilization percentage shown represents how often the GPU was utilized, in respect to the overall capture time.
As with the Session Overview, a warning message will be displayed at the bottom of this section if any errors occur.
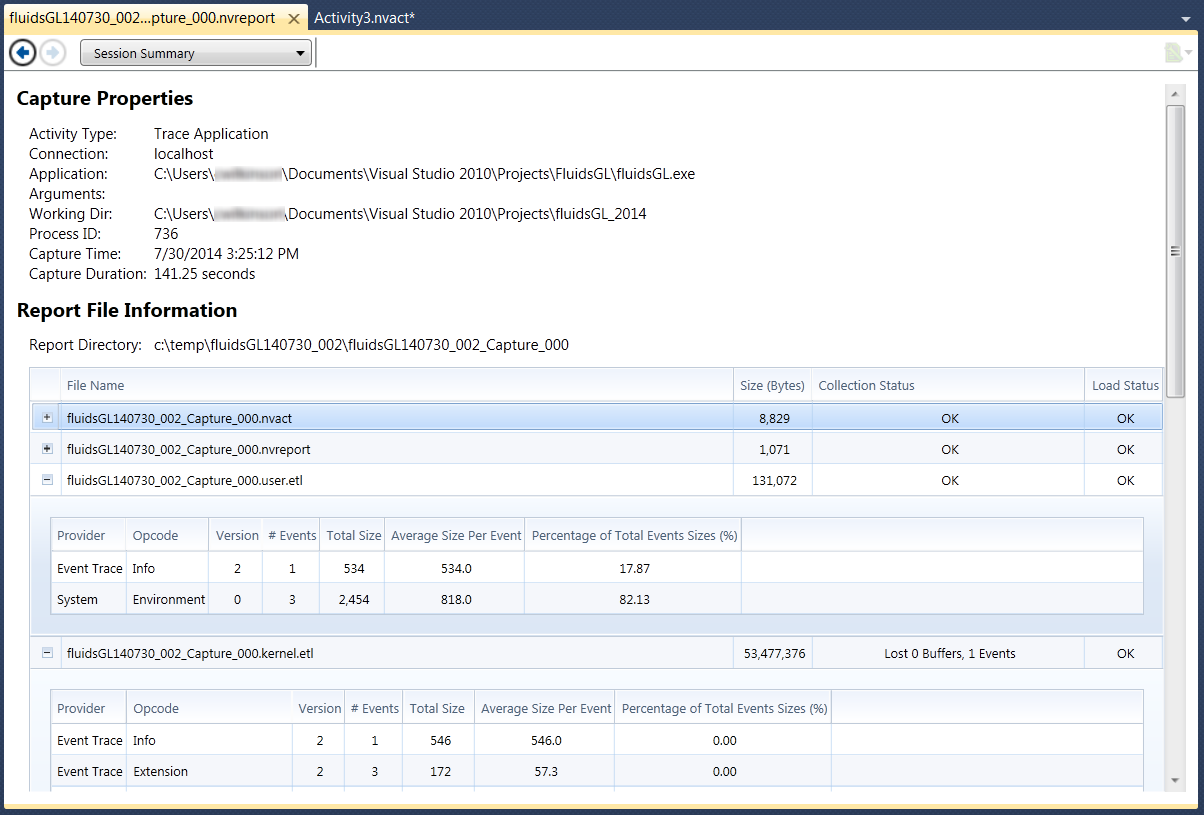
2.4. Session Summary
The Session Summary portion of the Summary Report shows a high-level summary of the capture session.
3. Timeline Page
The Timeline page shows domain-specific events (CUDA events, DirectX events, OpenCL ![]() events) and system events visually along a timeline that corresponds to the duration of an analysis session (capture).
events) and system events visually along a timeline that corresponds to the duration of an analysis session (capture).
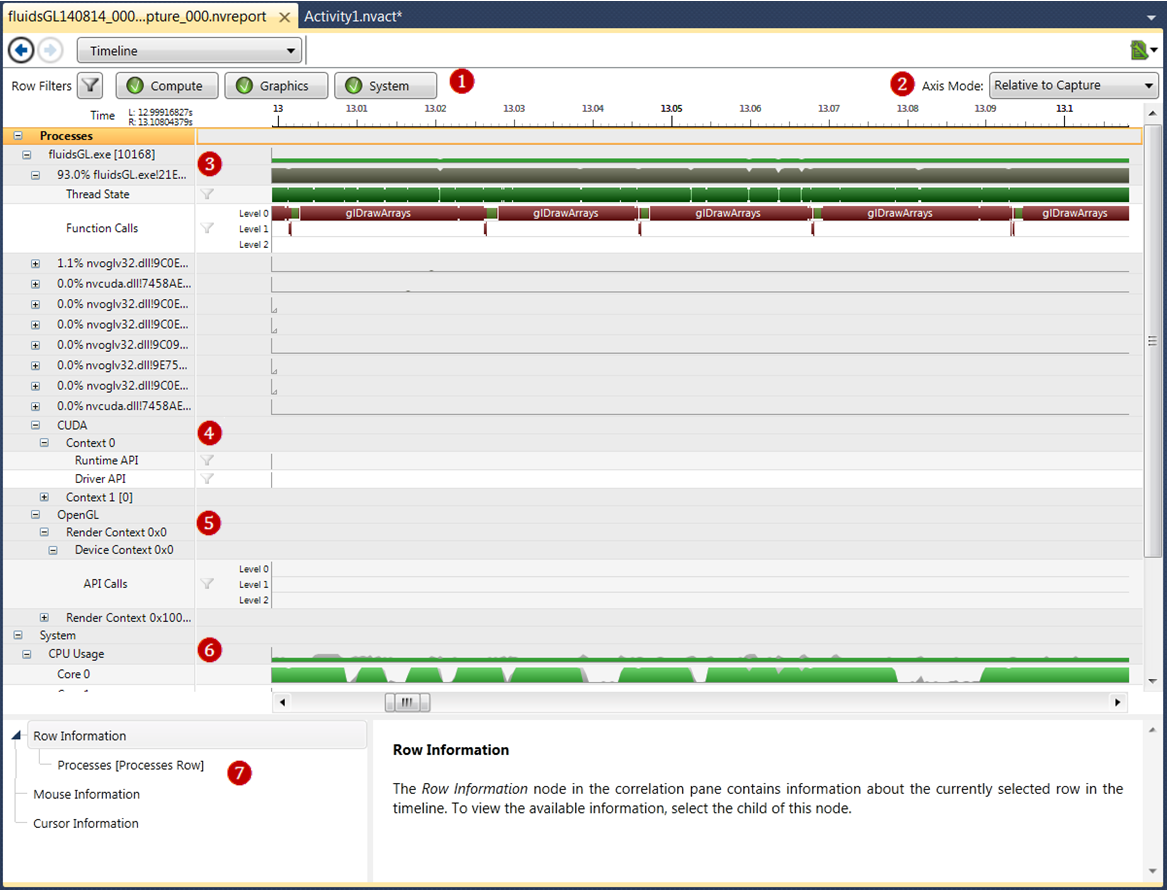
The Timeline page can be broken down into several key elements, detailed below:
3.1. Filters
 At the top of the timeline report page, you can select if you want to view analysis results on Compute, Graphics, or System.
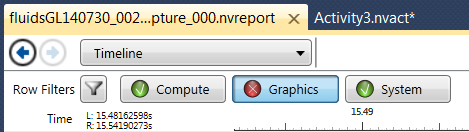
The ones that are displayed on the timeline report are green, the options that have been de-selected are shown in red.
Filtering data in a row
-
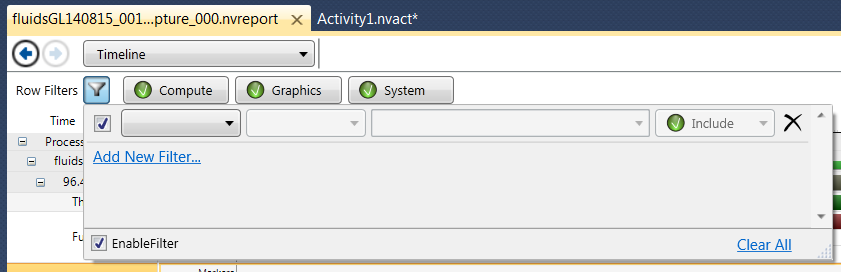
Click the <filter> icon for a row, and the Add Filter menu becomes visible. Filters make visualization and analysis simpler by limiting the data displayed on a row to the specific sets of events that match the filter or filters on the row.
-
Click the Add New Filter... link to create a new filter term.
-
A new blank filter is created in the same menu. Configure the filter by selecting data for each combo box / text field.
-
A filter consists of four (4) pieces of data, each of which has its own combo box or text field: the field name, the comparison operator, the comparison expression, and the include/exclude flag.
-
The field name is context sensitive: Different rows will have different sets of fields available to use as filter inputs depending on the type of data the row is displaying. Most rows have filters for fields and durations.
-
The comparison operator is the comparison operation that will be evaluated between data displayed in the row and the comparison expression. Operators available are dependent on the type of the field name current selected. Common operators include <, >, = for numerical fields and Contains and DoesNotContain for string fields.
-
The comparison expression is the expression against which the field selected will be compared.
-
The include/exclude flag controls whether the row includes or excludes items which match the filter.
-
3.2. Axis Mode
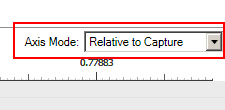
 There are three axis modes to view the rendering of the timeline report. You can change the axis mode at runtime through
a drop-down menu on the far upper-right corner of the timeline report page.
There are three axis modes to view the rendering of the timeline report. You can change the axis mode at runtime through
a drop-down menu on the far upper-right corner of the timeline report page.
-
Relative to Capture: This mode displays metric tick labels. Panning will move the ticks, but not necessarily change any tick labels. Like moving a ruler, but not changing the ruler's markings.
-
Relative to Cursor: This axis mode has the ticks relative to the cursor position. When you move the cursor, the ticks adapt accordingly. The cursor is always centered as zero and the ticks depict the distance from the cursor.
-
Relative to Viewport: In this mode, the ticks are relative to the left edge of the viewport. Panning does not change the ticks at all. The label of the axis states the relative time in the capture of the viewport.
Regardless of which mode you select, the cursor label always displays the seconds from the beginning of the capture. For example, L: reports time from the left edge of the viewport and R: shows the right edge.
There is also a setting in Nsight > Options > Analysis that allows the user to set the default axis mode. This axis mode is persisted with the report, so whenever the user opens a report again, the axis mode should be the same as it was previously.
3.3. Process Information
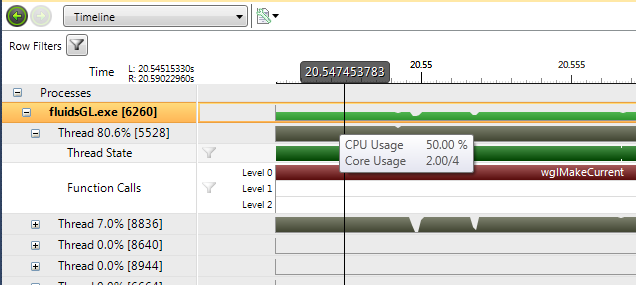
 The information in the Process section of the timeline shows data about each thread and function call invoked within each
process.
The information in the Process section of the timeline shows data about each thread and function call invoked within each
process.
| Group / Row | Description | |||||||||||||||||||||||||||
|---|---|---|---|---|---|---|---|---|---|---|---|---|---|---|---|---|---|---|---|---|---|---|---|---|---|---|---|---|
|
Process Row |
Each process appears on a row with its own name, and contains a group of rows with information about the process. To see data in these rows, you must mark the CPU Thread Trace checkbox (located on the Analysis Activity page) before you begin the capture. The label is in the following format: Process_Name [n] where the Process_Name is the name of the process, and n represents the process ID assigned by the operating system. The timeline shows an area graph with the percentage of CPU capacity used by the process. To see more precision in the area graph, change the height of the row by clicking and dragging the bottom of the row.
|
|||||||||||||||||||||||||||
|
Thread Row |
Each thread appears on a row, and contains sub-rows with information about the thread's state through time and the function calls made when the thread was runnable. The label is in the following format: Thread x% [n] where x% is the percentage of time the thread was running compared to the total capture time. n is the thread ID assigned by the operating system. |
|||||||||||||||||||||||||||
|
Thread State row |
The Thread State row shows the state of the thread over the lifetime of the thread.
|
|||||||||||||||||||||||||||
|
Function Calls Row |
The Function Calls row shows the function calls made over the lifetime of the thread. |
|||||||||||||||||||||||||||
|
User Events Row |
The User Events row shows information about calls made to the nvnxMark function. The User Events row has multiple child rows. The child rows display a view of nested calls to nvtxRangePop() and nvtxRangePop() on the thread. To see data in these rows, you must enable the Nsight Markers and Ranges setting, located on the Analysis Activity page. For more information available markers, see the nvToolsExt.h header file in the following directory: C:\Program Files (x86)\NVIDIA GPU Computing Toolkit\nvToolsExt\include |
|||||||||||||||||||||||||||
3.4. CUDA Information
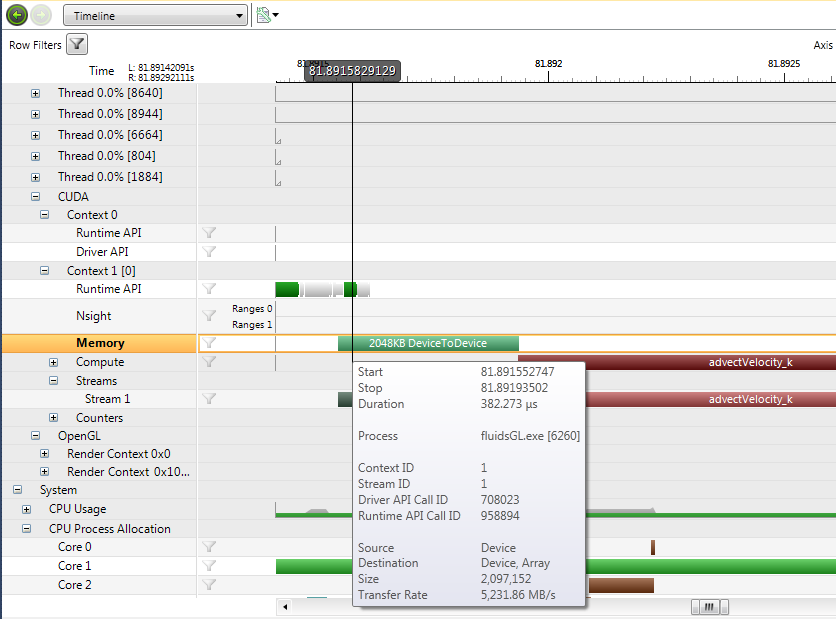
 The information in the CUDA section of the timeline shows information related to each CUDA Context, such as function calls
and memory copies that occurred within the Context.
The information in the CUDA section of the timeline shows information related to each CUDA Context, such as function calls
and memory copies that occurred within the Context.
| Group / Row | Description |
|---|---|
|
Context Row |
Each CUDA context contains a group of rows with information about that context. The label is in the following format: Context 1 [0] where the first number represents the context ID and the second number represents the device ID. The above example represents the first context created in the process on [device]. In the above example device == 0 Context 0 is a "dummy" context where CUDA Driver API calls are made when no context is active on the current thread. |
|
Runtime API Row |
For each context, a Runtime API row shows the CPU calls made into the CUDA Runtime interface on this context. |
|
Driver API Row |
Within each context, a Driver API row shows the CPU calls made to the CUDA driver interface during the lifetime of the CUDA Context. If the target application was programmed against the CUDA runtime interface, this row can also include the driver calls made through the runtime layer. This behavior is configurable from the NVIDIA Nsight VSE activity page. |
|
Nsight Row |
This row contains information, such as warnings or error messages, output by NVIDIA Nsight VSE to annotate the trace capture. These messages are aimed at providing a better understanding of the tools' impact on the capture. |
|
Memory Row |
Within each context group, a Memory row shows information about memory copies. This row corresponds to the information displayed in the Activity Report called CUDA Memory Copies. Each interval represents a memory copy or memory set of type H->D, or D->H. For D->D (intradevice transfer) activity, look at the Compute row located below the Memory row.
|
|
Compute Group |
The top row shows the summation of all kernel launches on a specific context. Each row under the Compute group shows when a specific function executed. The label is in the following format: Compute 20.9% [51] where the first number represents the amount of time the kernel executed divided by the total amount of time for the capture. The second number represents the number of kernel launches. In the above example, 20.9% of the capture time was occupied by kernel execution, and 51 kernels were launches. (Many D to D memory copies and memset calls are implemented as kernels.) Children rows show the time for each template instantiation. You can expand each templated kernel row to see information about each instantiation. |
|
Counters Group |
Within each context group, the Counters row shows the software counters derived from the trace data. If you enable Kernels and Memory Transfers, the analysis tool generates counters for: GPU%, Host to Device, Device to Host, and Device to Device transfers. If you enable Software Counters, the analysis tool generates counters for: CUDA Memory Allocated Device. |
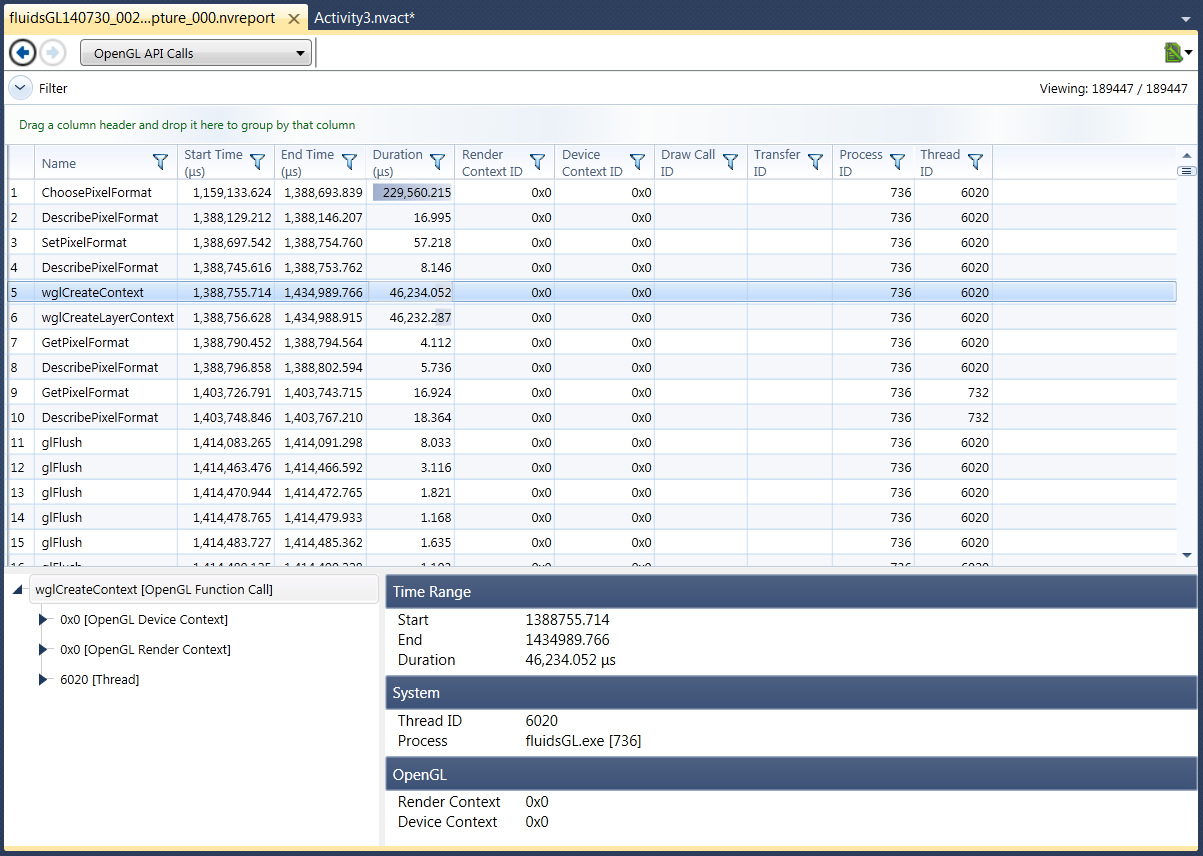
3.5. OpenCL, OpenGL, and DirectX Information
 The OpenCL
 ![]() , OpenGL, and the DirectX group of rows show API trace information. To see data in these rows, you must enable the collection
of OpenCL, OpenGL or DirectX information on the Analysis Activity Document.
, OpenGL, and the DirectX group of rows show API trace information. To see data in these rows, you must enable the collection
of OpenCL, OpenGL or DirectX information on the Analysis Activity Document.
|
Note: |
The rows show the timing of the calls from the CPU portion of source code. The rows do not indicate when the GPU performed the work. |
![]() OpenCL support in NVIDIA Nsight Visual Studio Edition has been deprecated and will be removed in a future release.
OpenCL support in NVIDIA Nsight Visual Studio Edition has been deprecated and will be removed in a future release.
3.6. System Information
 The information in the System section of the timeline shows CPU usage.
| Group / Row | Description |
|---|---|
|
CPU% Row |
Each row shows a different virtual core of the system. Each row shows two area graphs: one in gray and the other in light green. The gray area represents the core utilization of all processes combined (excluding the IDLE process). The light green area represents the core utilization of the launched process. |
|
CPU (Process Core Allocation) Row |
Each row shows a different virtual core of the system. The graph shows the allocation of a process to the core. Each process has its own color. The launched process is shown in light green. |
In the GPU Usage section, you will notice various node and engine numbers when you expand the drop-down.
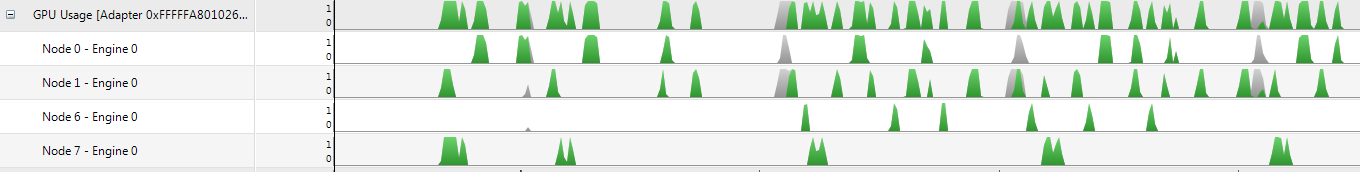
The WDDM represents GPUs as a set of engines. These engines get assigned to nodes to make up virtual function units.
-
On a single GPU system, each node will be built up from exactly one engine.
-
On multi GPU systems a single node can combine engines.
All engines in a node need to be of the same type – the types are as follows:
typedef enum _DXGK_ENGINE_TYPE {
DXGK_ENGINE_TYPE_OTHER             = 0,
DXGK_ENGINE_TYPE_3D                = 1,
DXGK_ENGINE_TYPE_VIDEO_DECODE      = 2,
DXGK_ENGINE_TYPE_VIDEO_ENCODE      = 3,
DXGK_ENGINE_TYPE_VIDEO_PROCESSING  = 4,
DXGK_ENGINE_TYPE_SCENE_ASSEMBLY    = 5,
DXGK_ENGINE_TYPE_COPY              = 6,
DXGK_ENGINE_TYPE_OVERLAY           = 7
} DXGK_ENGINE_TYPE;
Activity on nodes such as "Other" and "3D" can be treated as "graphics and/or compute." They are not necessarily a strict split by compute versus graphics.
For more information, see http://msdn.microsoft.com/en-us/library/windows/hardware/dn265417_v=vs.85_.aspx
3.7. Correlation and Details Panes
 Please see Analysis Report Correlation for more information on this section of the timeline report.
3.8. Navigation of the Timeline
The following tips explain how to move around the timeline. For more information about hotkeys and navigation, see How To: Navigate the Timeline Report.
Scrubbing horizontally
Hold down the Ctrl key, and left-click and drag to the right or left to move the visible part of the timeline.
Scrolling horizontally
Hold down the Shift key, and use the mouse scrollwheel.
Selecting a portion of the timeline
-
Hold down the Shift key, and left-click and drag to lasso the desired portion of the timeline.
-
The exact starting and ending times of the selected interval are displayed to the left and the right of the selection respectively.
Zooming to the selected portion of the timeline
Select a portion of the timeline, and then left-click on the selection to set the view extent of the timeline to selection interval.
5. Analysis Report Correlation
NVIDIA Nsight Visual Studio Edition has introduced the concept of data correlation within the Analysis Report pages. This document outlines the basic functionality of this correlation system.
5.1. The Anatomy of a Report Page
Report pages that contain correlation data will be divided into the sections shown in Figure 1.
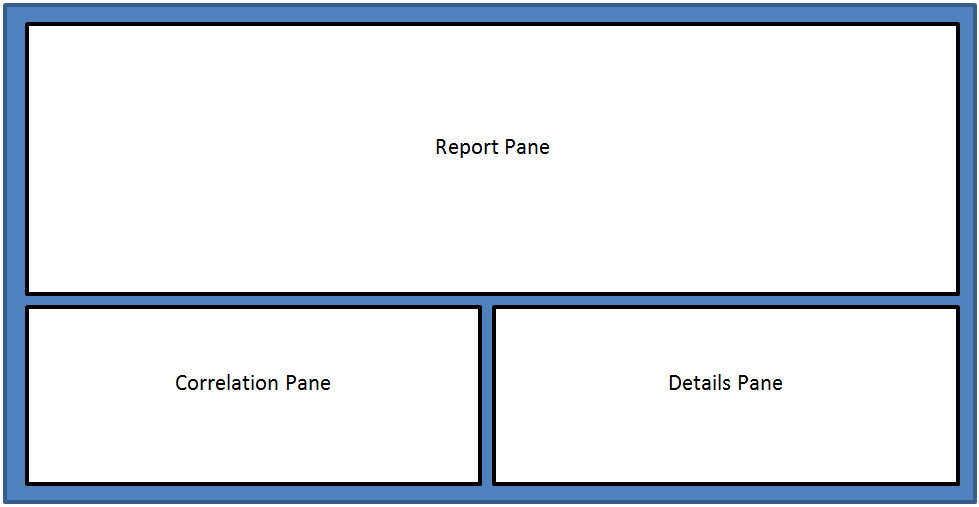 Figure 1: Report Page Layout
As shown above, each report page will contain a main report pane, a correlation pane and an object details pane. More detail on each pane is provided below.
Note:
Note that if a report page has no correlation data (like the GPU Devices page), then the lower two panes will not be visible.
The panes can be resized by dragging the partitions between them. The pane sizes are shared between all pages within a report. In this way, as the user navigates between pages the layout will be the same.
An example of an actual report page with this layout can be seen in Figure 2.
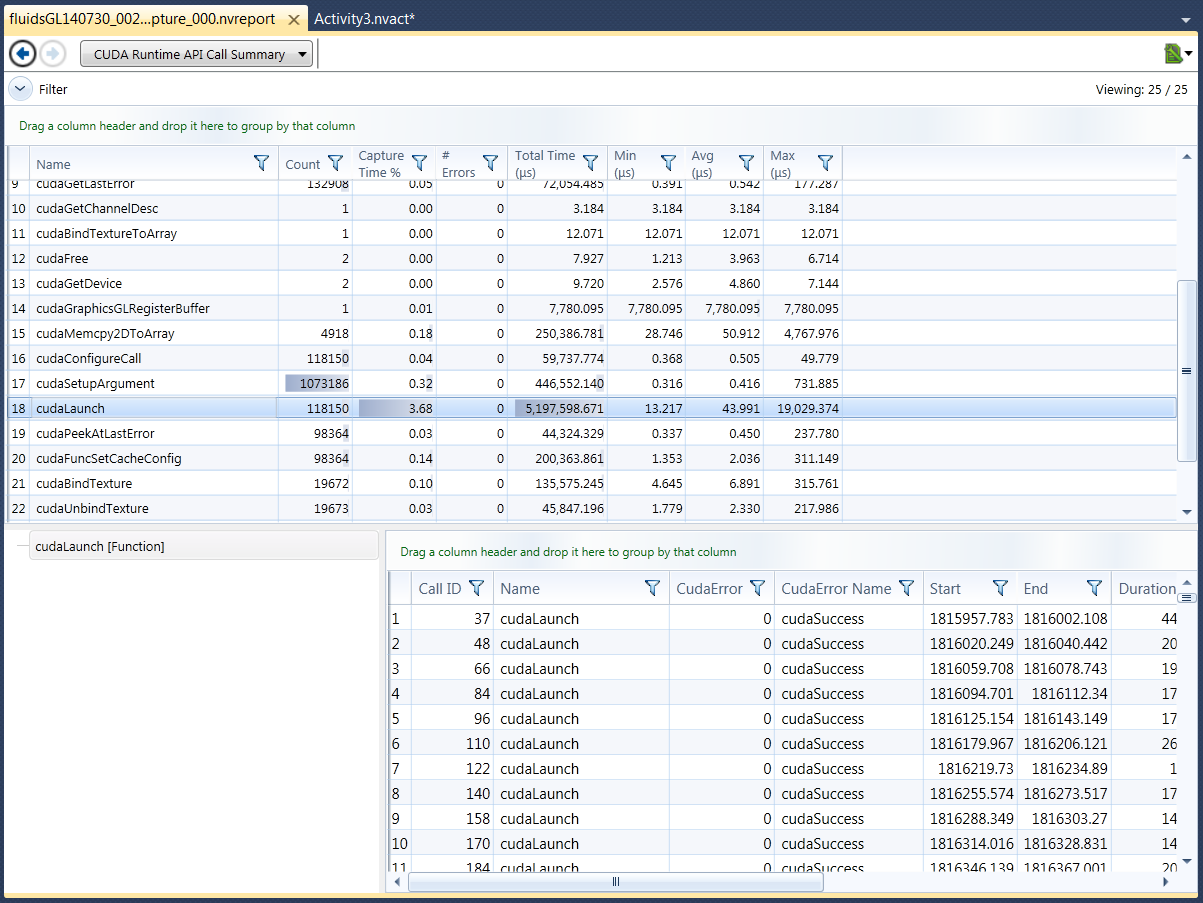 Figure 2: Report Page with Correlation Data
5.2. The Report Pane
The Report Pane contains the summary content, grids and timelines as were previously presented on each report page. This pane is the largest in the layout as it contains the most information and should be the focus of the page.
Historically, all grid-based pages as well as the timeline have supported the concept of a selected item. This selected item is now more important as it drives the context of the Correlation Pane.
5.3. The Correlation Pane
On Grid-based reports we currently support one selected item – the selected row. However, on the timeline page, we support selection on two different axes – the selected row and the selected data points under the cursor on this row. In either case, the selected items determine what information is displayed in the Correlation Pane.
As mentioned above, the Correlation Pane displays information relevant to the selected item(s) in the Report Pane. The data is displayed in hierarchical fashion with the selected item(s) on top of the hierarchy.
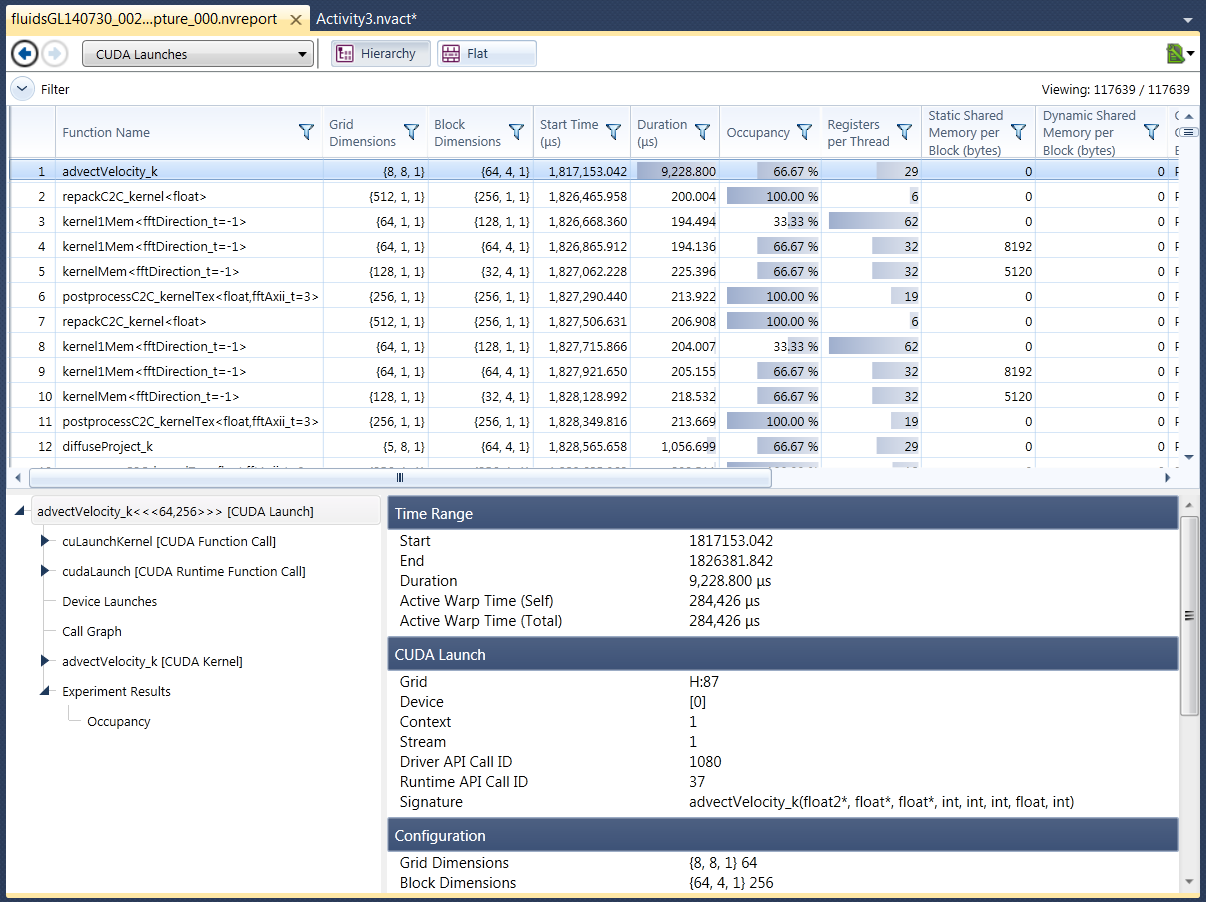
The children of the root node will represent things of interest relative to the root, and not necessarily physical children. For example, a hierarchy for a selected CUDA Launch object may contain something like the following:
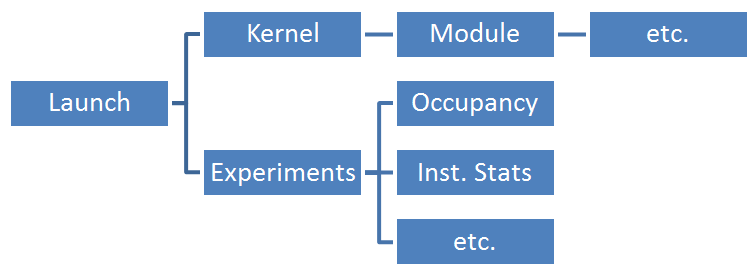
As seen above, the items in the hierarchy may represent a single object, or they may represent a list of objects (the Experiments node). For items representing lists, each item of the list is a child of the list node.
The content of the correlation hierarchy is generated dynamically based on attributes of the selected object in the report pane. As such, the contents of the correlation hierarchy is dependent on what type of object is selected in the report as well as what information is available.
The tree control used to render the correlation information supports the selection of a single item. This selected item determines the content of the Details Pane.
5.4. The Details Pane
As mentioned above, the Details Pane displays information relevant to the selected item in the Correlation Pane. The information presented may simply be a list of properties of interest, like start time, end time, duration etc. However, depending on the object selected, the details pane may present more in-depth information such as graphs, charts and tables used to describe experiment results, or lists of related information.
5.5. A Real Example
So, putting it all together:
-
The user selects an item in the Report Pane.
-
The Correlation Pane displays a hierarchy of potentially interesting information, whose root is the selected node from the Report Pane.
-
The Details Pane displays the details of the selected item from the Correlation Pane.
This interaction is shown in Figure 3.
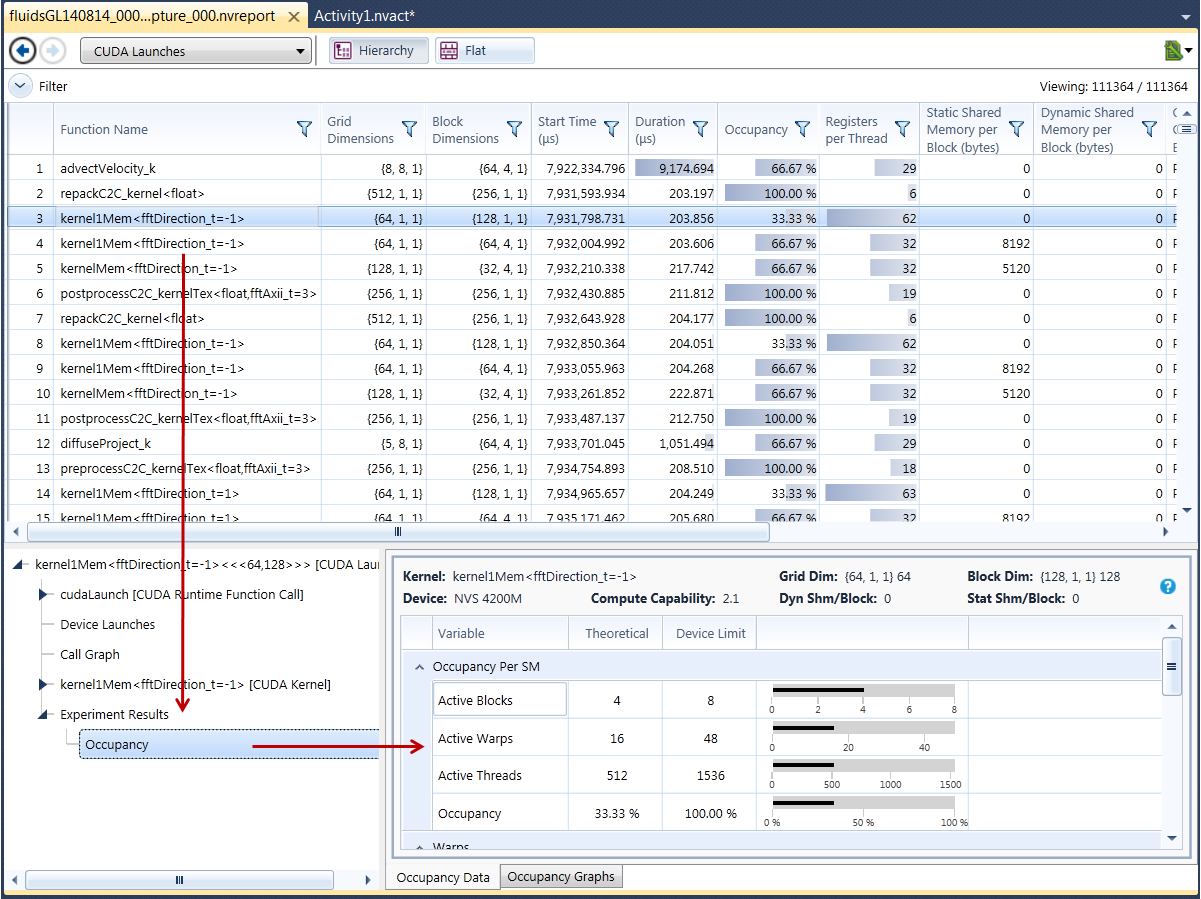 Figure 3: Correlation Data Interaction
5.6. Correlation Data on the Timeline
As mentioned above, the Correlation Pane is populated with data from two different "axes" when the timeline is visible – Row information, and Cursor Information. This results in a correlation pane with multiple root nodes as shown in Figure 4.
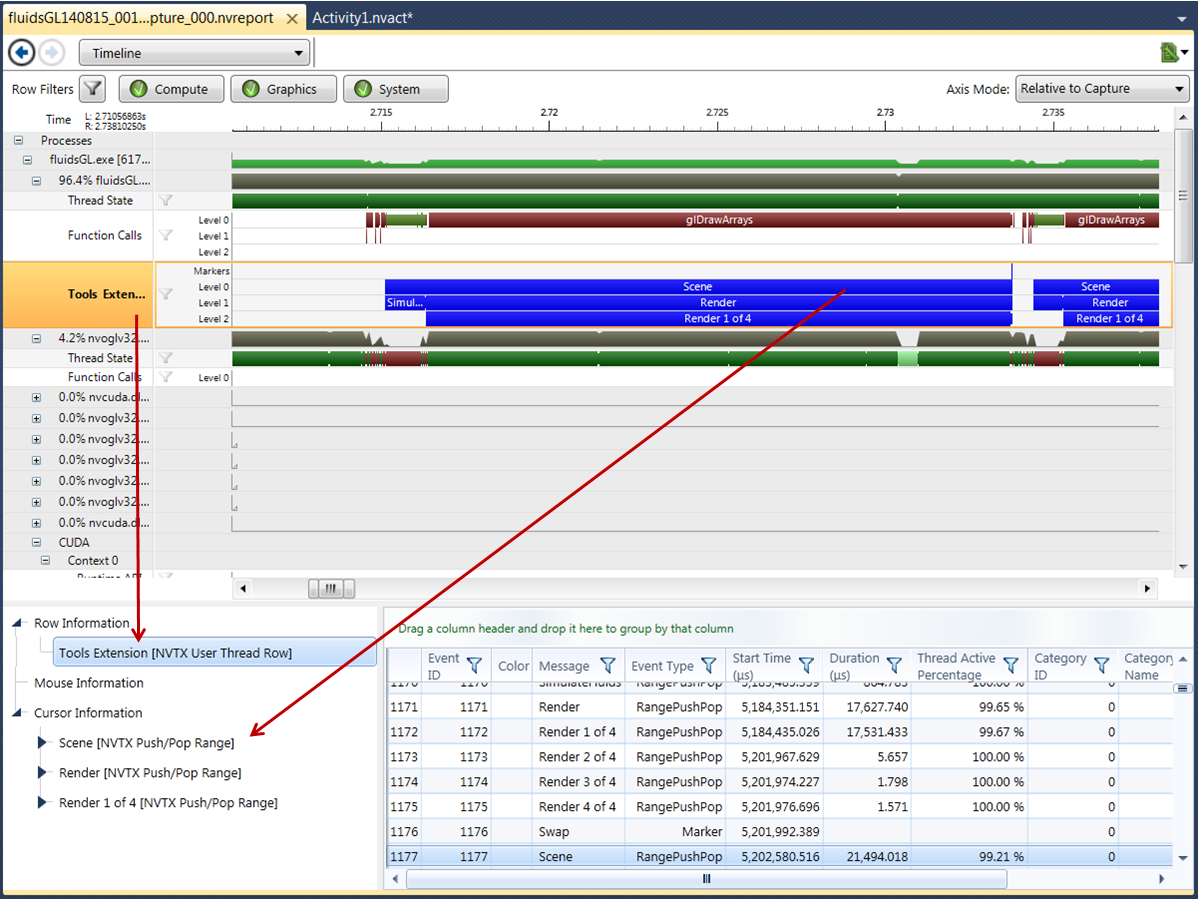 Figure 4: Correlation Data for the Timeline
In this example, note the following:
-
The user has selected the Tools Extension row in the correlation tree.
-
All data points for this row are shown in the Details Pane.
-
The data points that can be found at the cursor location are selected.
In this use-case, the selected items in the details pane will get updated as the cursor moves along the row. Similarly, if the user clicks on a row in the Details Pane, the cursor location will be moved to the location of the selected data point. This two-way interactivity of the correlation data can be very helpful in allowing the user to explore the captured data.
6. Theoretical Occupancy
Overview
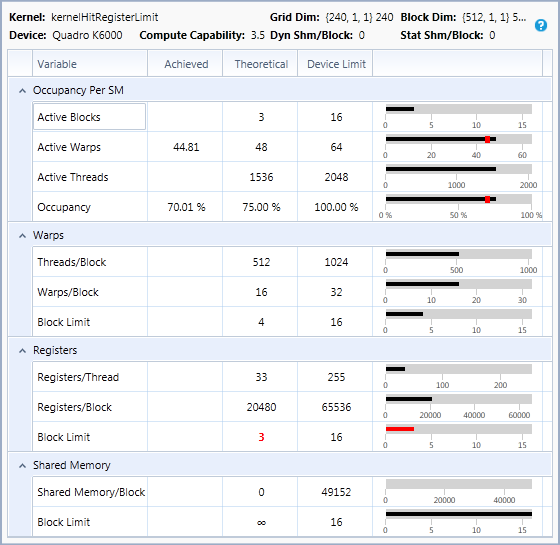
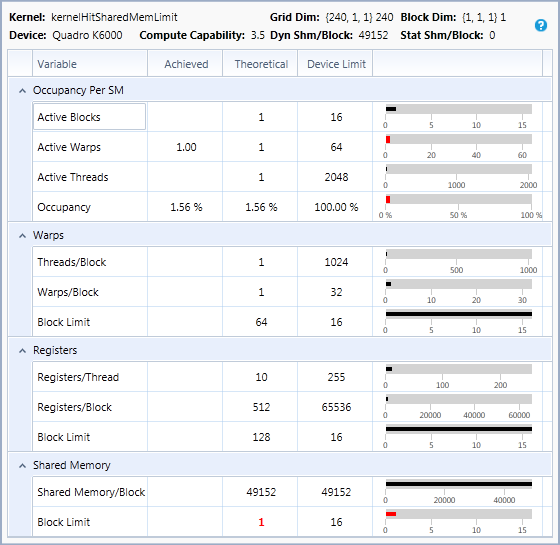
For all CUDA kernel launches recorded in Trace analysis, the Occupancy experiment detail pane shows "Theoretical Occupancy", the upper limit for occupancy imposed by the kernel launch configuration and the capabilities of the CUDA device. Additional graphs show achieved occupancy per SM, and illustrate how occupancy can be controlled by varying compiler and launch parameters.
6.1. Background
Definition of Occupancy
The CUDA C Programming Guide explains how a CUDA device's hardware implementation groups adjacent threads within a block into warps. A warp is considered active from the time its threads begin executing to the time when all threads in the warp have exited from the kernel. There is a maximum number of warps which can be concurrently active on a Streaming Multiprocessor (SM), as listed in the Programming Guide's table of compute capabilities. Occupancy is defined as the ratio of active warps on an SM to the maximum number of active warps supported by the SM. Occupancy varies over time as warps begin and end, and can be different for each SM.
Low occupancy results in poor instruction issue efficiency, because there are not enough eligible warps to hide latency between dependent instructions. When occupancy is at a sufficient level to hide latency, increasing it further may degrade performance due to the reduction in resources per thread. An early step of kernel performance analysis should be to check occupancy and observe the effects on kernel execution time when running at different occupancy levels.
Theoretical Occupancy
There is an upper limit for active warps, and thus also for occupancy, derivable from the launch configuration, compile options for the kernel, and device capabilities. Each block of a kernel launch gets distributed to one of the SMs for execution. A block is considered active from the time its warps begin executing to the time when all warps in the block have exited from the kernel. The number of blocks which can execute concurrently on an SM is limited by the factors listed below. The upper limit for active warps is the product of the upper limit for active blocks and the number of warps per block. Thus, the upper limit for active warps can be raised by increasing the number of warps per block (defined by block dimensions), or by changing the factors limiting how many blocks can fit on an SM to allow more active blocks. The limiting factors are:
- Warps per SM
-
The SM has a maximum number of warps that can be active at once. Since occupancy is the ratio of active warps to maximum supported active warps, occupancy is 100% if the number of active warps equals the maximum. If this factor is limiting active blocks, occupancy cannot be increased. For example, on a GPU that supports 64 active warps per SM, 8 active blocks with 256 threads per block (8 warps per block) results in 64 active warps, and 100% theoretical occupancy. Similarly, 16 active blocks with 128 threads per block (4 warps per block) would also result in 64 active warps, and 100% theoretical occupancy.
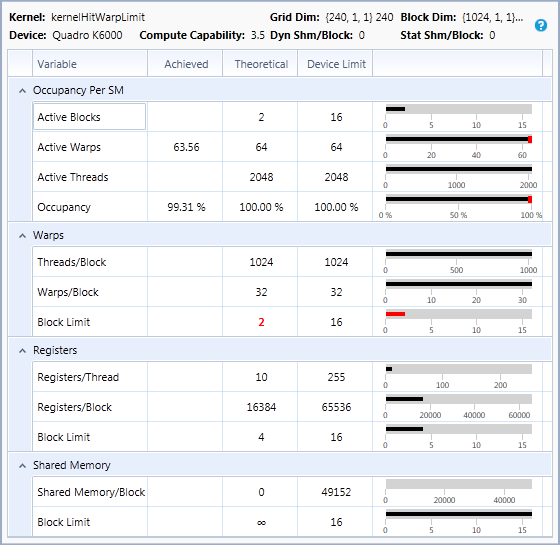
-
- Blocks per SM
-
The SM has a maximum number of blocks that can be active at once. If occupancy is below 100% and this factor is limiting active blocks, it means each block does not contain enough warps to reach 100% occupancy when the device's active block limit is reached. Occupancy can be increased by increasing block size. For example, on a GPU that supports 16 active blocks and 64 active warps per SM, blocks with 32 threads (1 warp per block) result in at most 16 active warps (25% theoretical occupancy), because only 16 blocks can be active, and each block has only one warp. On this GPU, increasing block size to 4 warps per block makes it possible to achieve 100% theoretical occupancy.
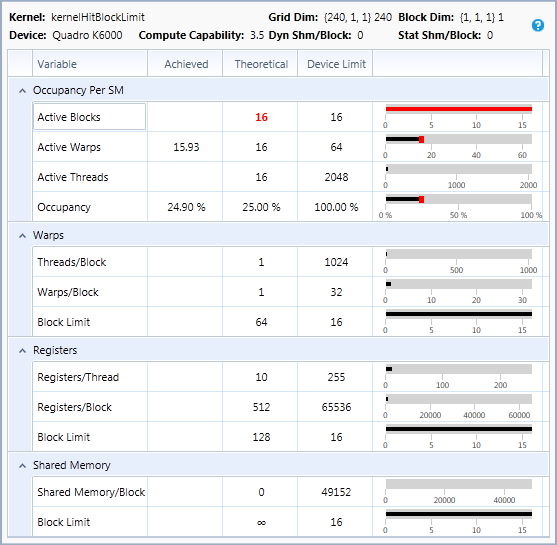
-
- Registers per SM
-
The SM has a set of registers shared by all active threads. If this factor is limiting active blocks, it means the number of registers per thread allocated by the compiler can be reduced to increase occupancy (see __launch_bounds__). Kernel execution time and average eligible warps should be monitored carefully when adjusting registers per thread to control occupancy. The performance gain from improved latency hiding due to increased occupancy may be outweighed by the performance loss of having fewer registers per thread, and spilling to local memory more often. The best-performing balance of occupancy and registers per thread can be found experimentally by tracing the kernel compiled with different numbers of registers per thread, controlled via __launch_bounds__.
-
- Shared Memory per SM
-
The SM has a fixed amount of shared memory shared by all active threads. If this factor is limiting active blocks, it means the shared memory needed per thread can be reduced to increase occupancy. Shared memory per thread is the sum of "static shared memory," the total size needed for all __shared__ variables, and "dynamic shared memory," the amount of shared memory specified as a parameter to the kernel launch. For some CUDA devices, the amount of shared memory per SM is configurable, trading between shared memory size and L1 cache size. If such a GPU is configured to use more L1 cache and shared memory is the limiting factor for occupancy, then occupancy can also be increased by choosing to use less L1 cache and more shared memory.
-
6.2. Charts
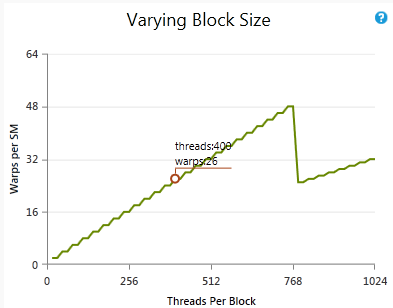 Shows how varying the block size while holding other parameters constant would affect the theoretical occupancy. The circled point shows the current number of threads per block and the current upper limit of active warps. Note that the number of active warps is not the number of warps per block (that is threads per block divided by warp size, rounded up). If the chart's line goes higher than the circle, changing the block size could increase occupancy without changing the other factors. |
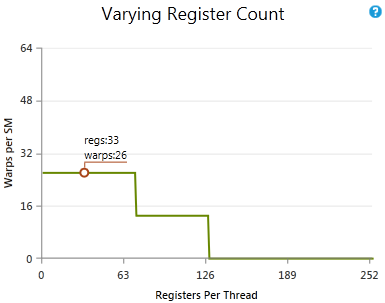 Shows how varying the register count while holding other parameters constant would affect the theoretical occupancy. The circled point shows the current number of registers per thread and the current upper limit of active warps. If the chart's line goes higher than the circle, changing the number of registers per thread could increase occupancy without changing the other factors. |
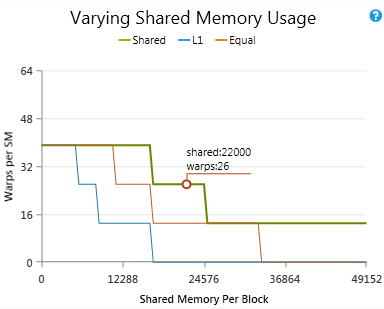 Shows how varying the shared memory usage while holding other parameters constant would affect the theoretical occupancy. The circled point shows the current amount of shared memory per block and the current upper limit of active warps. If the chart's line goes higher than the circle, changing the amount of shared memory per block could increase occupancy without changing the other factors. |
7. CUDA Reports
If you mark the CUDA checkbox in the Trace Settings area of the Activity document, NVIDIA Nsight VSE produces reports that include CUDA-specific trace data.
CUDA Summary
The CUDA Summary report is a top-level report that contains a summary of the CUDA-related information collected in the session. The summary displays the information in 3 sections:
-
CUDA Devices — information about devices running CUDA-based code,
-
CUDA Contexts — information about CUDA Contexts, and
-
Top Device Functions by Total Time — a list of the most used kernels in terms of time.
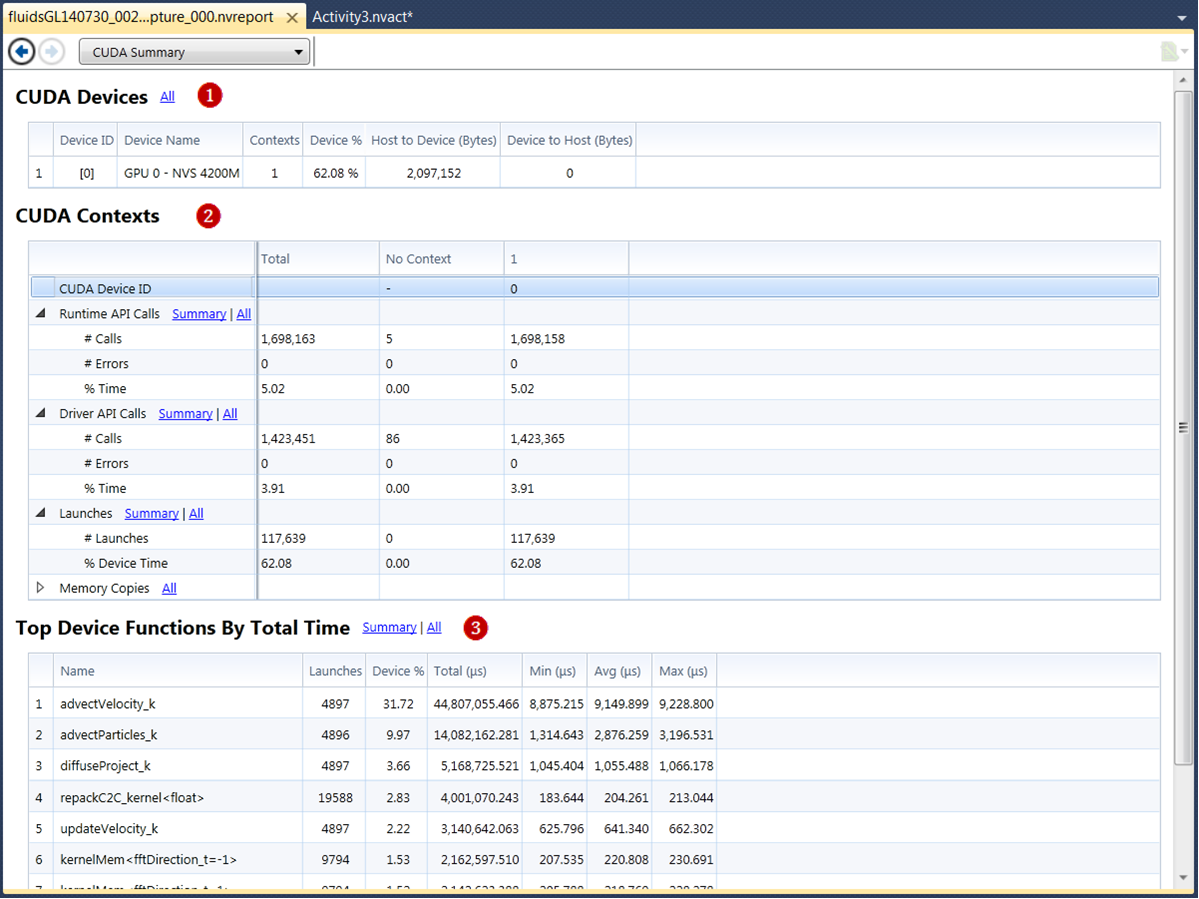
CUDA Devices
| Column Label | Description |
|---|---|
|
ID |
The ID of the CUDA device as returned by the CUDA Driver API calls cuDeviceGet and cuDeviceCount. |
|
Name |
The display name of the CUDA device as returned by the call to cuDeviceGetName. |
|
Contexts |
The number of CUcontext instances created on the device. |
|
GPU% |
The % of time that kernels executed on the device out of the total duration of the capture. This does not include overhead for launching kernels. The actual percentage is slightly higher. |
|
H to D (bytes) |
H to D (bytes) The number of bytes transferred from the host to the device. |
|
D to H (bytes) |
D to H (bytes) The number of bytes transferred from the device to host. |
CUDA Contexts
The first column lists the different attributes that were measured, such as number of API calls or errors. The second column lists the total count for the analysis session (capture), such as the total number of API calls for the session, or total number of errors for the session. The remaining columns, list the counts for each context. The first context is Context 0, which refers to any CUDA Driver API calls made when a CUcontext instance is not active on the current thread.
| Row Label | Description | ||
|---|---|---|---|
|
Device ID |
Context 0 refers to any CUDA Driver API calls made when a CUcontext instance is not active on the current thread. |
||
|
Driver API Calls |
In the Total column, click on the link to see the CUDA Driver Call Summary pages or the list of the CUDA Driver calls.
|
||
|
Launches |
Link to CUDA Launches and CUDA Launch Summary.
|
||
|
Memory Copies |
|
Top Device Functions by Total Time
This overview table lists the top 10 kernels by time spent executing on the GPU.
CUDA Driver API Call Summary
The Driver API Call Summary lists statistics of calls made to the CUDA Driver API, including the number of times the API call was called, the percentage of time of the overall capture time per thread that the API call took, the number of errors returned, and statistics on the elapsed time each API call took while executing.
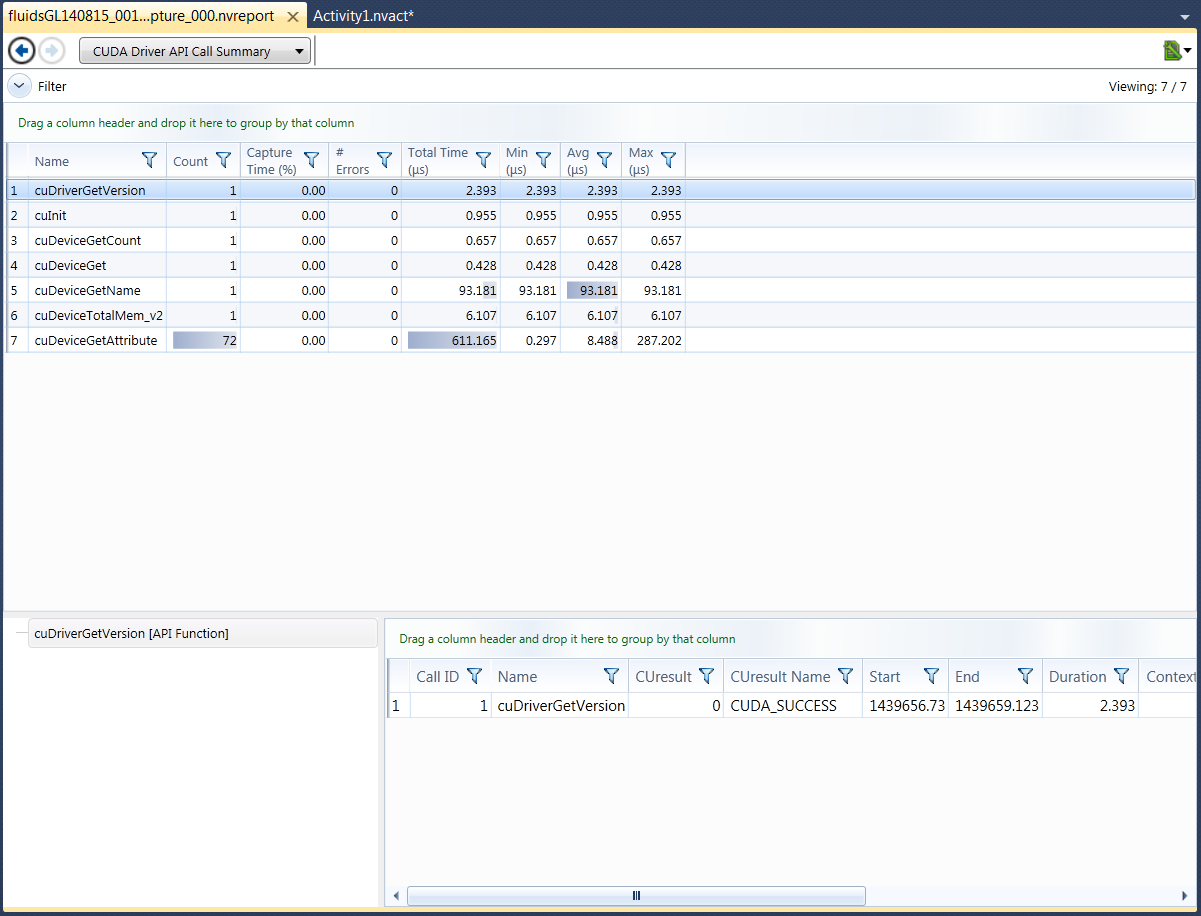
|
Note: |
The color gradient in some cells used to display values of column entries relative to one another. For most of the columns, the gradient represents the a percentage of current cells value relative to the maximum value contained in that column. However, the columns containing percentage values use a maximum of 100%, even if there is no entry with 100%. This color gradient allows you to quickly identify outliers in the data without having to scan through all the numbers and mentally compare them to one another. It is also very helpful when sorting the grid by different columns. Seeing where the large gradients (outliers in other columns) move to can be very informative. |
CUDA Launches
The CUDA Launches report shows every CUDA kernel that was launched during your program's execution. Each row shows the time of execution and work size data for each launch.
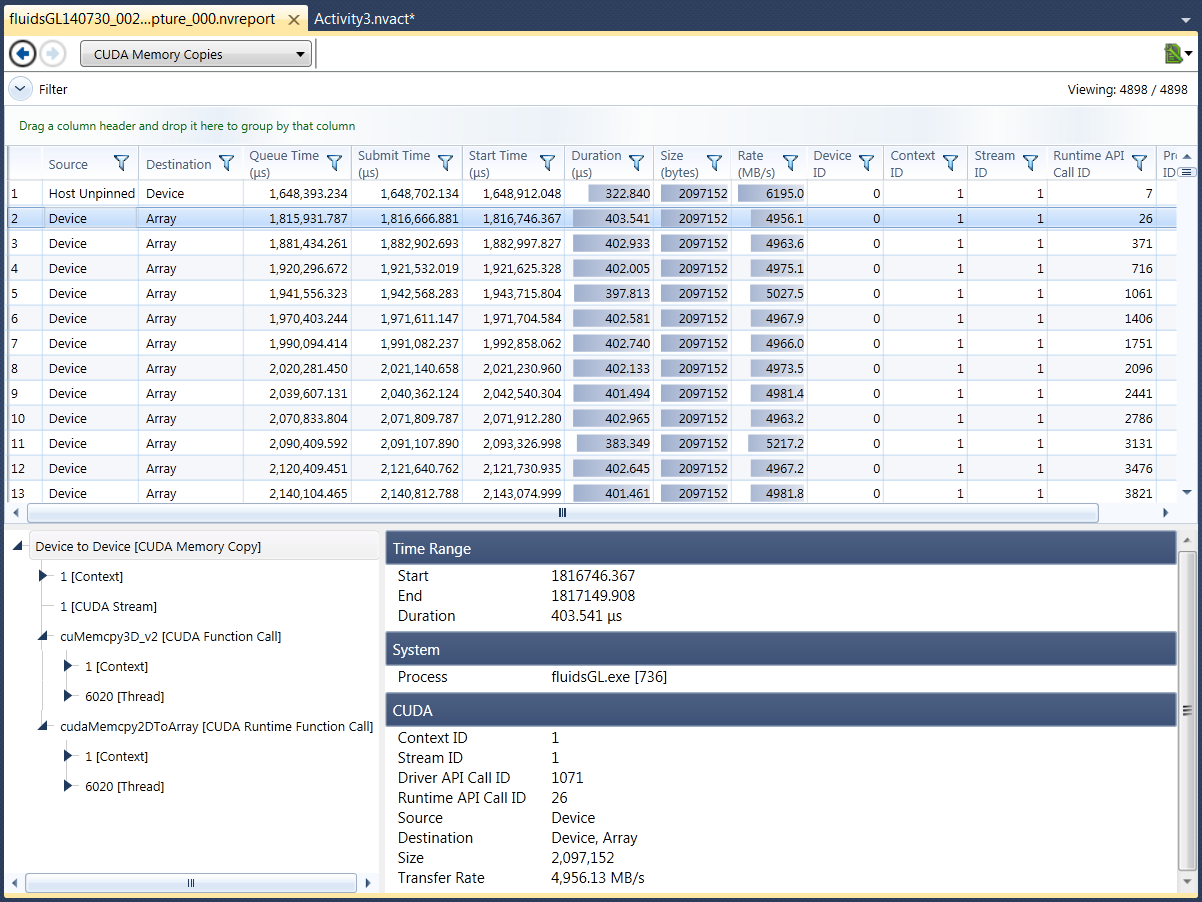
CUDA Memory Copies
The CUDA Memory Copies shows every copy command executed in your program, including information on the start time, the duration, the number of bytes copied, and the rate of the copy. Memory copy commands can be performance limiting, especially if the copy command results in a transfer of data across the PCI-e bus from your CPU to your GPU or from your GPU to your CPU.
7.1. CUDA Concurrent Kernel Trace Mode
NVIDIA Nsight VSE includes support for tracing concurrent kernel execution on newer NVIDIA GPUs. In older versions of NVIDIA Nsight VSE, analysis captures always serialized all kernel launches, forcing them to be executed one at a time. With the new concurrent kernel trace mode, the runtime behavior of the target application with respect to the concurrent kernel execution is maintained, and all kernel start and end times are captured without forcing the kernels to be executed one at a time.
Note that on NVIDIA GPUs built on the Tesla architecture, the serialized capture mode is always used, regardless of the configuration specified in the NVIDIA Nsight VSE options.
|
Note: |
A few notes on concurrent kernel trace mode:
|
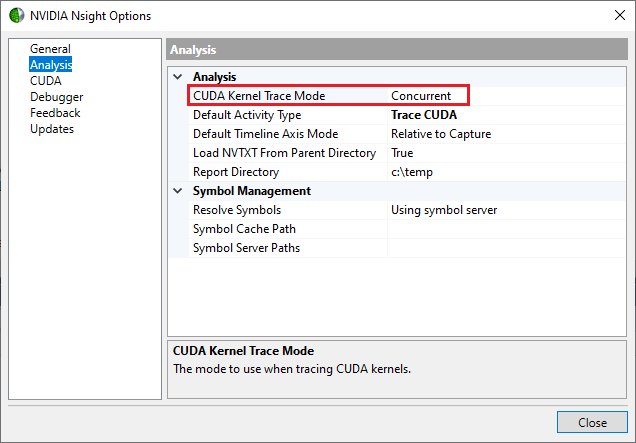
To select analysis trace mode, do the following:
-
With your solution file open in Visual Studio, go to Nsight > Options.
-
Click on the Analysis page.
-
Select the drop-down menu next to CUDA Kernel Trace Mode. Here, you can choose whether to use concurrent or serialized mode.
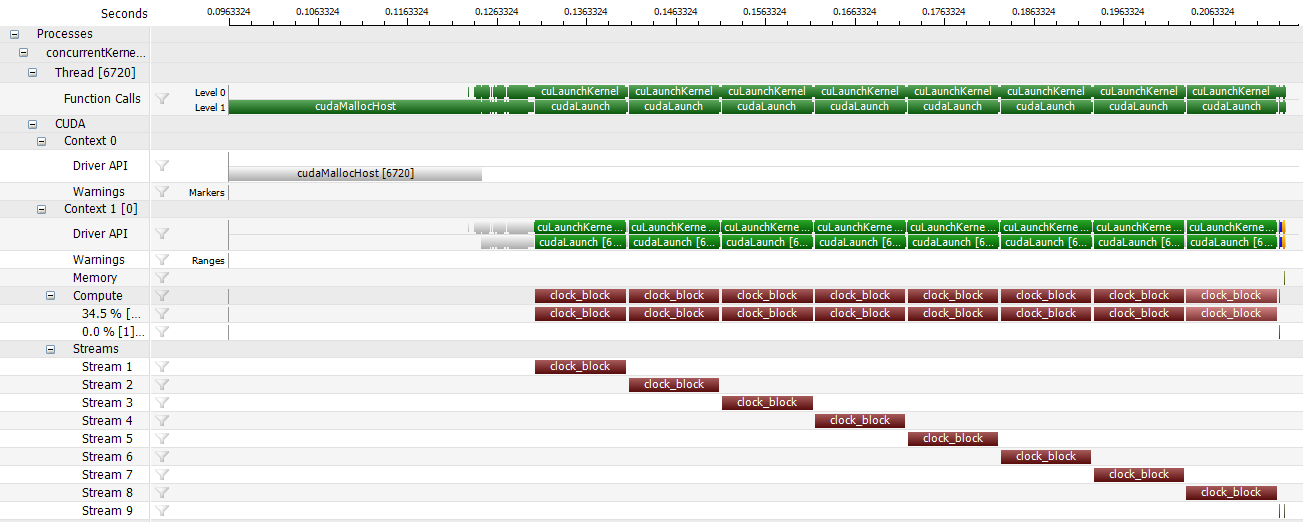
Concurrent versus Serialized Mode
Here's an example of how concurrent kernel execution appears in the timeline report for the concurrentKernels SDK sample that ships with the NVIDIA GPU Computing SDK. All eight kernel launches are executed in parallel on the GPU.
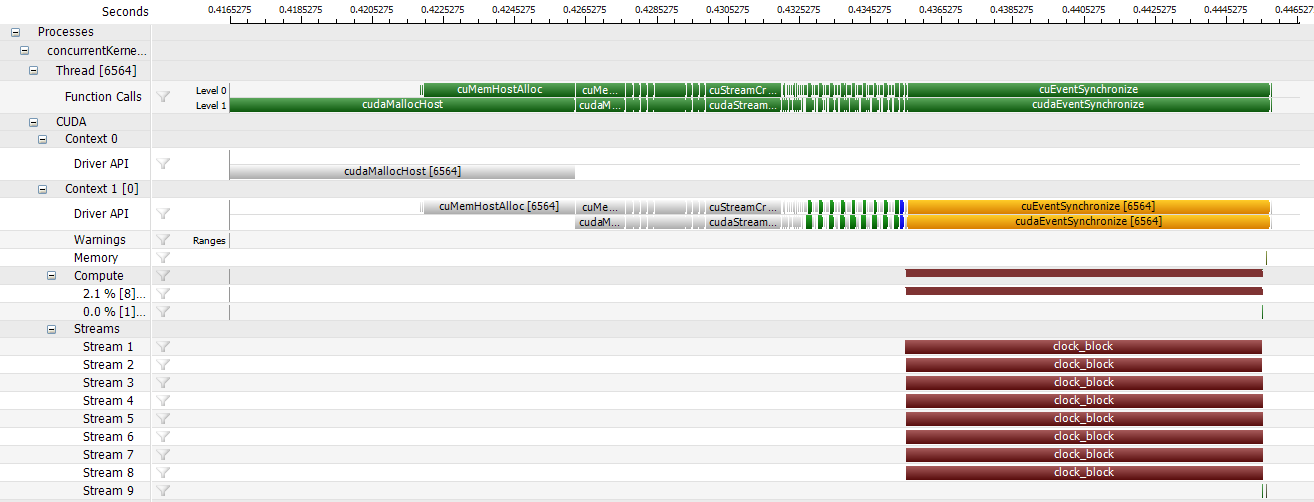
By contrast, in serialized mode, it's easy to see that all kernel launches are forced to be processed one at a time, causing a significantly different runtime behavior.
8. Detailed Reports
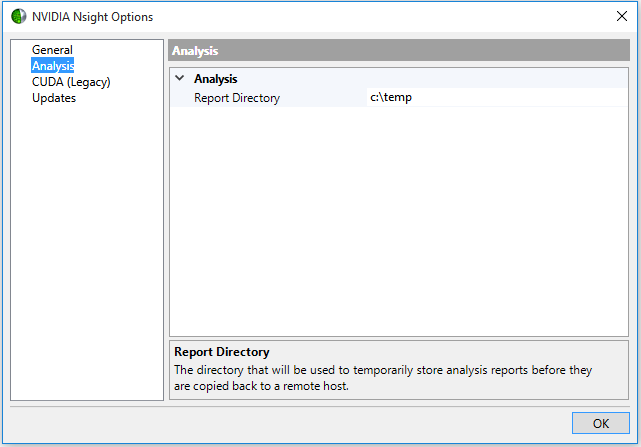
The NVIDIA Nsight Visual Studio Edition Analysis Tools produce several detailed reports that show information specific to the type of trace performed. NVIDIA Nsight VSE saves the reports to the c:\temp directory. You can change the default directory.
To change the default directory for storing reports:
-
Start the Nsight Monitor.
-
Click the Windows Start Menu in the bottom left corner of the screen.
-
Select All Programs > NVIDIA Corporation >Nsight Visual Studio Edition 2020.1> Nsight Monitor.
The Nsight Monitor starts. The monitor icon appears in the system tray.
-
-
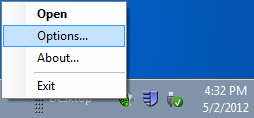
Right click on the Nsight Monitor icon in the system tray.
-
Select Options.
-
In the Options window, select Analysis.
-
Set the Report Directory to the location you want to store reports.
-
Click OK.
Each detailed report deals with some subset of trace data related to the domain for which you are collecting data. For example, if you collected data on a DirectX application, the detailed reports would contain data on DirectX API Calls, and DirectX Performance markers. If you collected system data, you would also see reports on function calls to the system, and statistics about each GPU device.
The list of reports that are available depend on the type of analysis you performed, and the data that was available to the analysis tools.
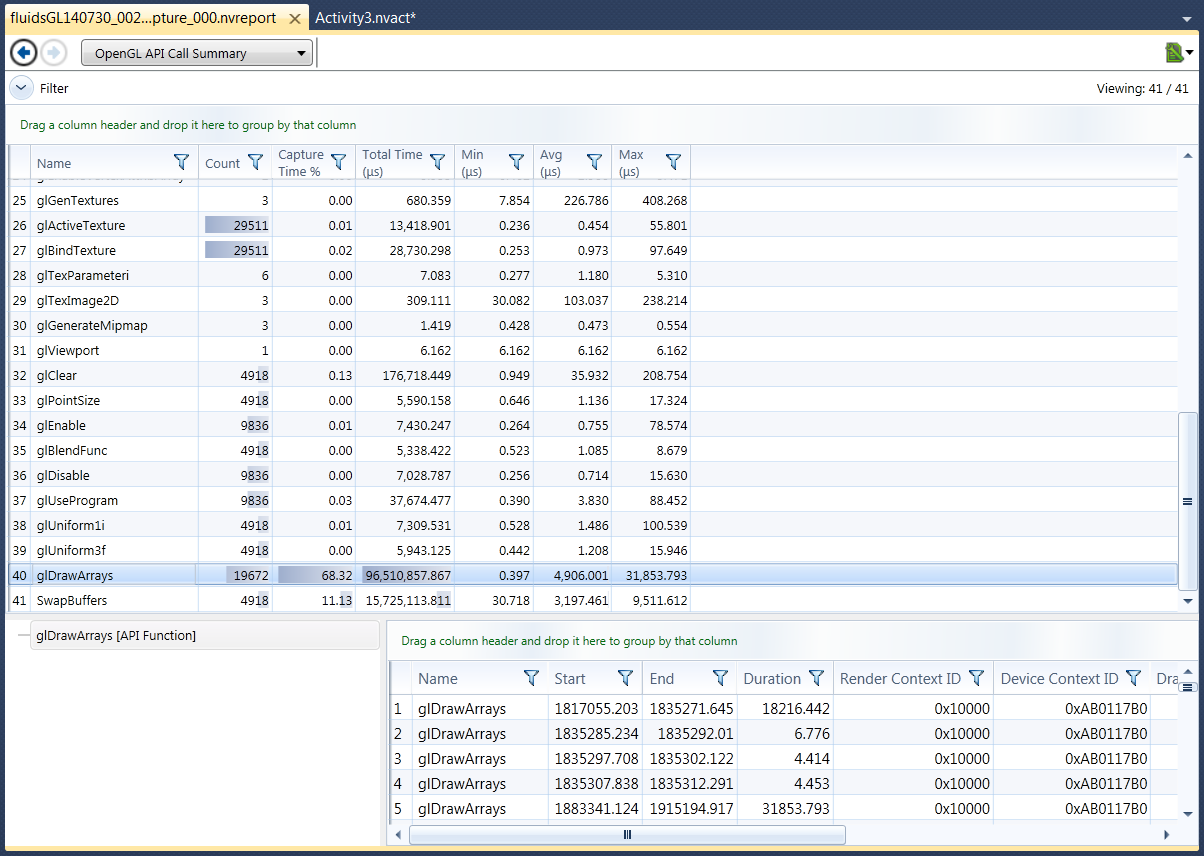
For example, a trace on all available signals related to OpenGL would result in the following detailed reports:
9. OpenCL Reports
|
Note: |
OpenCL support in NVIDIA Nsight Visual Studio Edition has been deprecated and will be removed in a future release. |
If you mark the OpenCL checkbox in the Trace Settings area of the Activity document, the NVIDIA Nsight VSE analysis tool produces reports that include OpenCL-specific trace data.
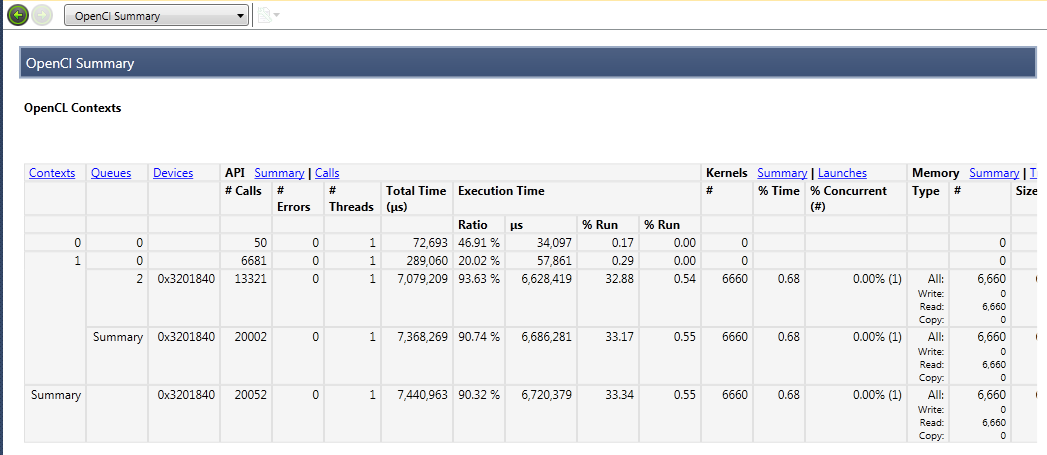
OpenCL Summary
The OpenCL Summary appears in the middle of the top-level Summary Report. It shows a summary of the OpenCL-related information collected in the session. The summary displays information about API calls per context and per queue. Contexts with more than one queue also contain a Summary row, which shows the aggregated statistics for all queues in the parent context.
| Column Label | Description |
|---|---|
|
Contexts |
Lists the contexts that were created during the capture. Each context appears on its own row, along with the corresponding data related to that context. |
|
Queues |
Lists the queues created for each context. If there is more than one queue for a context |
|
Devices |
The OpenCL device used for each queue. |
|
API Calls |
The number of API calls, errors, threads, and time spent per queue. |
|
Kernels |
The number, % Time, % Concurrent for all kernels per queue |
|
Memory |
The number, bytes transferred, % Time, and % concurrent for all OpenCL memory transfers per queue. |
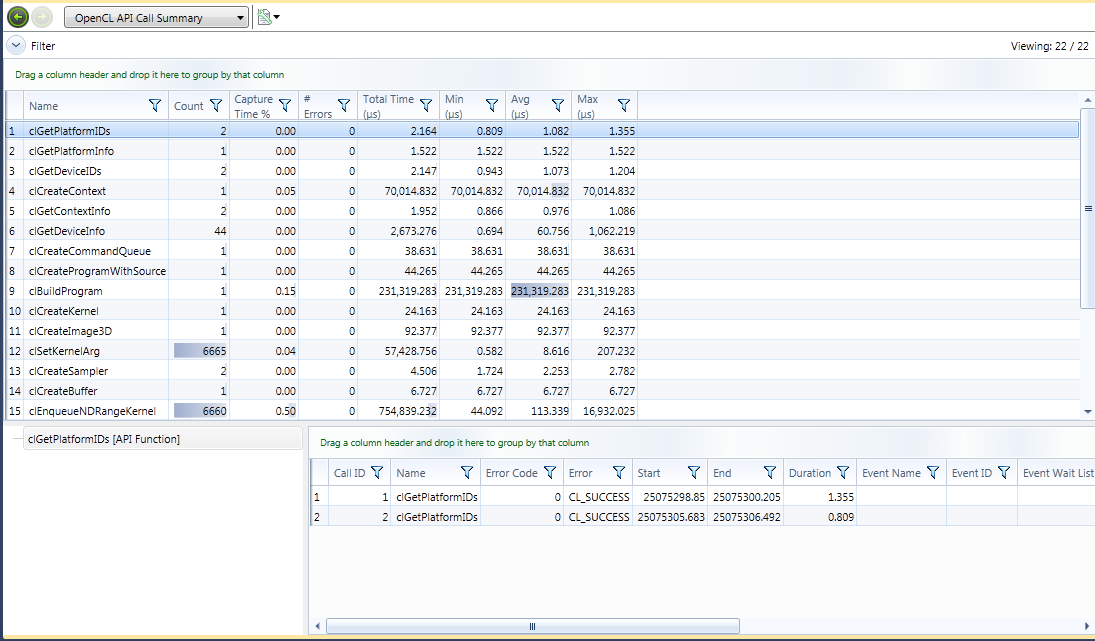
OpenCL API Call Summary
The API Call Summary lists statistics of calls made to the OpenCL API, including the number of times the API call was called, the percentage of time of the overall capture time that the API call took, the number of errors returned, and statistics on the elapsed time each API call took while executing.
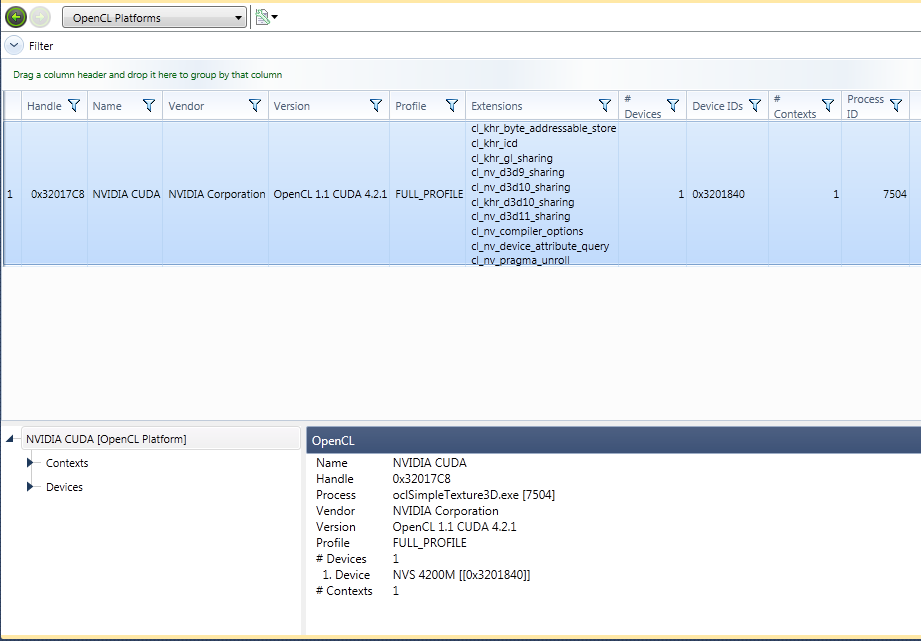
OpenCL Platforms
The OpenCL Platforms report shows data on the OpenCL platforms on the machine on which the OpenCL trace was run. The data captured and shown in this view is captured using the standard clGetPlatformInfo and clGetPlatformIDs API calls.
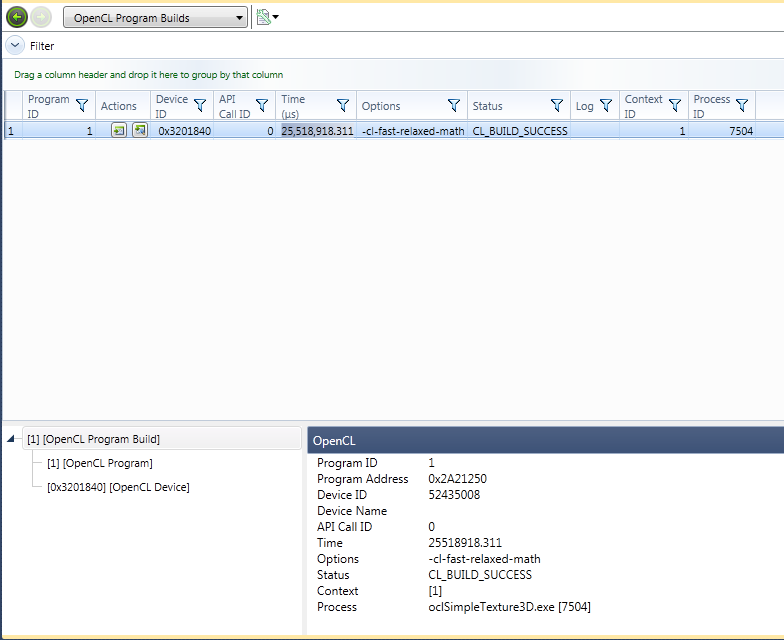
OpenCL Program Builds
The OpenCL Program Builds report shows every OpenCL Program built by your program using the clBuildProgram API call. Using this report, you can see data on all program builds that occurred in your program's execution, and can view the source and assembly for each program.
| Column Label | Description |
|---|---|
|
Program ID |
The id of the program being built. |
|
Actions |
There are two buttons available under Actions: The first will display the source of this OpenCL program, and the second will display the assembly of this OpenCL program. |
|
Device ID |
The id of the OpenCL device used in the builds. |
|
API Call ID |
The Call ID of the clBuildProgram API call. |
|
Time (µs) |
The amount of time elapsed during the clBuildProgram API call. |
|
Options |
Any options passed into the clBuildProgram API call |
|
Status |
The returned status of the clBuildProgram API call |
|
Log |
Any log output from this clBuildProgram API call |
|
Context ID |
The OpenCL id used for this API call |
|
Process ID |
The CPU process ID for this API call |
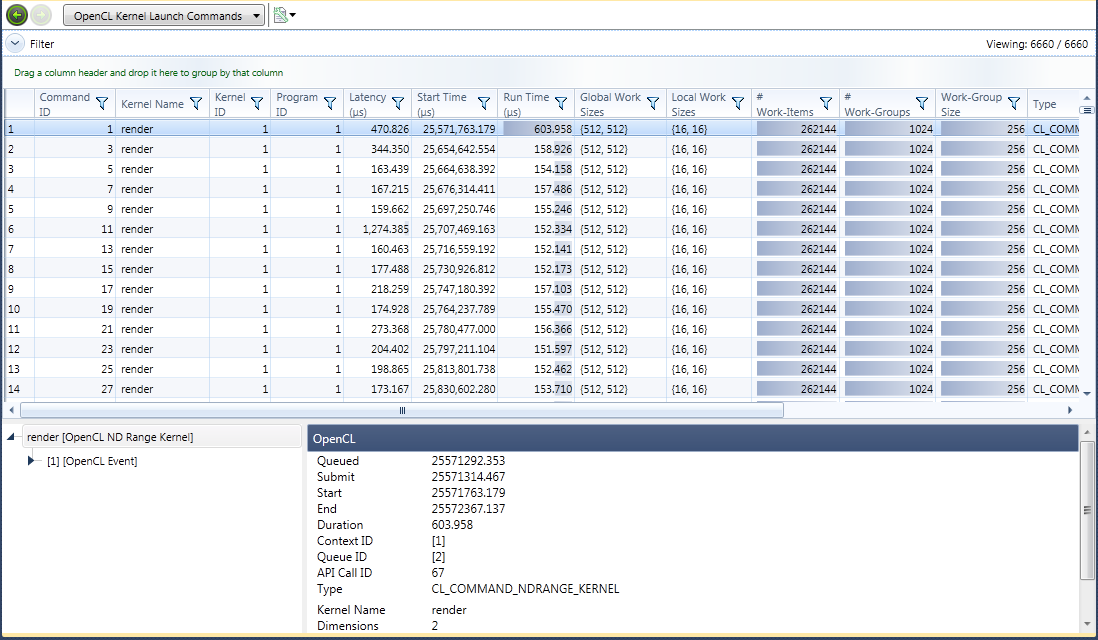
OpenCL Kernel Launch Commands
The OpenCL Kernel Launch Commands report shows every OpenCL kernel that was launched during your program's execution. Each row shows the time of execution and work size data for each launch.
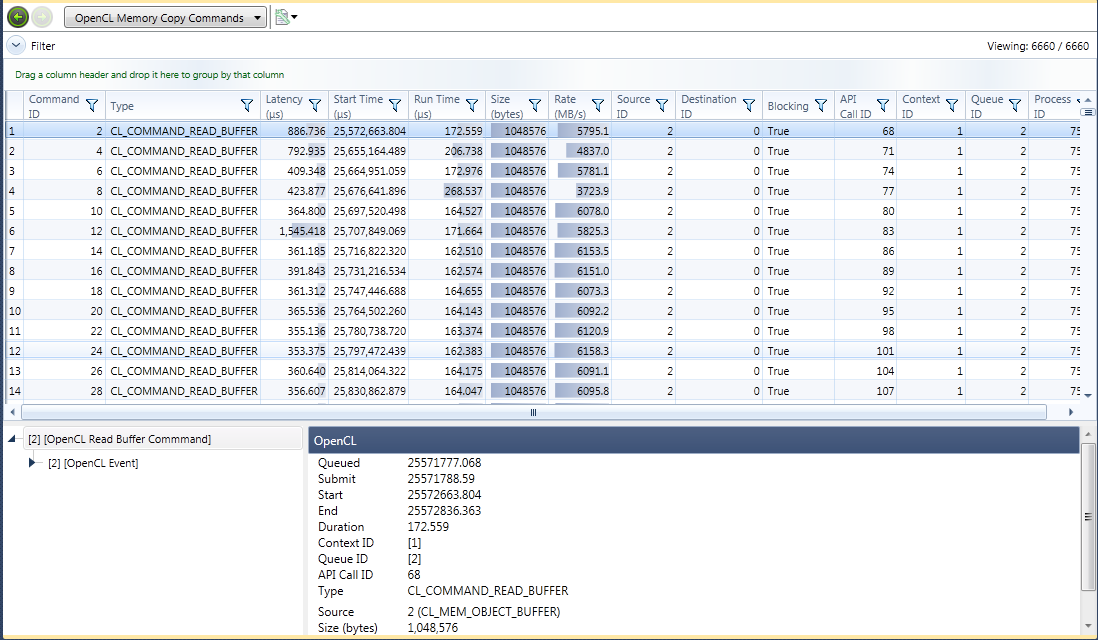
OpenCL Memory Copy Commands
The OpenCL Memory Copy Commands report shows every copy command executed in your program. Memory copy commands can be performance limiting, especially the copy command results in a transfer of data across the PCI-e bus from your CPU to your GPU or from your GPU to your CPU.
Notices
Notice
NVIDIA® Nsight™ Application Development Environment for Heterogeneous Platforms, Visual Studio Edition 2020.1 User GuideSend Feedback
THE INFORMATION IN THIS GUIDE AND ALL OTHER INFORMATION CONTAINED IN NVIDIA DOCUMENTATION REFERENCED IN THIS GUIDE IS PROVIDED “AS IS.” NVIDIA MAKES NO WARRANTIES, EXPRESSED, IMPLIED, STATUTORY, OR OTHERWISE WITH RESPECT TO THE INFORMATION FOR THE PRODUCT, AND EXPRESSLY DISCLAIMS ALL IMPLIED WARRANTIES OF NONINFRINGEMENT, MERCHANTABILITY, AND FITNESS FOR A PARTICULAR PURPOSE. Notwithstanding any damages that customer might incur for any reason whatsoever, NVIDIA’s aggregate and cumulative liability towards customer for the product described in this guide shall be limited in accordance with the NVIDIA terms and conditions of sale for the product.
THE NVIDIA PRODUCT DESCRIBED IN THIS GUIDE IS NOT FAULT TOLERANT AND IS NOT DESIGNED, MANUFACTURED OR INTENDED FOR USE IN CONNECTION WITH THE DESIGN, CONSTRUCTION, MAINTENANCE, AND/OR OPERATION OF ANY SYSTEM WHERE THE USE OR A FAILURE OF SUCH SYSTEM COULD RESULT IN A SITUATION THAT THREATENS THE SAFETY OF HUMAN LIFE OR SEVERE PHYSICAL HARM OR PROPERTY DAMAGE (INCLUDING, FOR EXAMPLE, USE IN CONNECTION WITH ANY NUCLEAR, AVIONICS, LIFE SUPPORT OR OTHER LIFE CRITICAL APPLICATION). NVIDIA EXPRESSLY DISCLAIMS ANY EXPRESS OR IMPLIED WARRANTY OF FITNESS FOR SUCH HIGH RISK USES. NVIDIA SHALL NOT BE LIABLE TO CUSTOMER OR ANY THIRD PARTY, IN WHOLE OR IN PART, FOR ANY CLAIMS OR DAMAGES ARISING FROM SUCH HIGH RISK USES.
NVIDIA makes no representation or warranty that the product described in this guide will be suitable for any specified use without further testing or modification. Testing of all parameters of each product is not necessarily performed by NVIDIA. It is customer’s sole responsibility to ensure the product is suitable and fit for the application planned by customer and to do the necessary testing for the application in order to avoid a default of the application or the product. Weaknesses in customer’s product designs may affect the quality and reliability of the NVIDIA product and may result in additional or different conditions and/or requirements beyond those contained in this guide. NVIDIA does not accept any liability related to any default, damage, costs or problem which may be based on or attributable to: (i) the use of the NVIDIA product in any manner that is contrary to this guide, or (ii) customer product designs.
Other than the right for customer to use the information in this guide with the product, no other license, either expressed or implied, is hereby granted by NVIDIA under this guide. Reproduction of information in this guide is permissible only if reproduction is approved by NVIDIA in writing, is reproduced without alteration, and is accompanied by all associated conditions, limitations, and notices.
Trademarks
NVIDIA, the NVIDIA logo, and cuBLAS, CUDA, CUDA-GDB, CUDA-MEMCHECK, cuDNN, cuFFT, cuSPARSE, DIGITS, DGX, DGX-1, DGX Station, NVIDIA DRIVE, NVIDIA DRIVE AGX, NVIDIA DRIVE Software, NVIDIA DRIVE OS, NVIDIA Developer Zone (aka "DevZone"), GRID, Jetson, NVIDIA Jetson Nano, NVIDIA Jetson AGX Xavier, NVIDIA Jetson TX2, NVIDIA Jetson TX2i, NVIDIA Jetson TX1, NVIDIA Jetson TK1, Kepler, NGX, NVIDIA GPU Cloud, Maxwell, Multimedia API, NCCL, NVIDIA Nsight Compute, NVIDIA Nsight Eclipse Edition, NVIDIA Nsight Graphics, NVIDIA Nsight Integration, NVIDIA Nsight Systems, NVIDIA Nsight Visual Studio Edition, NVLink, nvprof, Pascal, NVIDIA SDK Manager, Tegra, TensorRT, Tesla, Visual Profiler, VisionWorks and Volta are trademarks and/or registered trademarks of NVIDIA Corporation in the United States and other countries. Other company and product names may be trademarks of the respective companies with which they are associated.