1. Inspect State
In this section, learn more about how to use various state inspection features of the CUDA Debugger, such as specifying the debugger context, viewing memory and variables, using the CUDA Info View, and using the CUDA Warp Watch.
2. Specify Debugger Context
|
Note: |
This feature is only supported by the Legacy CUDA Debugger. The Next-Gen CUDA Debugger will support this in a future release. |
Program execution in CUDA takes place over hundreds or thousands of threads simultaneously. The CUDA Debugger features the CUDA Focus Picker, which lets you choose the blocks and threads of interest in the currently debugged application.
The Locals and Watch window, as well as the Step Into function use the block and thread of interest as context for their functionality.
2.1. Choose a Block and Thread of Interest
-
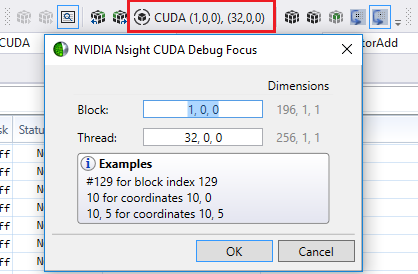
From the Nsight menu, choose Windows > CUDA Debug Focus... to launch the CUDA Debug Focus dialog.
Alternatively, the Nsight CUDA Debug toolbar group’s CUDA focus picker item displays block and thread indexes, and launches the CUDA Debug Focus dialog.
-
Enter the desired block index and thread index in the text fields provided. The block text field will show you valid indices as you type. You can only choose blocks that are currently executing on the GPU hardware.
-
Choose OK.
The Locals and Watch tool windows show variables and expressions evaluated in the context of the newly chosen thread.
|
Note: |
The Focus Picker affects the behavior of breakpoints. Breakpoints are initially unconditional. When the debugger encounters the first breakpoint, the location of the breakpoint becomes the focus for all debugging. Stepping and breakpoints are set on the focus thread. This resets on the next kernel launch, going back to unconditional breakpoints. For example, if the current focus is Block(0,0,0):Thread(5,2,0), then breakpoints will only hit when block and thread indices match the current focus indices. |
2.2. Which Thread Has Focus?
Consider how threads grab focus in the CUDA Debugger. For example, the debugger can change focus to another thread without notifying you. If the focus thread is not at a breakpoint, and a different thread hits a data breakpoint, conditional breakpoint, or an unconditional breakpoint, the CUDA Debugger changes the current focus thread.
For example, if stopped in block (0,0,0) and thread (0,0,0) and a breakpoint hits in block (1,0,0) thread (0,0,0), the debugger will switch to the new thread. The debugger does not switch the focus thread when stepping, since the other threads are frozen.
3. How To: View Memory
The NVIDIA Nsight VSE Legacy and Next-Gen CUDA Debuggers support the Visual Studio Memory window for examining the contents of memory on a GPU. The CUDA Debugger supports viewing shared, local, and global memory on the current state of CUDA within the process that is being debugged.
While the Next-Gen Debugger also supports memory viewing while CPU debugging, this section only discusses GPU memory. To view GPU memory while at a CPU breakpoint or exception, you must change the thread focus to a CUDA Thread. If no GPU thread is running, the Source window will show Code not running.
You can view values in GPU memory only when running a CUDA application, with the target application halted at a breakpoint in CUDA source code. Keep the following in mind:
Shared Memory:
- Is accessible by any thread of the block from which it was created.
- Has the lifetime of the block.
Local Memory:
- Is only accessible by the thread.
- Has the lifetime of the thread.
Global Memory:
- Is accessible from either the host or the device.
- Has the lifetime of the application.
3.1. View the Contents of GPU Memory
To View the Contents of Global Memory
-
From the Debug menu, choose Windows > Memory.
-
Select one of the Memory windows. The Memory window opens or grabs focus if already opened.
-
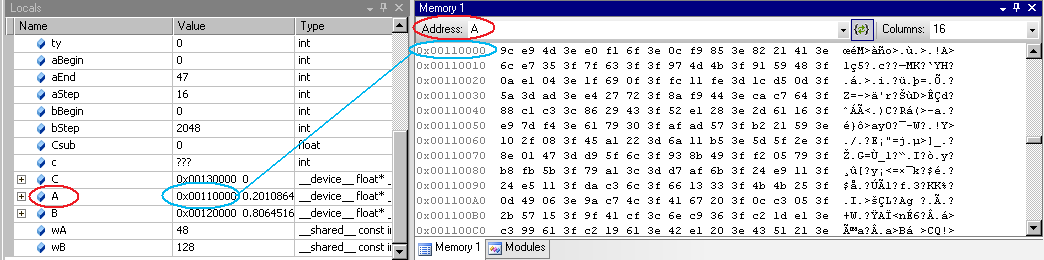
In the Address field of the Memory window, type the GPU memory address you want to see.
Type either the hexadecimal value or the name of a valid pointer that is in the current lexical scope.
-
Press the Enter key. The Memory window shows the contents of memory beginning with the specified address.
|
Note: |
Tip: Right-click on the Memory window to change the way memory contents are displayed, including displaying memory contents as floating-point numbers. |
3.2. View Variables in Locals Window in Memory
-
Start the CUDA Debugger.
-
From the Nsight menu in Visual Studio, choose
-
Start CUDA Debugging (Legacy)
-
Start CUDA Debugging (Next-Gen)
For information on choosing the correct debugger for your system configuration see the System Requirements page.
Alternatively, these debugging sessions may be started by:
-
Right-click on the project in Solution Explorer and select the Debug submenu.
-
Click on the associated icon in the Nsight CUDA Debug toolbar.
-
Select the associated item in the Nsight Connections drop-down list.
-
-
Pause execution or allow the application to run to a breakpoint, or set a breakpoint if none enabled.
-
-
From the Debug menu, choose Windows > Memory > Memory Window 1.
The Memory window opens.
-
Click and drag a variable from the Locals window onto the Memory window.
The Memory window displays the values at the addresses that correspond to the variable (or pointer).
-
Alternately, you can type the name of the variable into the Address field of the Memory window.
-
When viewing memory in __local__, __const__ or __shared__ make sure the Visual Studio Memory view is set to Re-evaluate automatically. This will ensure that the memory shown is for the correct memory space. Without this, the display can change to an address which defaults to global memory.
NOTE: You cannot change the value in GPU memory by editing the value in the Locals window.
3.3. View Variables in Watch Window in Memory
- Start the CUDA Debugger.
-
From the Nsight menu in Visual Studio, choose
-
Start CUDA Debugging (Legacy)
-
Start CUDA Debugging (Next-Gen)
For information on choosing the correct debugger for your system configuration see the System Requirements page.
Alternatively, these debugging sessions may be started by:
-
Right-click on the project in Solution Explorer and select the Debug submenu.
-
Click on the associated icon in the Nsight CUDA Debug toolbar.
-
Select the associated item in the Nsight Connections drop-down list.
-
-
Pause execution or allow the application to run to a breakpoint (or set a breakpoint if none are enabled).
-
-
From the Debug menu, choose Windows > Watch.
-
Select one of the Watch windows. The Watch window opens or grabs focus if already opened.
-
Click and drag a variable from the Watch window onto the Memory window. The memory window displays the values at the addresses that correspond to the variable (or pointer).
4. How To: View Variables
NVIDIA Nsight VSE supports the standard Visual Studio Locals window for examining the value of local variables in CUDA source code, and the Watch window for interactively evaluating expressions.
The information in the Locals window and Watch window are available in the CUDA Debugger only when:
-
A CUDA-based application is running, and
-
Application execution is halted while executing CUDA source code.
-
When not restricted by a private/internal library. As an example, see OptiX restrictions, especially as they apply to viewing variables.
4.1. View the Value of a Local Variable
-
Start a debugging session.
-
In Visual Studio, open a CUDA-based project.
-
Define at least one breakpoint.
-
From the Nsight menu, choose
-
Start CUDA Debugging (Legacy)
-
Start CUDA Debugging (Next-Gen)
For information on choosing the correct debugger for your system configuration see the System Requirements page.
Alternatively, these debugging sessions may be started by:
-
Right-click on the project in Solution Explorer and select the Debug submenu.
-
Click on the associated icon in the Nsight CUDA Debug toolbar.
-
Select the associated item in the Nsight Connections drop-down list.
Your applications starts and the CUDA Debugger launches, stopping at the first breakpoint encountered.
-
-
Pause execution or allow the application to run to a breakpoint, or set a breakpoint if none enabled.
-
-
From the Debug menu, choose Windows > Locals. The Locals window opens.
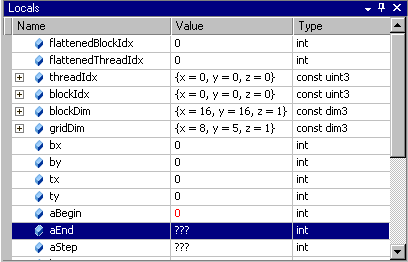
The Locals window shows the list of variables, their assigned values, and type in the current lexical scope.
|
Note: |
The block and thread indices are exposed in the blockDim and the threadIdx variables. |
|
Note: |
Variables that have not yet been initialized show triple question marks as their value: ??? |
4.2. Evaluate the Value of an Expression
-
From the Debug menu, choose Windows > Watch > Watch1 to open or focus the Watch window.
-
Left-click on the expression portion of the window.
-
Type any valid expression recognized by the debugger. The expression can contain any variable valid at the current execution location.
-
Press the Enter key.
The CUDA Debugger evaluates the expression displayed in the Name column, and places the result in the Value column.
If the expression refers to a variable that is not valid at the current execution location, the expression value displays an error message.
If the expression is a variable, you can edit the value in this column to change the contents of the variable. You cannot edit the value of const variables. The right column of the Watch window shows the value to which the expression evaluates.
|
Note: |
The CUDA Debugger supports a significant percentage of C++ expression syntax, including:
|
|
Note: |
To use a register in the variable Watch Window or in a conditional breakpoint, specify the register a capital R, and the decimal (not hex) register number. For example: R9 or R10. In the Next-Gen CUDA Debugger, you may also preface with a $ to differentiate from variables with equivalent names. For example: $R9 or $R10. You may also hover over a register in the disassembly view to get a tool tip providing the register value. Next-Gen CUDA Debugger: see also the Next-Gen CUDA Debugger registers view, and the Visual Studio debugger registers view. Legacy CUDA Debugger: see the Visual Studio debugger registers view. |
4.3. Configure Formatting of Expressions
-
From the Nsight menu, choose Nsight Options.
-
Select the Debugger group in the left pane of the Nsight Options window.
-
Mark the options that you want to enable.
5. Legacy CUDA Info View
The CUDA Info View shows information on the current state of CUDA within the process that is being debugged.
|
Note: |
Applications built with the OptiX framework restrict debugging and profiling capabilities. See Restrictions when Debugging and Profiling OptiX Applications. |
To View the CUDA Information Tool Window:
-
Launch the Legacy CUDA Debugger.
-
Open a CUDA-based project.
-
Make sure that the Nsight Monitor is running on the target machine.
-
From the Nsight menu, select Start CUDA Debugging (Legacy). Or you can use one of the following alternate methods:
-
Right-click on the project in Solution Explorer and choose Debug > Start CUDA Debugging (Legacy)
-
Nsight CUDA Debugging toolbar > Start CUDA Debugging (Legacy)
-
Nsight Connections toolbar > Start CUDA Debugging (Legacy)
-
-
The Legacy CUDA Debugger starts and launches the target application.
-
-
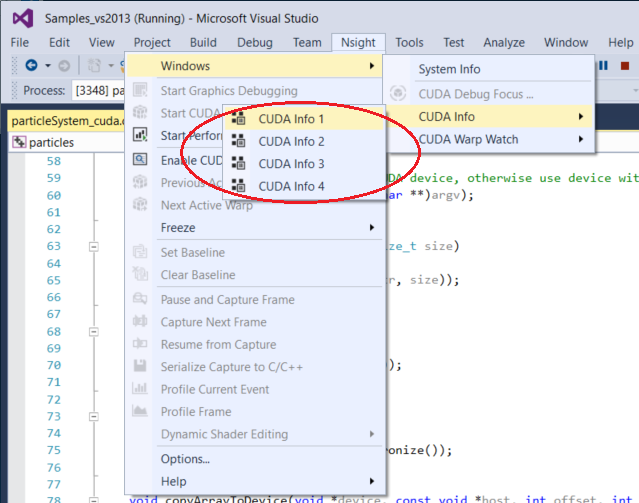
From the Nsight menu, choose Windows > CUDA Info. Select the CUDA Info page that you wish to open.
5.1. General Features of the CUDA Information Tool Window
Viewing Rows
This displays the number of rows in the current view. If the view is filtered, the number shown may be less than the number of total rows.
Hyperlinks
A hyperlink will use a specific filter to jump the current tool window to another page. For example, clicking a link in the Modules column will link you to the Modules tool window.
Filtering Results
Use $("Column Name") to specify by the exact name of the column, including spaces. The column name must be quoted.
-
For example, in the Warps Page: $("Active Mask") == 0xffffffff
The results in each page can be filtered by an expression. This leads to shorter expressions.
-
For example, in the Warps Page: Status=="Breakpoint" && FlatBlockIdx > 30
Other tips for filtering:
-
To see an auto-completion window, type the first letter of the column. Use Reset Filter to clear the current filter for the page.
-
To find all functions with a certain string, you can use Name.StartsWith("bar"), Name.Contains("bar"), Name.Endswith("bar"), and ! operations.
-
Filters that have been created by hyperlinks are not persisted between debug sessions. This is because these often have specific identifiers, such as context or module IDs, which would not make sense in the next debug session. However, any filter that is created by a user will persist with the page, whether it contains unique IDs or not.
Persistence
When debugging, each page will persist the last state that it was displaying. Any filters that have been created by clicking on a hyperlink will not be persisted in the next debug session.
Focus
To update the current focus in the Warps and Lanes pages, you can use any of the following methods:
-
CUDA Focus Picker
-
Next Warp or Previous Warp commands
These commands are available either from the Nsight menu in Visual Studio, or from the Nsight toolbar.
-
Using Set Focus in the Warp page
This is available by double-clicking or right-clicking on the thread and selecting Set-Focus.
Using right-click > Set Focus, or double-clicking elsewhere in the same row, will go to the first active thread in the selected warp, as indicated by the threadIdx value of that row.
-
Using Set Focus in the Lanes page
This is available by double-clicking or right-clicking on the thread and selecting Set-Focus.
5.2. CUDA Info Tool Window Pages
There are several pages within this tool window that allow you to view different aspects of your CUDA application that is being debugged.
The CUDA Information tool window pages include the following:
Arrays
The Arrays page shows information about all arrays in the process that is being debugged.
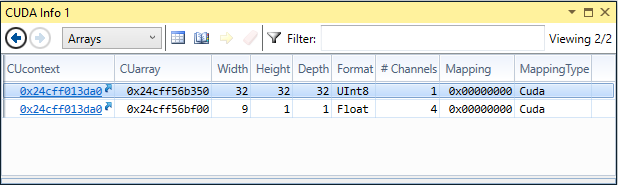
For more information on the Arrays page, see CUDA Arrays.
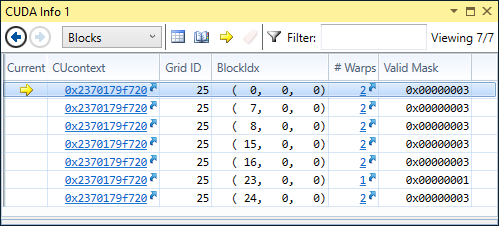
Blocks
The Blocks page shows all active blocks in the current kernel running on the GPU. The link in the CUcontext column will open the Contexts page. The hyperlink in the # Warps column will jump to the Warps page, filtered to the specific block.
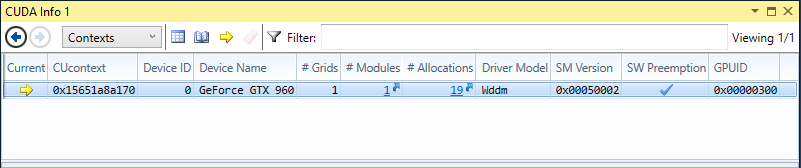
Contexts
The Contexts page shows information about all contexts on all GPUs in the process that is currently being debugged. Information on this page is always available, even when the process has not been stopped.
Note that the SW Preemption column is used to show if the application is using software preemption (on a single GPU) or non-preemption (either classic or hardware).
For more information on CUDA context object types, see CUcontext.
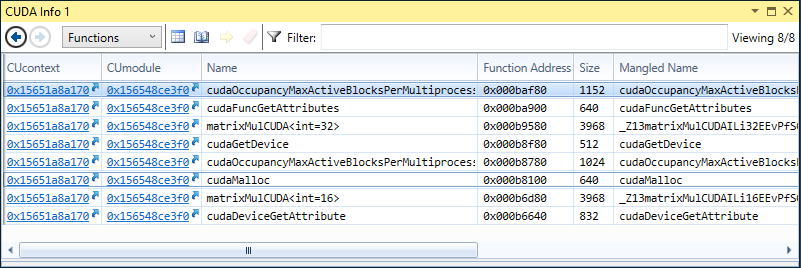
Functions
The Functions page shows information about all functions in all loaded modules. Information on this page is always available, even when the process has not been stopped.
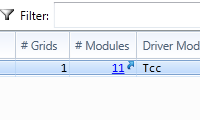
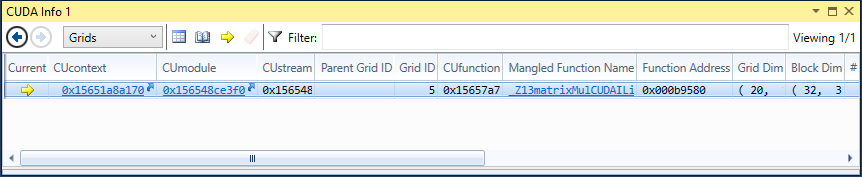
Grids
The Grids page shows all active and queued kernels on the GPU. The current kernel will have a # Blocks greater than 0. Other kernels will show # Blocks set to 0.
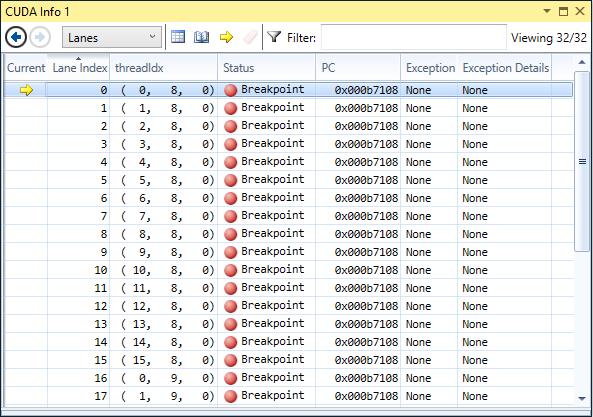
Lanes
The Lanes page displays information about all lanes in the current focus warp. A lane is a single thread in one warp.
The current state of the lane is shown as a barrier in the Status column.
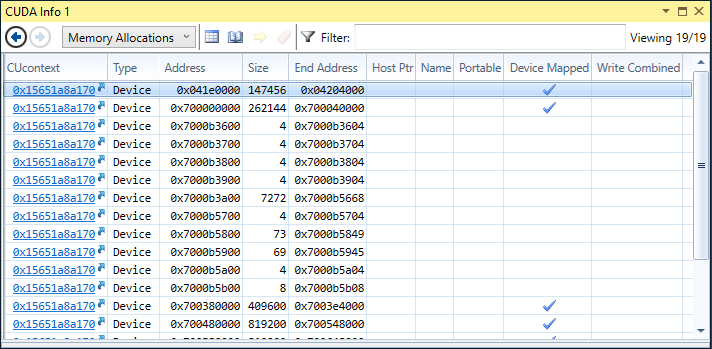
Memory Allocations
This page shows information for all CUDA global memory allocations, in all CUcontexts in the application. This page automatically updates when suspended in a kernel.
Like other pages, the results can be filtered. For example:
CUcontext==0x02c8c258
MemoryAllocationType == "Host" && Size > 100
A few columns to note on this page include the following:
-
CUContext — The context that contains this memory allocation.
-
Type — Device or Host. Device is used when the user includes any device side allocation call (e.g. cudaMalloc). Host is used for any memory allocated from the host mapped on the device (e.g., cudaHostAlloc, cudaHostRegister, or other CUDA API calls).
-
Address — The device side address. For an allocation where the type is "Host," this device side address may be retrieved from the HostPtr address via cudaHostGetDevicePointer.
The Host Ptr is as follows:
-
For Device allocations, this is 0x00000000.
-
For Host allocations, this will have the address returned from the cudaHostAlloc, cudaHostRegister, or other host mapping function.
-
-
End Address — Simply the address plus size (exclusive end range).
-
The Name column may be used in the future for named memory allocations.
-
Portable, Device Mapped, and Write Combined flags will be filled in where used with the associated cudaHostAlloc or cudaHostRegister call.
Right-click on a particular line and select Set Memory View Expression to open the Memory window.
Modules
The Modules page displays information about all modules in all contexts. The information shown here matches the modules that are seen in the Visual Studio Modules view. Information on this page is always available, even when the process has not been stopped.
Tips for using the Modules page:
-
Filtering results: Use HasSymbols to see only the loaded modules that have symbols.
-
Any module without symbols will not be able to hit a breakpoint in a kernel.
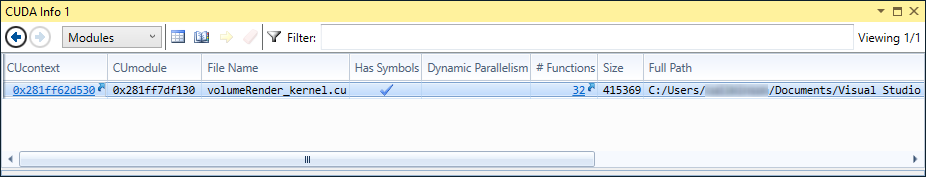
The Dynamic Parallelism column shows whether there is a nested kernel launch, in which a kernel launches another kernel. For more information, see CUDA Dynamic Parallelism.
Surfaces
The Surfaces page provides details on all of the CUDA surface object handle types per CUDA context.
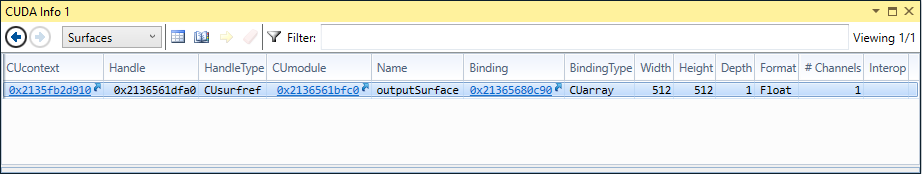
For more information, see Surface Object API.
Textures
The Textures page provides details on all of the CUDA texture object handle types per CUDA context.
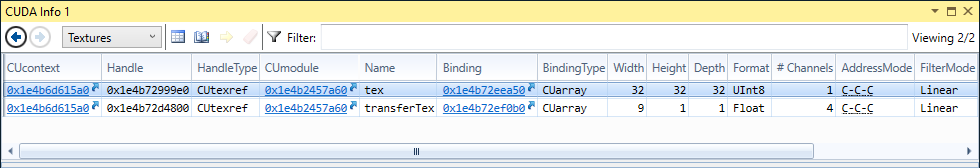
For more information, see Texture Object API.
Warps
The Warps page displays all active warps on the GPU. Each row represents one warp, and the Lanes column displays information about all lanes for each of the warps in the view. A lane is a single thread in one warp. The Lanes column gives per-lane details about any warp exceptions; the current state is shown in the Lanes column.
Focus
-
The current focus is denoted by a yellow arrow in the Lanes column.
-
Focus changes affect the position of the yellow arrow with respect to Warp row and Lane column thread. Other columns are unaffected on focus changes.
-
Changing the Warp or Lane focus, will also update other views (i.e., Locals, Watch, Callstack, ...).
-
Thread focus can be manually changed using one of the methods outlined in the Focus section.
-
Hovering your cursor over a row in the Lanes column will produce a tool tip with the state of the lane.
-
The user can switch to either active or inactive lanes; however, the focus cannot be changed to Not Launched lanes.
-
The user can freeze specific warps within the warps page itself. This set of frozen warps is managed separately from the global freeze control. Freezing warps 1, 2, and 3, and then toggling the global freeze state will leave those warps frozen. (See How To: Use the Global Freeze Page for more details.)
|
Note: |
Frozen warp rows are disabled and have Warp in the Frozen column. |
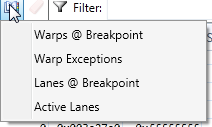
Filtering results:
-
Use the Warp Exceptions bookmark to filter to only the warps currently in an exception state.
-
Use the Warps @ Breakpoint bookmark to filter to only the warps that have hit a breakpoint.
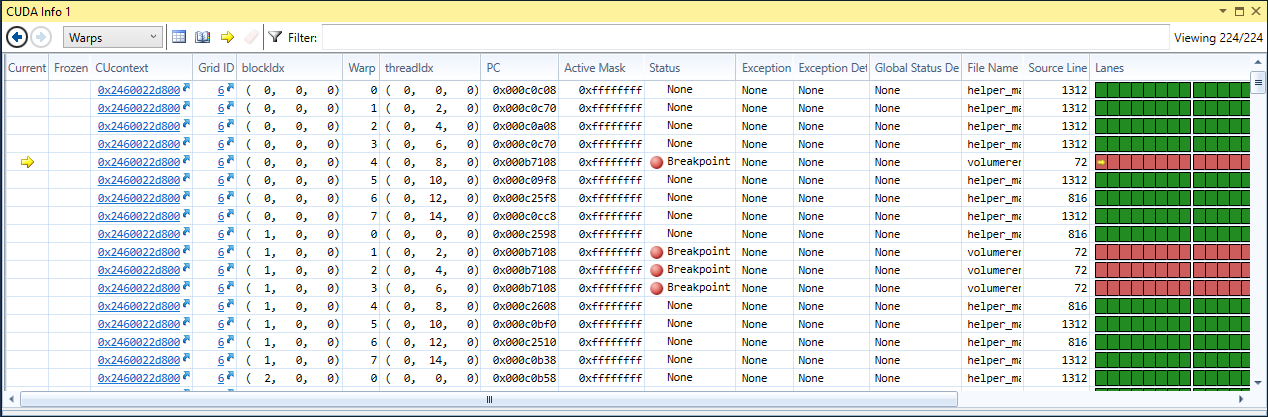
The color legend for the Lanes column is as follows:
Color Thread State Gray Inactive Forest Green Active Light Sea Green At Barrier Red At Breakpoint Orange At Assert Dark Red At Exception Dark Gray Not Launched Light Gray Exited
For more information on the Warps page, see the Example Scenarios of the CUDA Warp Watch section.
6. Next-Gen State Inspection Views
NVIDIA Nsight Visual Studio Edition2020.1 brings developers unprecedented application development capabilities, combining native Visual Studio CPU and CUDA GPU debugging within the same debugging session. This new debugging architecture extends Nsight's capabilities to the latest Volta GPUs, while providing a seamless, homogeneous debugging experience on GPU kernels and native CPU code.
The Next-Gen CUDA Debugger provides a number of independent tool windows to inspect the target application's state.
| INFO: The Next-Gen CUDA Debugger is designed to work with Pascal, Volta, and Turing family GPUs with the latest drivers and operating systems. Some Legacy CUDA Debugger features, older GPUs, drivers, and OSs may not be supported. Please refer to the system requirements for the differences between the Legacy CUDA Debugger and the Next-Gen CUDA Debugger to determine which one fits your needs. |
To View the Next-Gen CUDA Information Tool Windows:
-
Launch the Next-Gen CUDA Debugger.
-
Open a CUDA-based project.
-
Make sure that the Nsight Monitor is running on the target machine.
-
From the Nsight menu, select Start CUDA Debugging (Next-Gen). Or you can use one of the following alternate methods:
-
Right-click on the project in Solution Explorer and choose Debug > Start CUDA Debugging (Next-Gen)
-
Nsight CUDA Debugging toolbar > Start CUDA Debugging (Next-Gen)
-
Nsight Connections toolbar > Start CUDA Debugging (Next-Gen)
-
-
The Next-Gen CUDA Debugger starts and launches the target application.
-
-
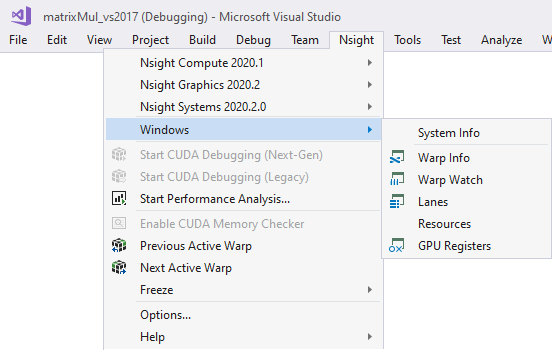
From the Nsight menu, choose Windows to select a supported tool that will allow you to inspect the state of the target application (Warp Info, Lanes, Warp Watch, Resources, or GPU Registers).
6.1. General Features of the Next-Gen CUDA Information Tool Window
Filtering Results
There are two modes that can be used to create filters:
-
JavaScript Mode — Create JavaScript expressions using the exact name of the column, including spaces, in the format $("Column Name"). Typing '$' will produce a list that can be used to select a pre-formatted column name.
$('Grid ID') == 2 || $('BP Hit Mask') == 1$('Active Mask') == 80000000$('Active Mask') != "FFFFFFFF" && $('Status') == "Breakpoint")$('Status').match(/breakpoint/i)(function (a, b) { return a.toLowerCase() == b.toLowerCase(); })($("Status"), "breakpoint") -
RegEx Mode — Create regular expressions to match the (case insensitive) text of the desired row's cells
-
^8 : filters for rows that have cells with strings beginning with '8'
-
point : filters for rows that have cells with strings containing 'point'
-
Focus
To update the current CUDA thread focus in the Warp Info and Lanes pages, you can use any of the following methods:
-
Next Warp or Previous Warp commands
These commands are available either from the Nsight menu in Visual Studio, or from the Nsight toolbar.
-
Using Set Focus in the Warp page
This is available by double-clicking on the thread (lane of a warp).
-
Using Set Focus in the Lanes page
This is available by double-clicking on the thread (lane of a warp).
6.2. Next-Gen CUDA Debugger Tool Windows
There are several pages within this tool window that allow you to view different aspects of your CUDA application that is being debugged.
The CUDA Information tool window pages include the following:
6.2.1. Warp Info
The Warp Info page displays all active warps on the GPU. Each row represents one warp, and the Threads column displays information about all lanes (sub-columns) for each of the warps (rows) in the view. A lane is a single thread in one warp. The Threads column gives per-lane details about any warp exceptions; the current state is shown in the Threads column.
Focus
-
The current focus is denoted by a yellow arrow in the Threads column.
-
Thread focus can be manually changed using one of the methods outlined in the Focus section.
-
Focus changes affect the position of the yellow arrow with respect to Warp row and Thread column thread. Other columns are unaffected by focus changes.
-
Changing the Warp or Lane focus, will also update other views (i.e., Locals, Watch, Callstack, ...).
-
The user can switch to either active or inactive lanes; however, the focus cannot be changed to Not Launched lanes.
-
The user can freeze specific warps within the warps page itself. This set of frozen warps is managed separately from the global freeze control. Freezing warps 1, 2, and 3, and then toggling the global freeze state will leave those warps frozen. (See How To: Use the Global Freeze Page for more details.)
|
Note: |
Unlike the Legacy CUDA Debugger, frozen warp rows are not disabled and there is no Frozen column. This indicator will be added in a future version. |
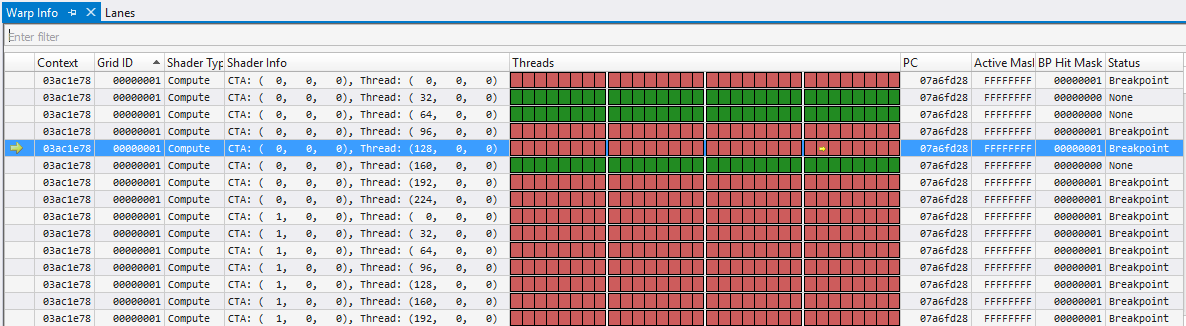
The color legend for the Threads column is as follows:
Color Thread State Gray Inactive Forest Green Active Light Sea Green At Barrier Red At Breakpoint Orange At Assert Dark Red At Exception Dark Gray Not Launched Light Gray Exited
For more information on the Warps page, see the Example Scenarios of the CUDA Warp Watch section.
6.2.2. Warp Watch
The Warp Watch page displays information about the current state of watched variables in all warps.
For more information, see the Warp Watch documentation, common to both Next-Gen and Legacy CUDA Debuggers.
Next-Gen CUDA Debugger Tool Windows
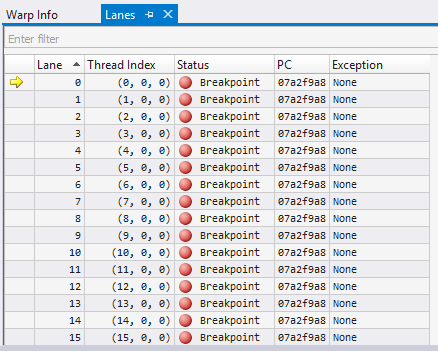
The Lanes page displays information about all lanes in the current focus warp. A lane is a single thread in one warp.
The current state of the lane is shown as a barrier in the Status column.
Focus
-
The current focus is denoted by a yellow arrow in the first column.
-
Thread focus, and therefore lane focus, can be manually changed using one of the methods outlined in the Focus section.
-
Focus changes affect the row position of the yellow.
-
Changing the Warp or Lane focus, will also update other views (i.e., Locals, Watch, Callstack, ...).
-
The user can switch to either active or inactive lanes; however, the focus cannot be changed to Not Launched lanes.
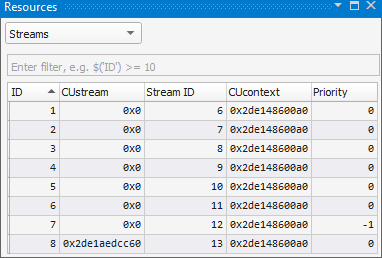
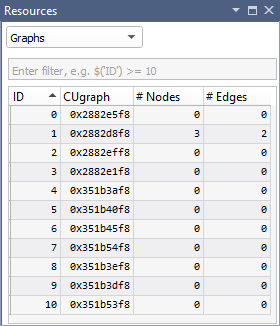
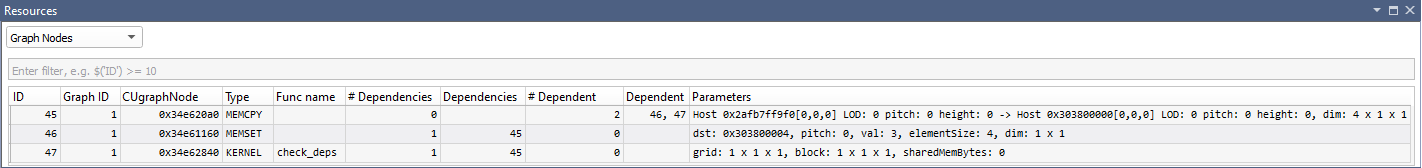
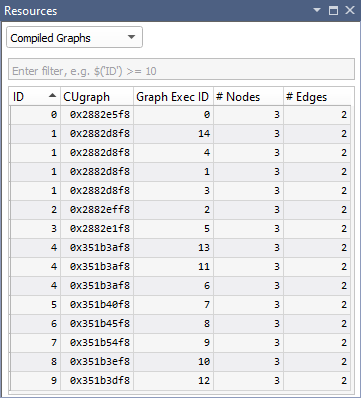
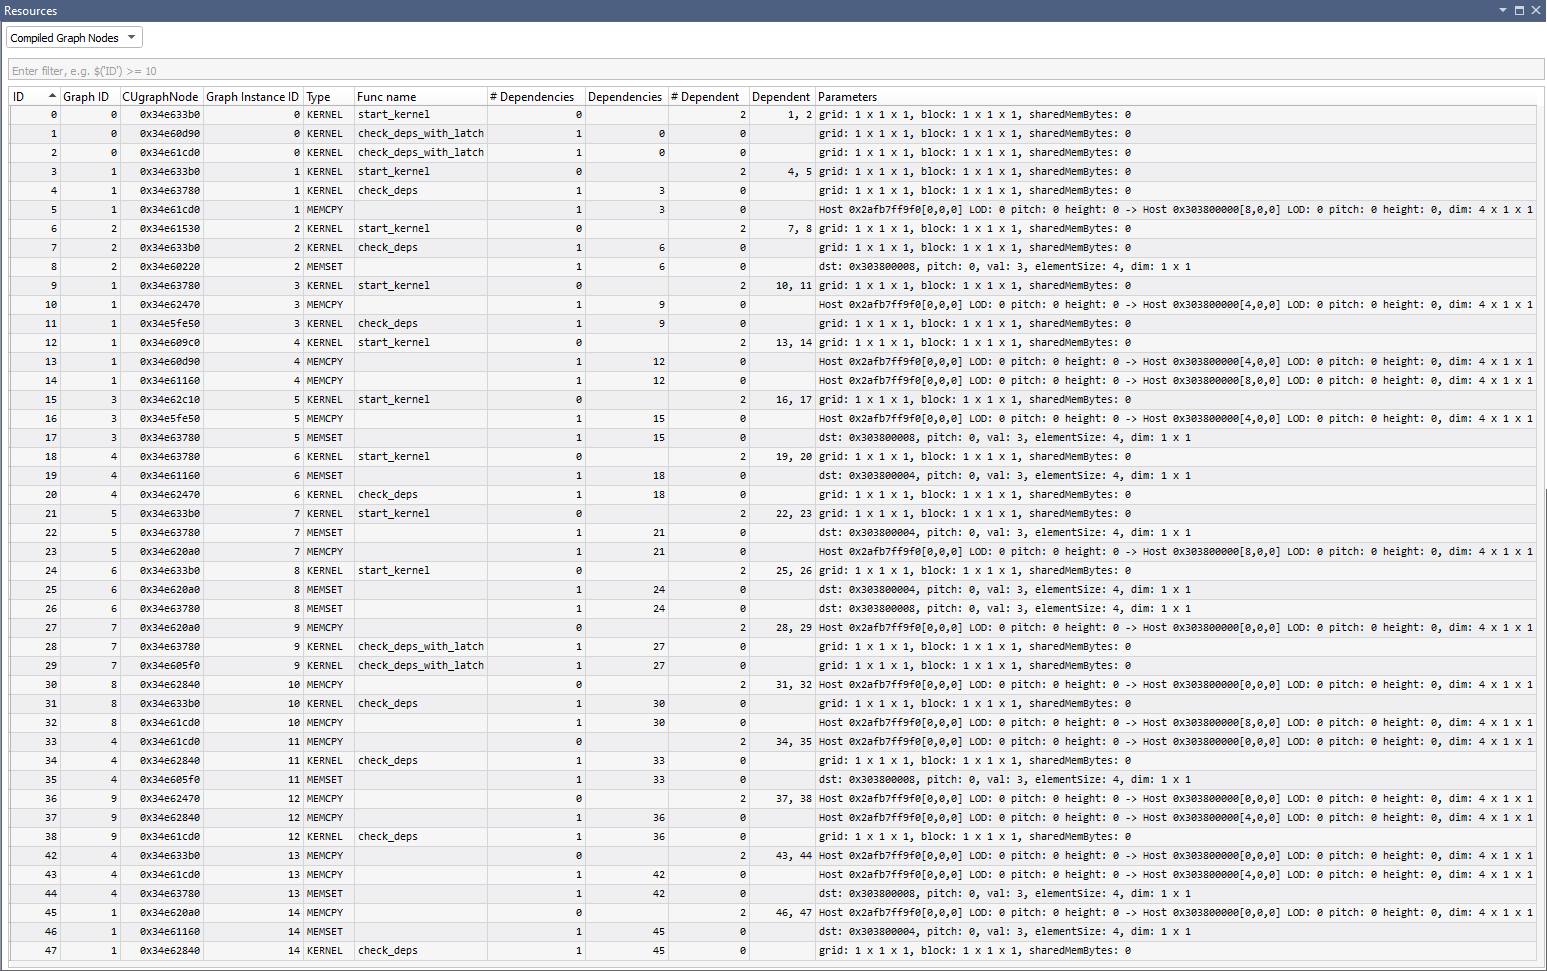
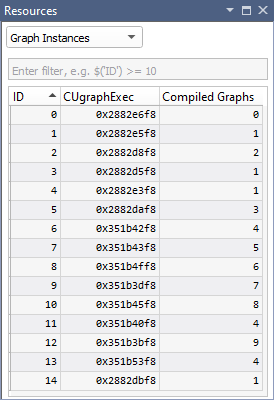
Resources
The Resources view shows the different aspects of the CUDA application that is being debugged.
Using the drop-down on the top, different views can be selected, where each view is specific to one kind of resource (context, stream, kernel, …). The Filter edit allows you to create filter expressions using the column headers of the currently selected resource.
The resource table shows all information for each resource instance. Resources are dynamically added and are available at both runtime and while the target application is suspended. When a resource is destroyed, it is removed from its table.
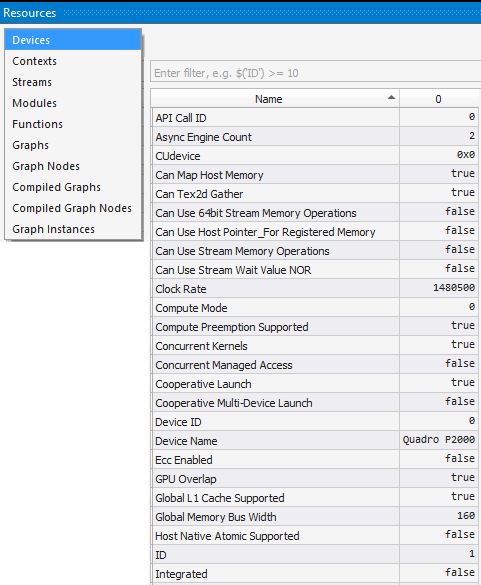
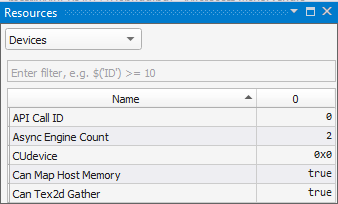
Devices
The Devices setting shows information about the GPU being debugged.
The 1st column represents the ‘Name’ of a device attribute.
The following columns represent the device index after CUDA_VISIBLE_DEVICE device remapping. Device 0 is shown here.
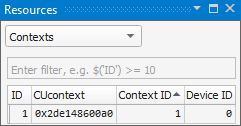
Contexts
The Context setting shows information about all contexts on all GPUs in the process that is currently being debugged. Information on this page is always available, even when the process has not been stopped.
Streams
The Streams setting shows information about concurrent kernel streams, their IDs and priorities.
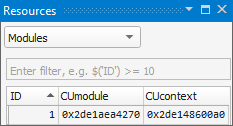
Modules
The Modules setting displays information about all modules in all contexts. The information shown here matches the modules that are seen in the Visual Studio Modules view. Information on this page is always available, even when the process has not been stopped.
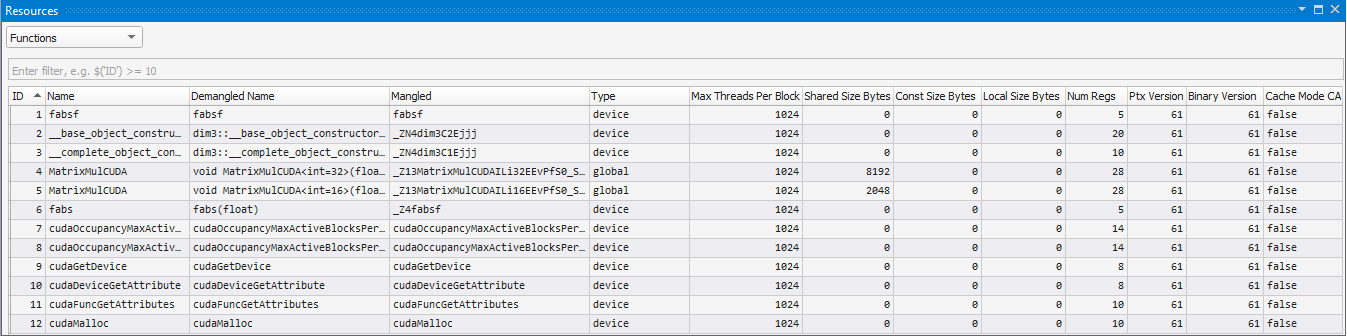
Functions
The Functions setting shows information about all functions in all loaded modules. Information on this page is always available, even when the process has not been stopped.
6.2.5. Registers
The Registers view shows the current state of the GPU registers. If a value has been changed since the last execution break, the register and its value will appear red.
This view is broken into 5 sections:
-
SASS — This section shows the shader assembly code registers.
-
Predicate — These registers show the current predication state for the current thread.
-
Condition Codes — Logical condition codes base on the last executed instruction.
-
PTX — Shows PTX registers.
-
PTX loc — Shows in-scope GPU PTX registers.
NOTE: Condition Code registers are not available on Volta family GPUs or later.
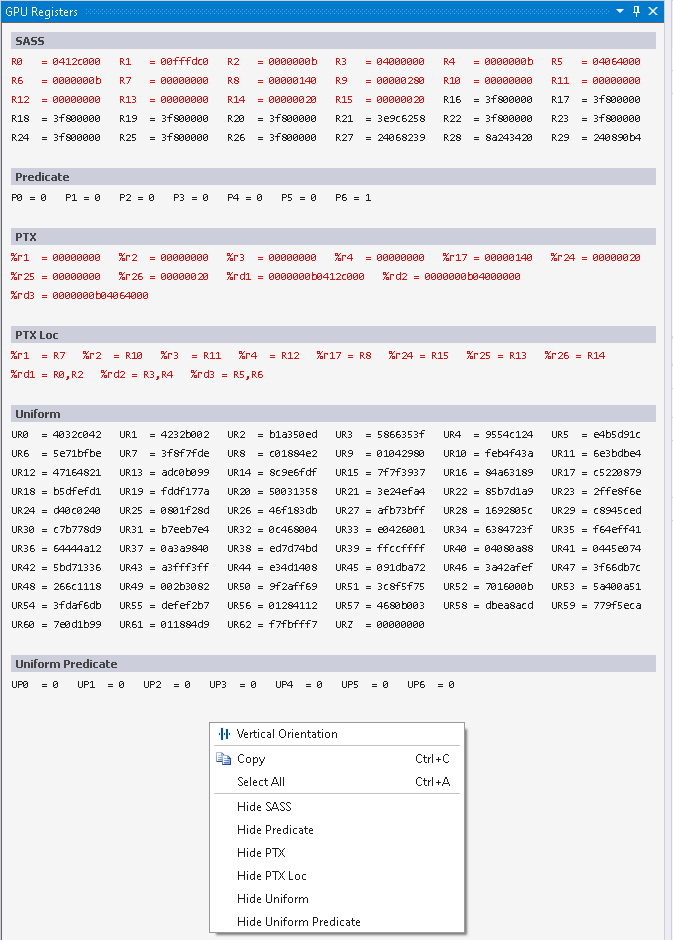
You can right-click on the Registers view to configure the view, or to copy the contents to the clipboard.
|
Note: |
To use a SASS register in the variable Watch Window or in a conditional breakpoint, specify the register a capital R, and the decimal (not hex) register number. For example: R9 or R10. In the Next-Gen CUDA Debugger, you may also preface with a $ to differentiate SASS registers from variables with equivalent names. For example: $R9 or $R10. You may also hover over a SASS register in the disassembly view to get a tool tip providing the register value. |
|
Note: |
PTX registers and variables may be used in the Watch Window, by prefixing the register or variable with % symbols. For example: %R17. Currently, you cannot use PTX registers for conditional breakpoints. Note that sometimes PTX registers may span SASS register pairs, as indicated by the following format: <PTX register double> = <SASS register>,SASS register>), for example %rd3 = R6,R7 If the application is not built with the nvcc flag to generate symbolics information for CUDA kernels, (–G), the PTX registers will be blank. |
|
Note: |
If debugging on a Turing (compute capability 7.5) or later GPU, you will also be able to Hide/Show 'Uniform' and 'Uniform Predicate' registers. Note: To use a Uniform or 'Uniform Predicate' register in the variable Watch Window or in a conditional breakpoint, specify the register a capital UR or UP, and the decimal (not hex) register number. For example: UP9 or UR10. In the Next-Gen CUDA Debugger, you may also preface with a $ to differentiate Uniform registers from variables with equivalent names. For example: $UP9 or $UR10. |
For more information, see the Visual Studio debugger registers view.
7. CUDA Warp Watch
|
Note: |
As of NVIDIA Nsight Visual Studio Edition 2020.1, this feature is supported by both the Next-Gen and Legacy CUDA Debuggers. |
Visual Studio's local and global variable tool windows only support viewing a variable in a single thread at a time. The NVIDIA Nsight VSE CUDA Debuggers use the current focus thread and stack frame to evaluate these expressions.
The Legacy Debugger's CUDA Warp Watch tool window shows information about evaluated expressions of a single focused warp.
To Use the CUDA Debugger Warp Watch Feature:
-
Begin debugging your project in Visual Studio.
-
In Visual Studio, open a CUDA-based project.
-
Define at least one breakpoint.
-
From the Nsight menu, choose Start CUDA Debugging (Legacy or Next-Gen).
Alternately, this debugging session may be started by:
-
Right-click on the project in Solution Explorer and select the Debug submenu.
-
Click on the associated icon in the Nsight CUDA Debug toolbar.
-
Select the associated item in the Nsight Connections drop-down list.
-
-
-
Your application starts, and the CUDA Legacy Debugger launches.
Pause execution, allow the application to run to a breakpoint, or set a breakpoint if none were enabled.
-
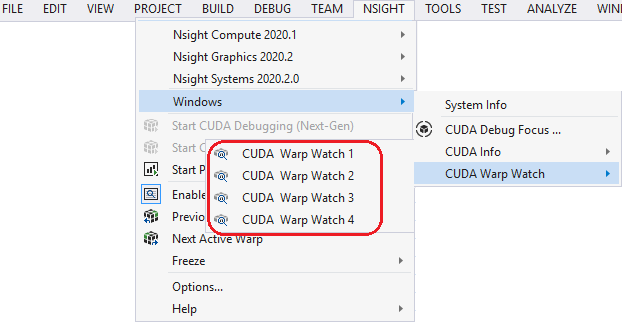
From the Nsight menu, choose Windows > CUDA Warp Watch.
-
Select the appropriate warp watch window.
-
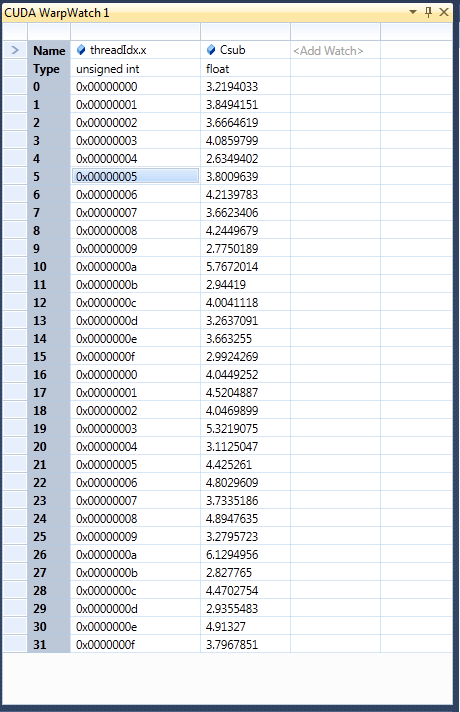
After selecting, you will be presented with a Warp Watch window, in which users can add their own expressions to watch.
Expressions will be evaluated when the CUDA Debugger stops in a kernel by hitting a breakpoint or exception (for example, from the CUDA memory checker).
-
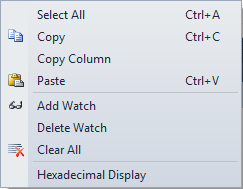
The expressions can be edited from the Warp Watch context menu, by right-clicking on the tool window.
Note:
This context menu is not provided by the Next-Gen CUDA Debugger.
The features shown here include the following:
-
Add Watch — Adds a new expression to the Watch window. (You can use F2 to edit the expression in the current column.)
-
Copy column — This will copy elements to the clipboard so they may be pasted into another document (e.g., a spreadsheet).
-
Delete Watch / Clear All — Deletes the current expression, or deletes all expressions that have been entered.
-
Hexadecimal Display — This menu item controls the Visual Studio global hexadecimal display setting. It is the same setting used in the Visual Studio watch, locals, and autos windows.
-
- The CUDA focus can be changed via one of the following four tool windows:
-
CUDA Focus Picker
-
CUDA Info Pages
-
The Next / Previous warp commands
-
A suspend event
The view updates when the current CUDA focus changes, and always shows the warp that contains the current focus thread.
-
7.1. Example Scenarios
Example: Diverged Warp Watch
In this scenario, the lane is at a different PC than the focus lane. Lanes diverged from focus have a gray background.
|
Note: |
Note this is NOT the same as inactive lanes. You can change to an inactive lane, and the other lanes will show diverged. |
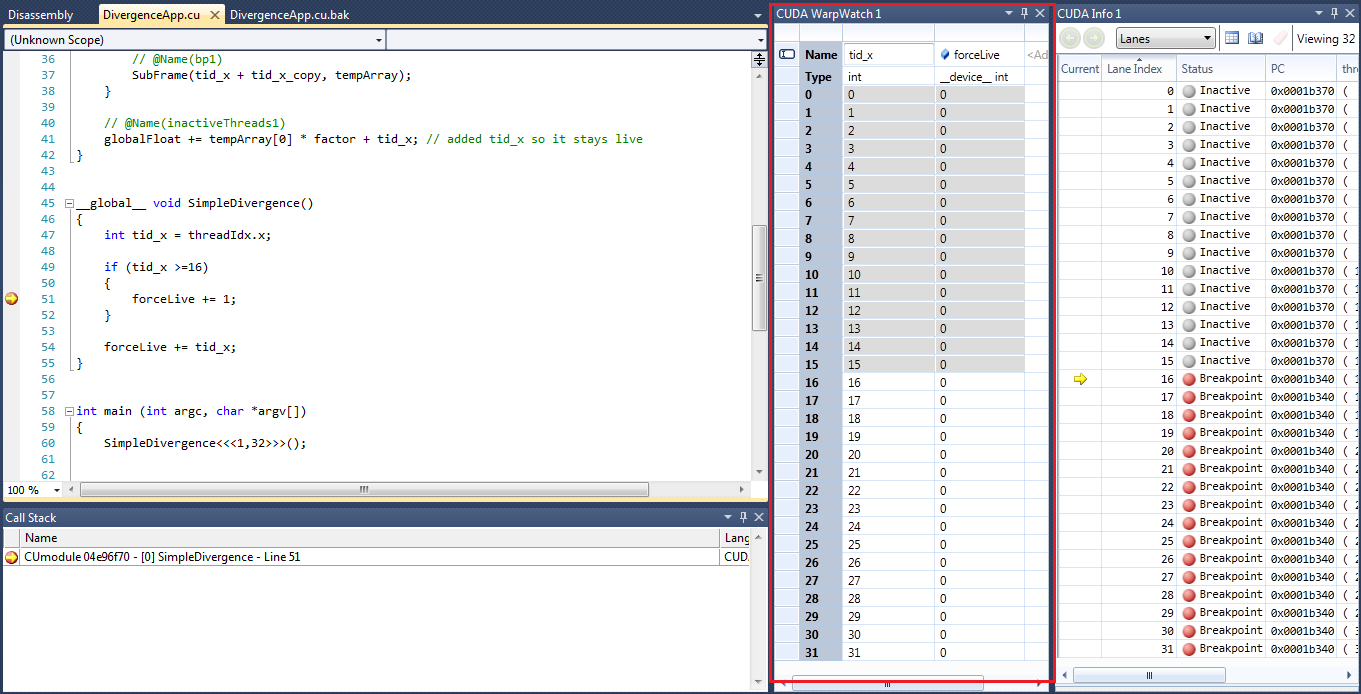 Example 1. An example of a successful evaluation, diverged at lane 16. In this figure, the focus is lane 16.
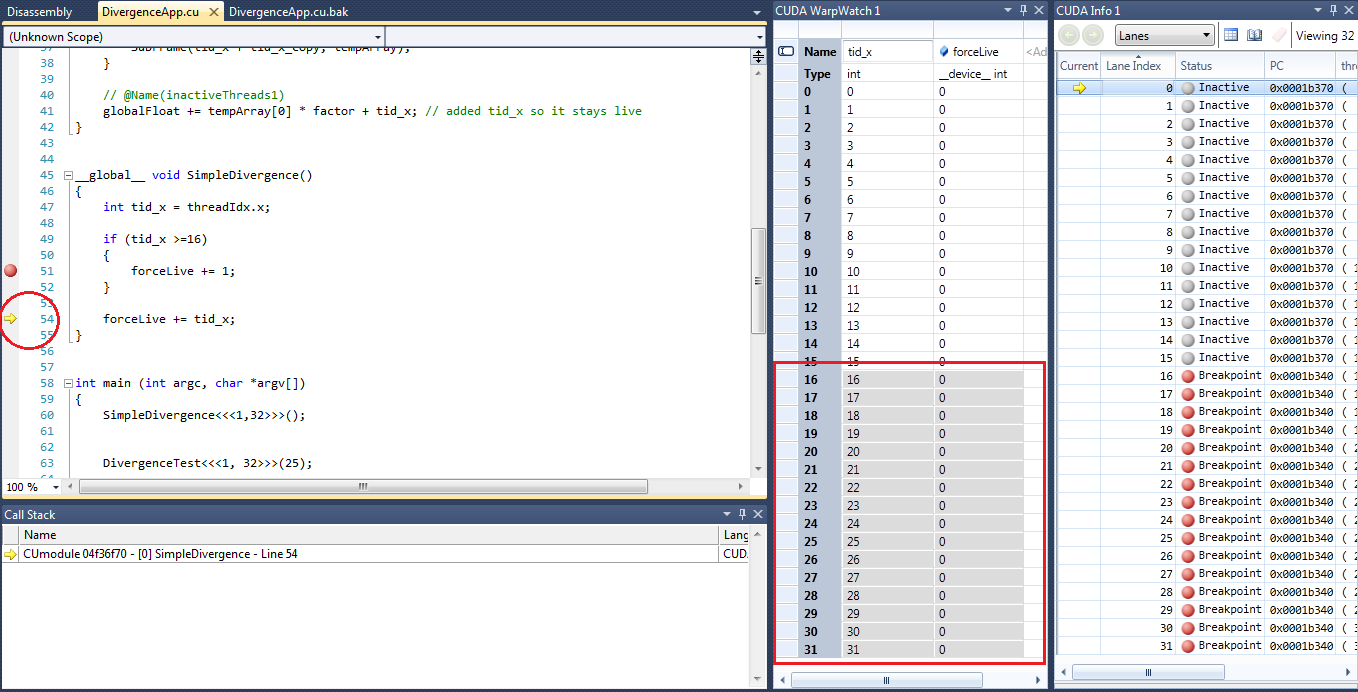 Example 2. Changing to a different focus shows the other lanes as diverged from focus. (This is represented by reversing the white and
gray backgrounds.) In this instance, the lane was changed to 0, so lanes 16-31 are now gray; the PC is at line 54.
Example 2. Changing to a different focus shows the other lanes as diverged from focus. (This is represented by reversing the white and
gray backgrounds.) In this instance, the lane was changed to 0, so lanes 16-31 are now gray; the PC is at line 54.
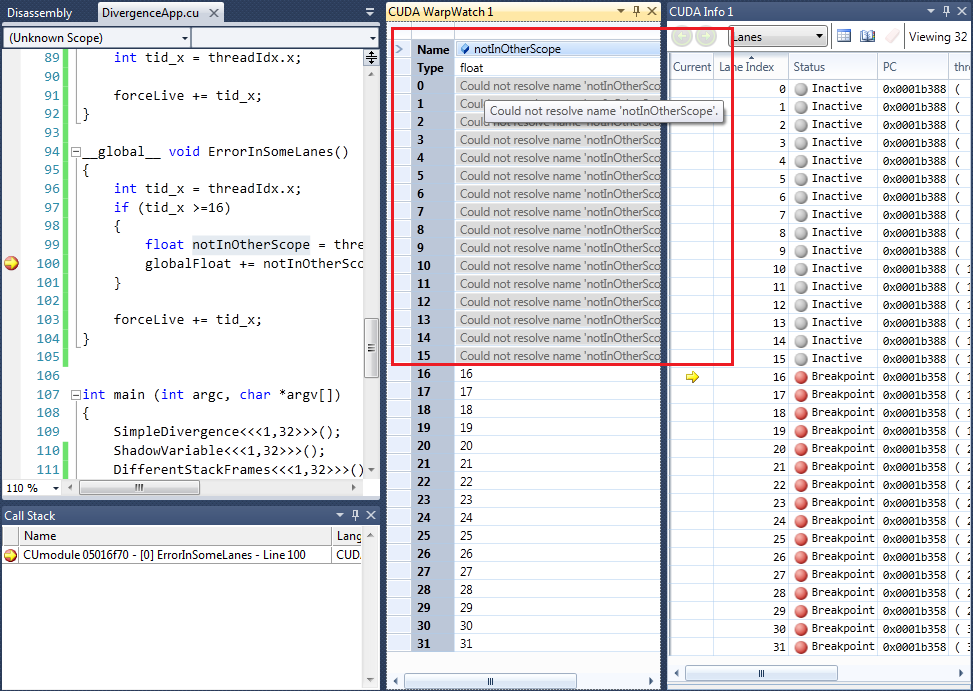 Example 3. Here, you can see that it is possible to have a variable that is valid in some lanes, but not in others.
Example: Error Types
Errors can occur for various reasons within the warp watch. For example:
- A lane may be at a different PC; hence the evaluation scope of a given expression could be different.
- A shadow variable could be a different type than the focus lane.
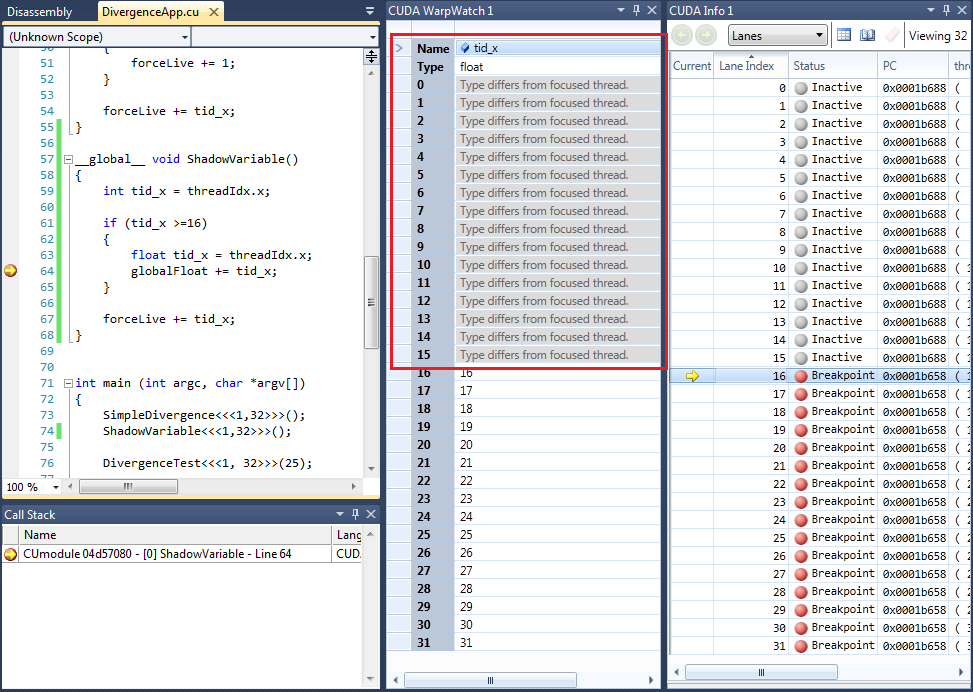 Example 4. This illustrates a shadow variable error. Here, the focus variable's type is float, but it is shadowing an int.
Another common cause for error is when the lane has diverged from the focus lane and is in a different stack frame. The CUDA Warp Watch feature does not evaluate in other stack frames.
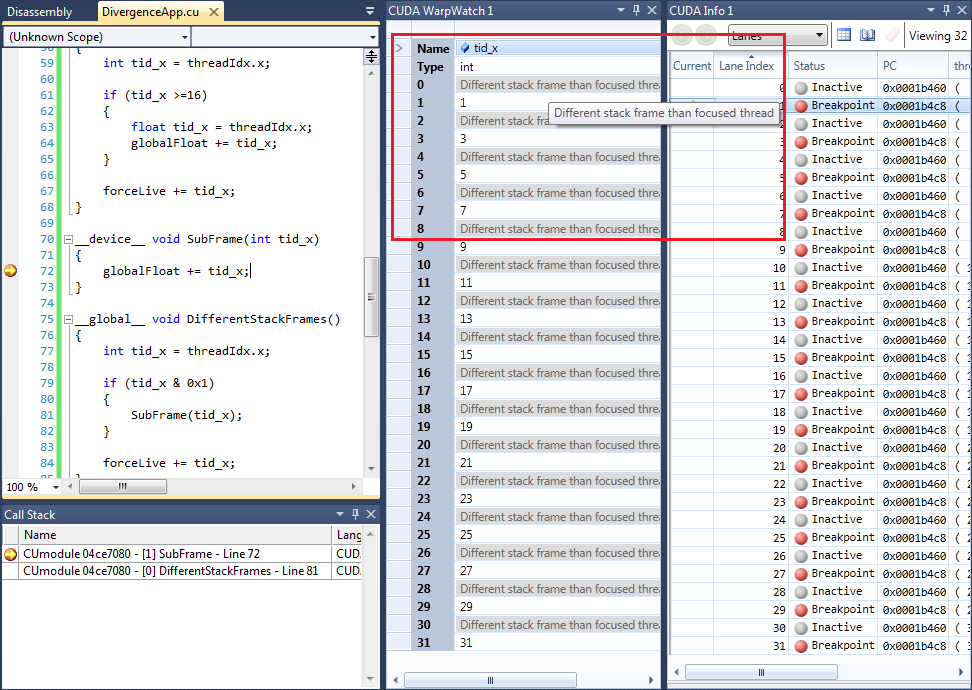 Example 5. This illustrates a stack frame error. Here, the frame "SubFrame" does not exist in the even lanes, hence it cannot evaluate.
8. GPU Core Dump Files
|
Note: |
Note: The Legacy CUDA Debugger does not support debugging with OptiX application core dumps. See Restrictions When Debugging and Profiling OptiX Applications: |
NVIDIA Nsight VSE supports debugging CUDA GPU core dumps. To use this feature, there are 3 requirements:
-
The GPU driver needs to be in TCC mode.
-
The system environment variable CUDA_ENABLE_COREDUMP_ON_EXCEPTION=1 needs to be set.
-
Generate GPU debug information needs to be enabled in the CUDA Project Properties, and the application needs to be compiled with -G in the command line arguments.
-
The specified GPU CUDA Debugger supports the GPU architecture on which the core dump was generated.
-
Legacy CUDA Debugger supports Kepler, Maxwell, and Pascal GPUs.
-
Next-Gen CUDA Debugger supports Pascal, Volta, and Turing GPUs.
-
The GPU core dump will be generated as a *.nvcudmp file in the same directory as the executable. You can open this generated file (or a core dump file that was previously generated) in Visual Studio, either from the File > Open menu, or by dragging and dropping it into Visual Studio.
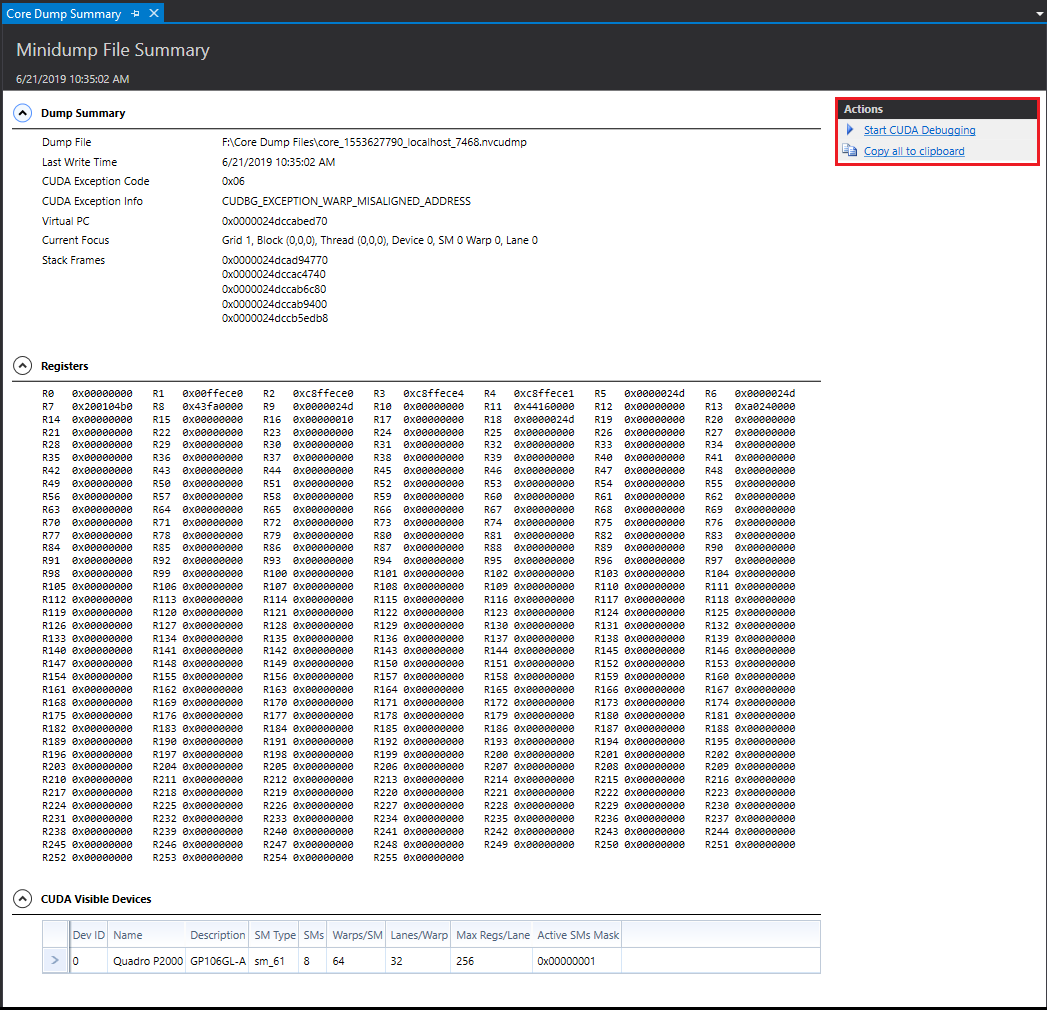
This shows you a read-only view of raw information in three collapsible sections: a dump summary, registers, and visible CUDA devices.
|
Note: |
At this time, NVIDIA Nsight VSE only supports GPU core dumps; any generated CPU core dump information will be ignored. |
From this summary view, you can launch either of the following:
-
The Next-Gen CUDA Debugger for core dump files generated on Pascal or later GPUs.
-
The Legacy CUDA Debugger for core dump files generated on Pascal or earlier GPUs.
The appropriate CUDA debugger needs to be launched with the GPU core dump file set as the target application. Note that this will only work with a local debugging configuration, so the Nsight Monitor will have to be running on the local machine. This will allow you to view CUDA debugging information, which can provide more diagnostic details, such as:
-
The exception that caused a fatal error.
-
A list of devices and their info, such as ID, Name, Description, SM, Number of SMs, Number of Warps, Number of Lanes.
-
The address of the PC.
-
A list of registers and their values.
-
Which device, grid, block, warp, and thread the exception hit.
Notices
Notice
NVIDIA® Nsight™ Application Development Environment for Heterogeneous Platforms, Visual Studio Edition 2020.1 User GuideSend Feedback
THE INFORMATION IN THIS GUIDE AND ALL OTHER INFORMATION CONTAINED IN NVIDIA DOCUMENTATION REFERENCED IN THIS GUIDE IS PROVIDED “AS IS.” NVIDIA MAKES NO WARRANTIES, EXPRESSED, IMPLIED, STATUTORY, OR OTHERWISE WITH RESPECT TO THE INFORMATION FOR THE PRODUCT, AND EXPRESSLY DISCLAIMS ALL IMPLIED WARRANTIES OF NONINFRINGEMENT, MERCHANTABILITY, AND FITNESS FOR A PARTICULAR PURPOSE. Notwithstanding any damages that customer might incur for any reason whatsoever, NVIDIA’s aggregate and cumulative liability towards customer for the product described in this guide shall be limited in accordance with the NVIDIA terms and conditions of sale for the product.
THE NVIDIA PRODUCT DESCRIBED IN THIS GUIDE IS NOT FAULT TOLERANT AND IS NOT DESIGNED, MANUFACTURED OR INTENDED FOR USE IN CONNECTION WITH THE DESIGN, CONSTRUCTION, MAINTENANCE, AND/OR OPERATION OF ANY SYSTEM WHERE THE USE OR A FAILURE OF SUCH SYSTEM COULD RESULT IN A SITUATION THAT THREATENS THE SAFETY OF HUMAN LIFE OR SEVERE PHYSICAL HARM OR PROPERTY DAMAGE (INCLUDING, FOR EXAMPLE, USE IN CONNECTION WITH ANY NUCLEAR, AVIONICS, LIFE SUPPORT OR OTHER LIFE CRITICAL APPLICATION). NVIDIA EXPRESSLY DISCLAIMS ANY EXPRESS OR IMPLIED WARRANTY OF FITNESS FOR SUCH HIGH RISK USES. NVIDIA SHALL NOT BE LIABLE TO CUSTOMER OR ANY THIRD PARTY, IN WHOLE OR IN PART, FOR ANY CLAIMS OR DAMAGES ARISING FROM SUCH HIGH RISK USES.
NVIDIA makes no representation or warranty that the product described in this guide will be suitable for any specified use without further testing or modification. Testing of all parameters of each product is not necessarily performed by NVIDIA. It is customer’s sole responsibility to ensure the product is suitable and fit for the application planned by customer and to do the necessary testing for the application in order to avoid a default of the application or the product. Weaknesses in customer’s product designs may affect the quality and reliability of the NVIDIA product and may result in additional or different conditions and/or requirements beyond those contained in this guide. NVIDIA does not accept any liability related to any default, damage, costs or problem which may be based on or attributable to: (i) the use of the NVIDIA product in any manner that is contrary to this guide, or (ii) customer product designs.
Other than the right for customer to use the information in this guide with the product, no other license, either expressed or implied, is hereby granted by NVIDIA under this guide. Reproduction of information in this guide is permissible only if reproduction is approved by NVIDIA in writing, is reproduced without alteration, and is accompanied by all associated conditions, limitations, and notices.
Trademarks
NVIDIA, the NVIDIA logo, and cuBLAS, CUDA, CUDA-GDB, CUDA-MEMCHECK, cuDNN, cuFFT, cuSPARSE, DIGITS, DGX, DGX-1, DGX Station, NVIDIA DRIVE, NVIDIA DRIVE AGX, NVIDIA DRIVE Software, NVIDIA DRIVE OS, NVIDIA Developer Zone (aka "DevZone"), GRID, Jetson, NVIDIA Jetson Nano, NVIDIA Jetson AGX Xavier, NVIDIA Jetson TX2, NVIDIA Jetson TX2i, NVIDIA Jetson TX1, NVIDIA Jetson TK1, Kepler, NGX, NVIDIA GPU Cloud, Maxwell, Multimedia API, NCCL, NVIDIA Nsight Compute, NVIDIA Nsight Eclipse Edition, NVIDIA Nsight Graphics, NVIDIA Nsight Integration, NVIDIA Nsight Systems, NVIDIA Nsight Visual Studio Edition, NVLink, nvprof, Pascal, NVIDIA SDK Manager, Tegra, TensorRT, Tesla, Visual Profiler, VisionWorks and Volta are trademarks and/or registered trademarks of NVIDIA Corporation in the United States and other countries. Other company and product names may be trademarks of the respective companies with which they are associated.