1. Advanced Topics
In this section, learn more about advanced CUDA topics, such as PTX and SASS assembly debugging, how to use the CUDA Memory Checker, and restrictions when debugging OptiX applications.
2. PTX and SASS Assembly Debugging
PTX is a low-level parallel-thread execution virtual machine and instruction set architecture (ISA). PTX exposes the GPU as a parallel computing device.
In addition, PTX provides a stable programming model and instruction set for general purpose parallel programming, and is designed to be efficient on NVIDIA GPUs. High-level language compilers for languages such as CUDA and C/C++ generate PTX instructions, which are optimized for and translated to native target-architecture instructions.
SASS is the low-level assembly language that compiles to binary microcode, which executes natively on NVIDIA GPU hardware.
As of NVIDIA Nsight Visual Studio Edition 6.0, PTX and SASS assembly debugging is now available. To utilize this feature, use the following tutorial.
|
Note: |
Note: The Legacy CUDA Debugger does not support debugging with OptiX applications, and the Next-Gen CUDA Debugger has a number of restrictions. |
2.1. To Enable PTX/SASS Assembly Debugging
- In Visual Studio, go to Tools > Options > Debugging.
Select both Enable Address Level Debugging, as well as the sub-option, Show disassembly if source is not available.
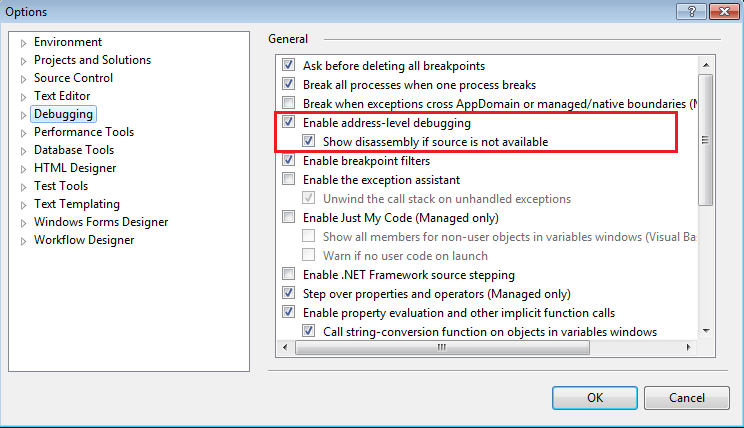
Note:
Currently, this only works with CUDA applications that have debug symbolics (i.e., that are built with –G0). PTX disassembly views will be blank if the application is not built with debug symbolics (–G0).
In addition, this displays only one CUDA function for the current stopped kernel. The user cannot scroll to other CUDA kernels in the module.
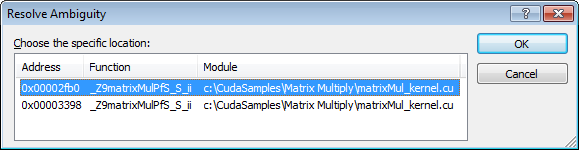
- Once the CUDA Debugger is stopped, you can open the Visual Studio Disassembly document through one of the following methods:
-
The Visual Studio source view's Go to Disassembly command.
-
The call stack's Go to Disassembly command.
-
The breakpoint view's Go to Disassembly command.
-
Using the Visual Studio menu Debug > Windows > Disassembly.
Note:
This can only work when stopped in a CUDA kernel via a breakpoint. There is no static or offline disassembly in the Visual Studio disassembly view.
-
-
When going to disassembly, there may be multiple associated addresses. In this case, Visual Studio will pop up a dialog asking you to choose which address you want to view.
-
The Visual Studio options that are supported in the disassembly document window include the following:
-
Show Source Code;
-
Show Code Bytes;
-
Show Line Numbers;
-
Show Toolbar;
-
Show Address.
Note:
Note that the Show Symbols option is currently not supported.
-
-
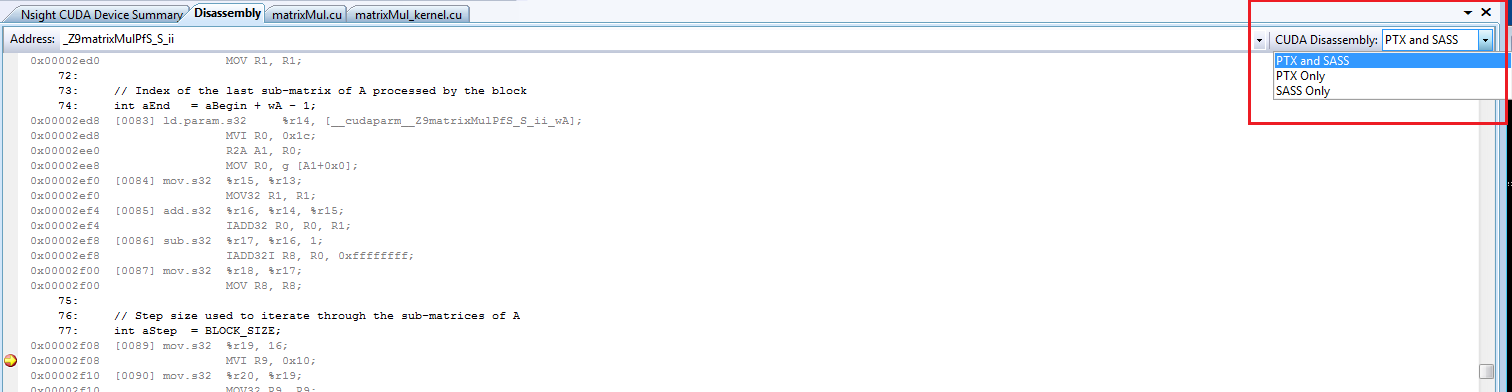
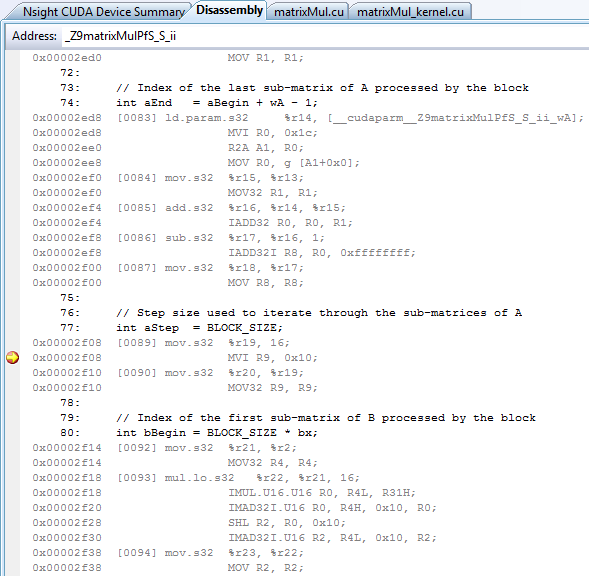
You can choose to view the CUDA disassembly as PTX, SASS, or a PTX and SASS combination. This is located in the top-right of the Visual Studio Disassembly view, and controls which disassembly is shown.
Note:
The number in brackets [0090] in the Visual Studio Disassembly View is the PTX line number.
2.2. Address Breakpoints
With the Legacy CUDA Debugger PTX and SASS assembly debugging feature, address breakpoints are supported. Standard Visual Studio controls for adding and removing breakpoints can be seen in the breakpoint column of the disassembly.
A few items to note with address breakpoints:
-
Visual Studio disables address breakpoints after each debug session.
-
These breakpoints may use any of the advanced breakpoint conditionals.
-
Some instructions are not able to be patched (i.e., breakpoints cannot be set on them). When this happens, the breakpoint will be moved to the previous patchable breakpoint instruction.
-
The address of a source breakpoint can be seen in the Address column of the Visual Studio breakpoint’s view.
-
The address breakpoints are always set at a SASS address.
2.3. Run Control
When using run control with the Legacy CUDA Debugger PTX and SASS assembly debugging, stepping in / out / over all work normally as expected. This follows the Visual Studio Source, Statement, and Instruction control. Stepping in the last line of a kernel will continue the program.
When stepping instructions (which is the default for disassembly) and SASS is showing, the Legacy CUDA Debugger will always step at the SASS level.
-
PTX > Steps only PTX instructions.
-
SASS > Steps only SASS instructions.
-
PTX + SASS > Also steps SASS instructions.
|
Note: |
Note that there is no control for stepping PTX when SASS is showing. |
Additional information on PTX can be found in the CUDA documentation:
NVIDIA GPU Computing Toolkit installation path\CUDA\<version number>\doc\
2.4. Registers View
The Visual Studio Debugger > Windows > Registers can be configured to display CPU, SASS, and PTX registers by right-mouse clicking on the view and selecting the desired set of registers.
-
Device (on Legacy Debugger) or SASS (on Next-Gen Debugger) — shows GPU registers.
-
PTX — shows PTX registers, assuming the application is built with debug symbolics.
-
SASS loc — shows in-scope SASS registers.
Note that the Next-Gen Debugger does not provide SASS loc register views.
-
PTX loc — shows in-scope GPU PTX registers, assuming the application is built with debug symbolics.
|
Note: |
The Next-Gen Debugger also provides a formatted, customizable registers view via Nsight > Windows > GPU Registers. |
For more information, see the Next-Gen CUDA Debugger registers view, and how to evaluate the value of an expression.
3. Memory Checker
|
Note: |
This feature is only supported by the Legacy CUDA Debugger. The Next-Gen CUDA Debugger will support this in a future release. |
|
Note: |
The Legacy CUDA Debugger does not support debugging with OptiX applications. See: Restrictions When Debugging OptiX Applications > Legacy CUDA Debugger |
The CUDA Memory Checker detects problems in global and shared memory. If the CUDA Debugger detects an MMU fault when running a kernel, it will not be able to specify the exact location of the fault. In this case, enable the CUDA Memory Checker and restart debugging, and the CUDA Memory Checker will pinpoint the exact statements that are triggering the fault.
The CUDA Memory Checker will also detect problems in code that is built in release mode. Without symbols (-G0) it will not show any associated source code.
|
Note: |
The CUDA Memory Checker must be enabled before debugging is started. |
|
Note: |
Keep in mind that there is a performance penalty associated with running kernels with the CUDA Memory Checker enabled. |
3.1. To Use the Memory Checker
-
In Visual Studio, open a CUDA-based project.
-
Enable the Memory Checker using one of three methods:
-
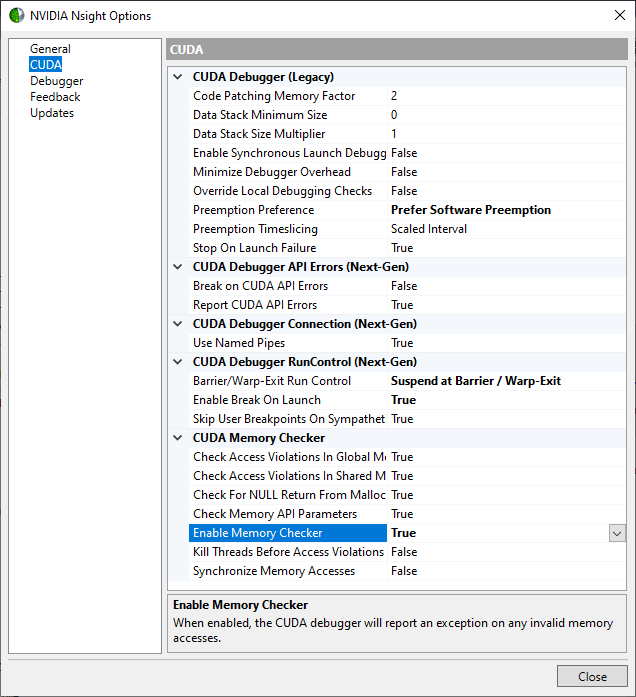
From the Nsight menu, select Options > CUDA. Change the setting for Enable Memory Checker from False (the default setting) to True.
-
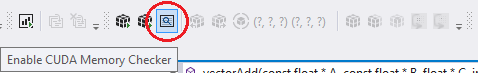
As an alternative, you can select the Memory Checker icon from the CUDA toolbar to enable memory checking.
-
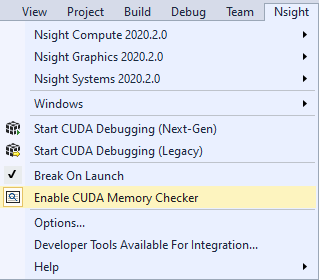
Or, use the Nsight menu and select Enable CUDA Memory Checker.
-
-
The user can enable checking in global memory or shared memory, as well as overall control of the CUDA Memory Checker.
When the global memory space is enabled, NVIDIA Nsight™ VSE will also check violations in memory allocated from device code via malloc and free.
-
Launch the CUDA Debugger.
-
Make sure that the Nsight Monitor is running on the target system.
-
From Nsight menu, select Start CUDA Debugging (Legacy).Or you can use one of the following alternate methods:
-
Right-click on the project in Solution Explorer and choose Debug > Start CUDA Debugging (Legacy)
-
Nsight CUDA Debugging toolbar > Start CUDA Debugging (Legacy)
-
Nsight Connections toolbar > Start CUDA Debugging (Legacy)
-
-
The Legacy CUDA Debugger starts and launches the target application.
-
During the debugging session, if the target attempts to write to an invalid memory location, the debugger triggers a breakpoint on the offending line of code, which stops execution. The CUDA Debugger stops before executing the instruction that would have written to the invalid memory location.
The CUDA Memory Checker treats misaligned pointers and attempted writes to an invalid address as two separate checks. This means that you can hit two separate breakpoints for the same attempted memory access.
For example, the following statement would trigger first a breakpoint because the pointer is misaligned, and then a second breakpoint because it attempts to write to an invalid memory address:
*(int*)0xffffffff = 0xbad;
3.1.1. Out of Patch RAM Errors
When the CUDA Memory Checker is enabled, it will consume extra memory on the GPU. If there is not enough patch RAM for the CUDA Debugger, it will give the following error:
Internal debugger error occurred while attempting to launch
"KernelName - CUmodule 0x04e67f10: code patching failed due to lack of code patching memory.
If this happens, increase the patch RAM factor by going to Nsight > Options > CUDA > Code Patching Memory Factor.
This is a multiplier of the kernel's instruction size, which is added to a base patch RAM size of 64k.
Another option is to disable the shared or global memory checking, in order to use less patch RAM.
3.2. Memory Checker Results
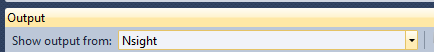
The CUDA Memory Checker results go to the Nsight page of the Output window, as well as to the CUDA Information tool window.
Error Code Meaning mis ld misaligned access during a memory load mis st misaligned access during a memory store mis atom misaligned access during an atomic memory transaction - an atomic function was passed a misaligned address adr ld invalid address during a memory load adr st invalid address during a memory store - attempted write to a memory location that was out of range, also sometimes referred to as a limit violation. adr atom invalid address during an atomic memory transaction - an atomic function attempted a memory access at an invalid address.
3.2.1. Example 1
The following code snippet shows an example of attempting to write to a memory address out-of-bounds of the declared array.
Attempt to Write to Array Index Out of Bounds
__device__ float  globalArray[10];
__global__   void   naughtyWriter ()
{
    int  i;
    for (i = 0; i <=> 10; i++)   //error: index  will exceed array length
        globalArray[i] =>  1;
}
Notice that Code Example 1 declares globalArray[] as an array of data type float, in global memory (__device__ memory). If the array had been declared in a function executed by the CPU, the array would have been placed in thread-local memory, which is NOT checked by the CUDA Memory Checker.
3.2.2. Example 2
The following code snippet shows an example of an attempt to write to an invalid memory address. If the CUDA Memory Checker is enabled, debugging an application that attempts to execute this code would trigger a breakpoint before executing the statement that assigns 0xd1e to the array.
Attempt to Write to an Invalid Memory Address
__global__ void other NaughtyWriter(int * pValues, int   numElements)
{
    pValues[numElements]   = 0xd1e;   >//error:  invalid memory address
}
4. Restrictions When Debugging OptiX Applications
Overview
When using the OptiX SDK to develop applications, certain framework libraries are considered proprietary and have debugging and profiling tool restrictions. For many NVIDIA tools, call stacks that involve these libraries are completely restricted. Certain NVIDIA tools provide some visibility into user code using the framework libraries. These include:
-
Nsight Visual Studio Edition’s Next-Gen CUDA Debugger
-
Nsight Compute Profiler
-
cuda-gdb debugger
4.1. Restrictions for NVIDIA Nsight Visual Studio Edition
4.1.1. Legacy CUDA Debugger
Call stacks and state information that involve these libraries are completely restricted.
4.1.2. Next-Gen CUDA Debugger
General
By default, OptiX applications are built with -lineinfo, which optimizes SASS, typically for profiling. The -linetable option does not match exactly to the source, so stepping behavior is not what you get with -G, typically for debugging. Optimized SASS makes source stepping and source breakpoint setting haphazard at best. As such, it is recommended that you set breakpoints and step in SASS disassembly as much as possible.
Call stack and GPU state information may be restricted to user code. OptiX Library portions of the call stack will be labeled as [NVIDIA Internal], and state information for these portions of the stack will be restricted.
Breakpoints
Breakpoints may only be set in unrestricted OptiX module code and user code. More specifically:
Function Breakpoints
-
Function breakpoints in user code work the same as in other CUDA applications.
-
Function breakpoints in restricted OptiX internal code will not resolve. For example, if you use .* the debugger will only resolve breakpoints in user and unrestricted OptiX functions.
Source Breakpoints
-
As mentioned in General, OptiX code is typically optimized. This can result in source breakpoints being resolved to multiple locations. Correspondingly, the breakpoint’s view may show multiple child instances for a given breakpoint. As such, it is recommended that you set breakpoints and step in SASS disassembly as much as possible.
SASS Breakpoints
-
For the most part, SASS breakpoints work as expected, aside from one exception: Visual Studio saves SASS breakpoints with an absolute address, so the address may be different between sessions. (They are not Function + offset, which would relocate correctly.)
PTX Breakpoints
-
PTX breakpoints work the same as in other CUDA applications.
Break on Activity
Break on Launch
-
Launch function internal breakpoints cannot be set in restricted OptiX internal code. Therefore, the Break on Launch functionality cannot be used to break on Optix callbacks to user code.
Disasm
Restrictions:
-
The Disassembly view will not show restricted OptiX module code.
-
Stepping into restricted OptiX code will not be permitted.
-
No restricted functions or their file names will be displayed when scrolling or otherwise changing the view’s disassembly location.
The following only applies to unrestricted OptiX framework library code and user code, with the above exceptions:
-
SASS may be displayed and stepped normally.
-
PTX, if present, may be displayed and stepped normally.
-
OptiX unrestricted code may be shown as /generated/generated.
-
A dialog may appear the first time the debugger is looking for the OptiX /generated/generated file. Canceling the dialog will ensure it does not display anymore.
-
Corresponding file names will also be shown.
-
Call Stack
-
Shows [NVIDIA Internal] for restricted OptiX functions.
-
Multiple restricted functions may be collapsed into one [NVIDIA internal] frame.
-
[NVIDIA Internal] frames have no source or disasm, and other restricted state information.
-
User code below and between [NVIDIA Internal] frames may be viewed and inspected normally, except some registers may be incorrect.
Note that this is not possible with cuda-gdb.
-
User code above the topmost [NVIDIA internal] frame may be viewed and inspected normally.
Modules
-
Restricted modules will be displayed as:
[CUDA]<module handle>
-
User and unrestricted modules, are displayed the same as in other CUDA applications.
Run Control
-
Disassembly stepping behaves the same as other CUDA applications.
-
As mentioned in General, OptiX code is typically optimized. This can result in erratic source stepping. As such, it is recommended that you set breakpoints and step in SASS disassembly as much as possible.
Autos
Automatic variable state is unsupported when the call stack involves [NVIDIA Internal] frames.
Locals
Local variable state view only shows the launch information when the call stack involves [NVIDIA Internal] frames.
Watch
-
Watch variables do not show up when the call stack involves [NVIDIA Internal] frames.
-
PTX registers (e.g., %r279 or %r515) will not resolve due to missing device debug info (-G) and will display the following message:
Unable to evaluate the expression.
GPU Registers (Visual Studio and GPU Registers View)
The Registers view has the same behavior as in other CUDA applications above the topmost [NVIDIA Internal] call stack frame, but register values are not reliable below.
Restrictions:
-
PTX registers do not display due to missing device debug info (-G).
4.2. API Trace
API Trace information that involve restricted OptiX library functions are completely restricted.
Notices
Notice
NVIDIA® Nsight™ Application Development Environment for Heterogeneous Platforms, Visual Studio Edition 2020.3.1 User GuideSend Feedback
THE INFORMATION IN THIS GUIDE AND ALL OTHER INFORMATION CONTAINED IN NVIDIA DOCUMENTATION REFERENCED IN THIS GUIDE IS PROVIDED “AS IS.” NVIDIA MAKES NO WARRANTIES, EXPRESSED, IMPLIED, STATUTORY, OR OTHERWISE WITH RESPECT TO THE INFORMATION FOR THE PRODUCT, AND EXPRESSLY DISCLAIMS ALL IMPLIED WARRANTIES OF NONINFRINGEMENT, MERCHANTABILITY, AND FITNESS FOR A PARTICULAR PURPOSE. Notwithstanding any damages that customer might incur for any reason whatsoever, NVIDIA’s aggregate and cumulative liability towards customer for the product described in this guide shall be limited in accordance with the NVIDIA terms and conditions of sale for the product.
THE NVIDIA PRODUCT DESCRIBED IN THIS GUIDE IS NOT FAULT TOLERANT AND IS NOT DESIGNED, MANUFACTURED OR INTENDED FOR USE IN CONNECTION WITH THE DESIGN, CONSTRUCTION, MAINTENANCE, AND/OR OPERATION OF ANY SYSTEM WHERE THE USE OR A FAILURE OF SUCH SYSTEM COULD RESULT IN A SITUATION THAT THREATENS THE SAFETY OF HUMAN LIFE OR SEVERE PHYSICAL HARM OR PROPERTY DAMAGE (INCLUDING, FOR EXAMPLE, USE IN CONNECTION WITH ANY NUCLEAR, AVIONICS, LIFE SUPPORT OR OTHER LIFE CRITICAL APPLICATION). NVIDIA EXPRESSLY DISCLAIMS ANY EXPRESS OR IMPLIED WARRANTY OF FITNESS FOR SUCH HIGH RISK USES. NVIDIA SHALL NOT BE LIABLE TO CUSTOMER OR ANY THIRD PARTY, IN WHOLE OR IN PART, FOR ANY CLAIMS OR DAMAGES ARISING FROM SUCH HIGH RISK USES.
NVIDIA makes no representation or warranty that the product described in this guide will be suitable for any specified use without further testing or modification. Testing of all parameters of each product is not necessarily performed by NVIDIA. It is customer’s sole responsibility to ensure the product is suitable and fit for the application planned by customer and to do the necessary testing for the application in order to avoid a default of the application or the product. Weaknesses in customer’s product designs may affect the quality and reliability of the NVIDIA product and may result in additional or different conditions and/or requirements beyond those contained in this guide. NVIDIA does not accept any liability related to any default, damage, costs or problem which may be based on or attributable to: (i) the use of the NVIDIA product in any manner that is contrary to this guide, or (ii) customer product designs.
Other than the right for customer to use the information in this guide with the product, no other license, either expressed or implied, is hereby granted by NVIDIA under this guide. Reproduction of information in this guide is permissible only if reproduction is approved by NVIDIA in writing, is reproduced without alteration, and is accompanied by all associated conditions, limitations, and notices.
Trademarks
NVIDIA, the NVIDIA logo, and cuBLAS, CUDA, CUDA-GDB, CUDA-MEMCHECK, cuDNN, cuFFT, cuSPARSE, DIGITS, DGX, DGX-1, DGX Station, NVIDIA DRIVE, NVIDIA DRIVE AGX, NVIDIA DRIVE Software, NVIDIA DRIVE OS, NVIDIA Developer Zone (aka "DevZone"), GRID, Jetson, NVIDIA Jetson Nano, NVIDIA Jetson AGX Xavier, NVIDIA Jetson TX2, NVIDIA Jetson TX2i, NVIDIA Jetson TX1, NVIDIA Jetson TK1, Kepler, NGX, NVIDIA GPU Cloud, Maxwell, Multimedia API, NCCL, NVIDIA Nsight Compute, NVIDIA Nsight Eclipse Edition, NVIDIA Nsight Graphics, NVIDIA Nsight Integration, NVIDIA Nsight Systems, NVIDIA Nsight Visual Studio Edition, NVLink, nvprof, Pascal, NVIDIA SDK Manager, Tegra, TensorRT, Tesla, Visual Profiler, VisionWorks and Volta are trademarks and/or registered trademarks of NVIDIA Corporation in the United States and other countries. Other company and product names may be trademarks of the respective companies with which they are associated.