1. Build and Run
In this section, learn more about how to configure the properties of a CUDA project, launching the CUDA Debugger, and how to attach debugging to a running CUDA Process.
2. CUDA Project Properties
With NVIDIA Nsight™ VSE, you can set parameters of your CUDA project in order to customize your debugging experience.
To configure your project's CUDA properties page:
-
In the Solution Explorer, click on the project name so that it is highlighted.
-
From the Project menu, choose Properties. The Property Pages window opens.
-
Select CUDA C/C++ in the left pane.
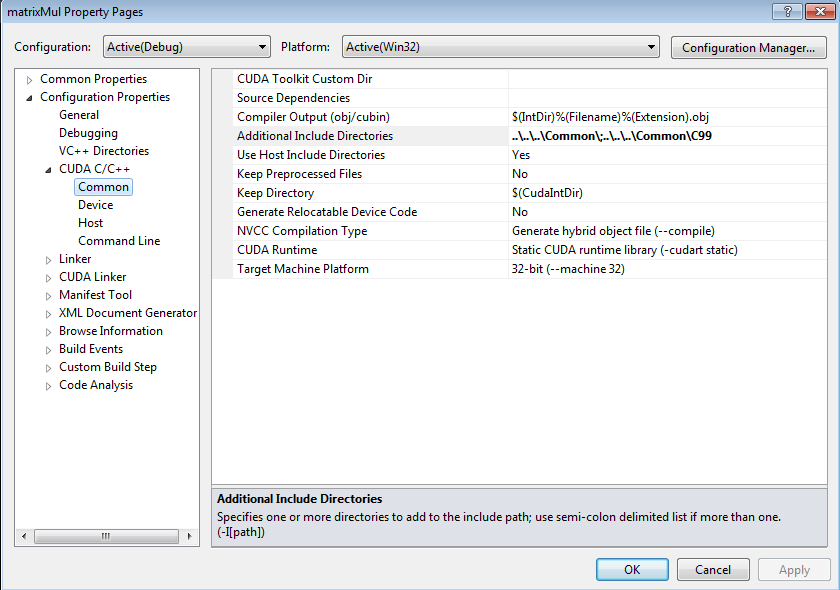
2.1. Common
On the Common page, you can configure the following options:
-
CUDA Toolkit Custom Dir — This option sets a custom path to the CUDA toolkit. You can edit the path, select "Browse" to choose the path, or select "inherit from parent or project defaults."
-
Source Dependencies — This option allows you to add additional source file dependencies. If you have a dependency that has been set with an #include statement, it does not need to be explicitly specified in this.
-
Compiler Output (obj/cubin) — This sets the output as an .obj or a .cubin file. The default setting is $(IntDir)%(Filename)%(Extension).obj.
-
Additional Include Directories — This option allows you to list at least one additional directory to add to the include path. If you have more than one, use a semicolon to separate them.
-
Use Host Include Directories — This option specifies whether or not to use the additional include directories that are used by the host compiler for device code.
-
Keep Preprocessed Files — This option allows you to choose whether or not the preprocessor files generated by the CUDA compiler (for example, .ptx, .cubin, .cudafe1.c, etc.) will be deleted.
- Keep Directory — This option sets the path the directory where the preprocessor files generated by the CUDA compiler will be kept.
-
Generate Relocatable Device Code — This setting chooses whether or not to compile the input file into an object file that contains relocatable device code.
-
NVCC Compilation Type — This option sets your desired output of NVCC compilation. Choices here include the following:
-
Generate hybrid object file (--compile)
-
Generate hybrid .c file (-cuda)
-
Generate .gpu file (-gpu)
-
Generate .cubin file (-cubin)
-
Generate .ptx file (-ptx)
-
-
CUDA Runtime — This option allows you to specify the type of CUDA runtime library to be used. The choices here include the following:
-
No CUDA runtime library (-cudart none)
-
Shared/dynamic CUDA runtime library (-cudart shared)
-
Static CUDA runtime library (-cudart static)
-
-
Target Machine Platform — This sets the platform of the target machine (either x86 or x64).
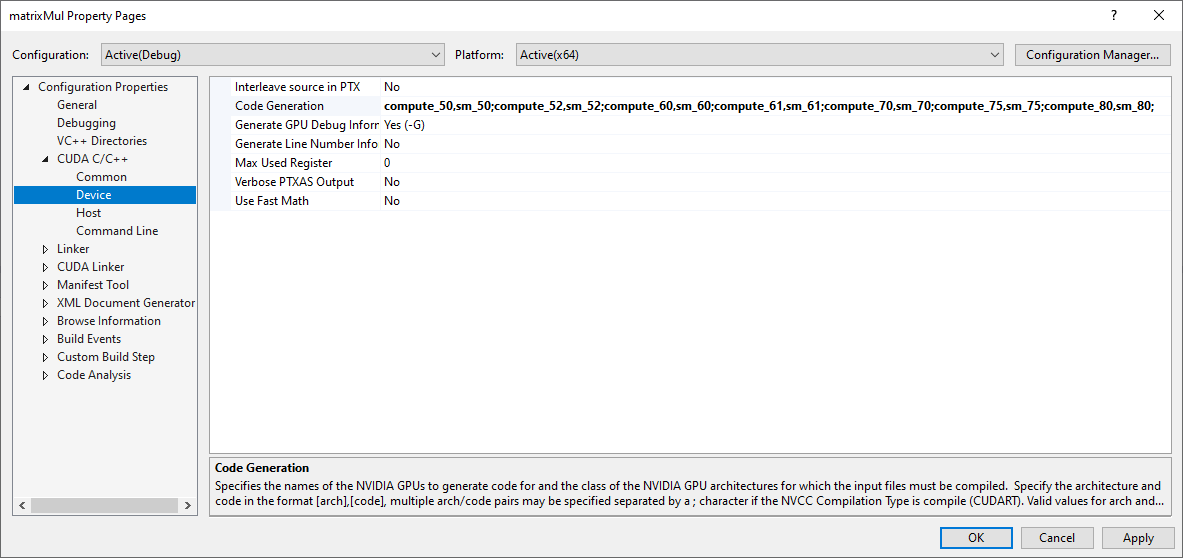
2.2. Device
On the Device page, you can configure the following options:
-
C interleaved in PTXAS Output — This setting chooses whether or not to insert source code into generated PTX.
-
Code Generation — This option specifies the names of the NVIDIA GPU architectures to generate code for. If you click Edit from the drop-down menu, the following pop-up appears:
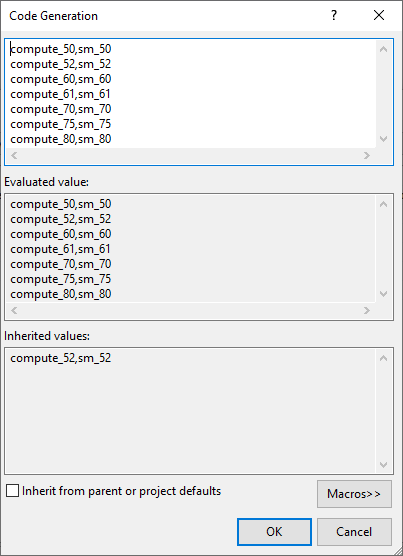
If you edit this field, the correct syntax to use is [arch],[code] (for example, compute_80,sm_80). If the selected NVCC Compilation Type is compile, then multiple arch/code pairs may be listed, separated by a semicolon (for example, compute_70,sm_70;compute_75,sm_75).
-
Generate GPU Debug Information — This setting selects whether or not GPU debugging information is generated by the CUDA compiler.
-
Generate Line Number Information — This option chooses whether or not to generate line number information for device code. If Generate GPU Debug Information is on (-G), line information (-lineinfo) is automatically generated as well.
-
Max Used Register — This option specifies the maximum amount of registers that GPU functions can use.
-
Verbose PTXAS Output — This option selects whether or not to use verbose PTXAS output.
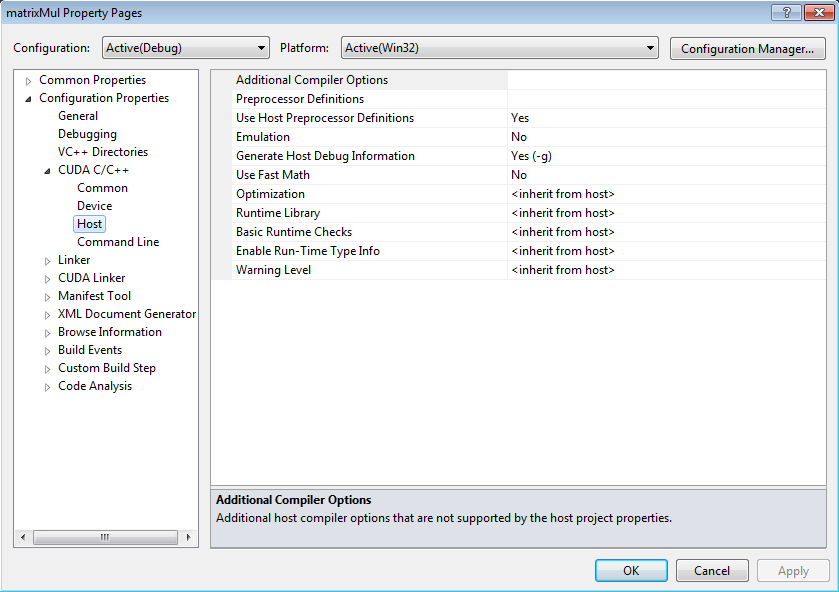
2.3. Host
On the Host page, you can configure the following options:
-
Additional Compiler Options — This setting lists additional host compiler options that are not supported by the host's project properties.
-
Preprocessor Definitions — This option allows you to list preprocessor defines.
-
Use Host Preprocessor Definitions — This option selects whether or not to use the defines that were used by the host compiler for device code.
-
Emulation — This option specifies whether or not to generate emulated code.
-
Generate Host Debug Information — This option specifies whether or not the host debugging information will be generated by the CUDA compiler.
-
Use Fast Math — This option selects whether or not to make use of the fast math library.
-
Optimization — This field selects the option for code optimization. Available choices include the following:
-
<inherit from host>
-
Disabled (/Od)
-
Minimize Size (/O1)
-
Maximize Speed (/O2)
-
Full Optimization (/Ox)
-
-
Runtime Library — This field selects the runtime library to use for linking. Available choices include the following:
-
<inherit from host>
-
Multi-Threaded (/Mt)
-
Multi-Threaded Debug (/Mtd)
-
Multi-Threaded DLL (/MD)
-
Multi-Threaded Debug DLL (/MDd)
-
Single-Threaded (/ML)
-
Single-Threaded Debug (/MLd)
-
-
Basic Runtime Checks — This field performs basic runtime error checks, incompatible with any optimization type other than debug. Available choices include the following:
-
<inherit from host>
-
Default
-
Stack Frames (/RTCs)
-
Uninitialized Variables (/RTCu)
-
Both (/RTC1)
-
-
Enable Run-Time Type Info — This option chooses whether or not to add code for checking C++ object types at run time.
-
Warning Level — This option selects how strictly you want the compiler to be when checking for potentially suspect constructs. Available choices here include:
-
<inherit from host>
-
Off: Turn Off All Warnings (/W0)
-
Level 1 (/W1)
-
Level 2 (/W2)
-
Level 3 (/W3)
-
Level 4 (/W4)
-
Enable All Warnings (/Wall)
-
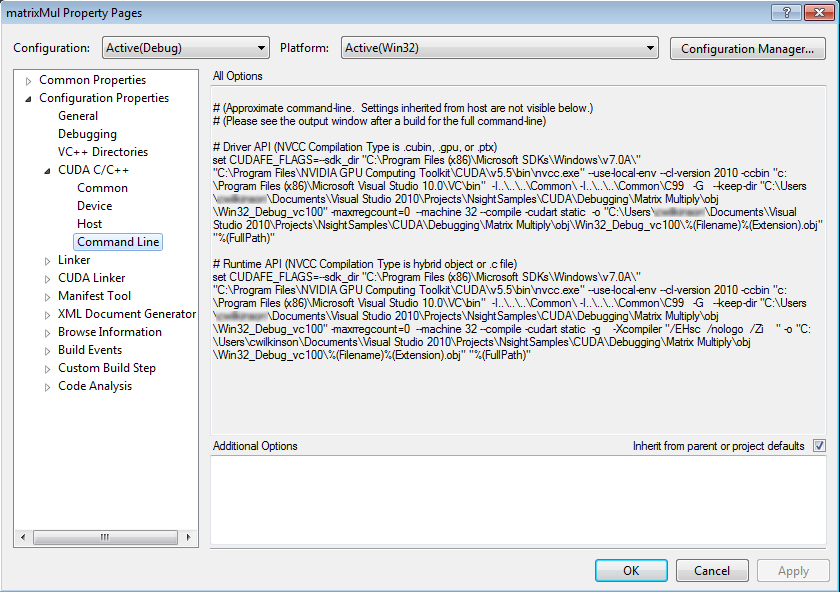
2.4. Command Line
The Command Line page shows the approximate command line parameters, given the settings you've chosen.
3. Launch the CUDA Debugger
Make sure that the modules you intend to debug are built with the compiler generating debug symbols. If a module has no symbols, then debugging is disabled for all functions in that module.
|
Note: |
CPU/GPU Debugging Support The Legacy CUDA debugger only supports debugging GPU CUDA kernels. You cannot debug CUDA code in a target process while simultaneously debugging the x86 code of the same process. Use a separate Visual Studio instance to debug the host portion of a target application. If you wish to debug the host portion of your CUDA application while the CUDA Debugger is attached, you must attach using a different Visual Studio instance. Attaching the same instance of Visual Studio to debug both the host portion and the device portion of a target application will cause the debuggers to conflict. The result is that the target application and the CUDA Debugger hang while being blocked by operations of the native debugger. The Next-Gen CUDA debugger allows you to debug both CPU and GPU code simultaneously. |
|
Note: |
Remote Debugging Support The Legacy CUDA debugger supports local and remote debugging. The Next-Gen CUDA debugger only supports local debugging. Remote debugging is not currently supported. |
3.1. Local Debugging
The NVIDIA Nsight™ VSE tools support launching and debugging a program on a single system. Please see System Requirements for Nsight Software for more information. Please also refer to the Setup Local Debugging topic for configuring a debugging setup with multiple GPUs.
To configure a project for local debugging:
|
Note: |
Note that this configuration only applies to the Legacy CUDA debugger. The Next-Gen CUDA debugger does not currently support remote debugging and will always run as a local debugger. |
-
Start Visual Studio.
-
Open a CUDA-based project.
-
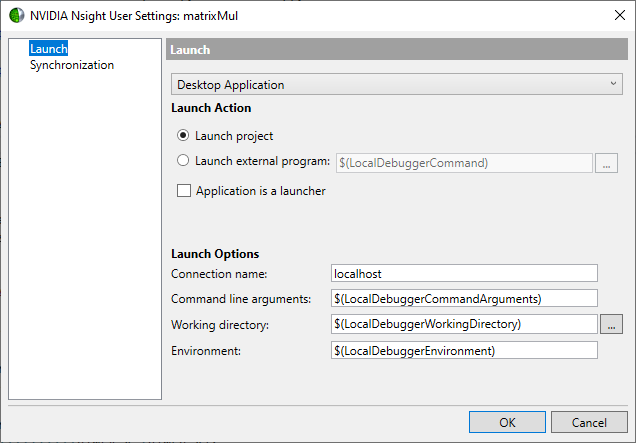
Right-click on the project name in the Solution Explorer, and choose Nsight User Properties. (As an alternative, you can also go to the Project menu > Nsight User Properties.)
-
In the Connection name text field, type: localhost.
-
Click OK.
To start the CUDA Debugger locally:
-
On the host machine, go to the Nsight menu in Visual Studio.
-
From the Nsight menu, select one of the following:
-
Start CUDA Debugging (Next-Gen)
-
Start CUDA Debugging (Legacy)
For information on choosing the correct debugger for your system configuration see the System Requirements page.
Alternatively, you can also choose to:
-
Right-click on the project, and select Debug > Start CUDA Debugging (Legacy)/(Next-Gen)
-
Click on the Start CUDA Debugging (Legacy)/(Next-Gen) toolbar icon.
Show/hide this icon group by right-clicking on the Visual Studio toolbar and toggling Nsight CUDA Debug.
-
Click on the Start CUDA Debugging (Legacy)/(Next-Gen) toolbar menu item.
Show/hide this icon group by right-clicking on the Visual Studio toolbar and toggling Nsight Connections.
-
-
-
If you started Legacy CUDA debugging:
-
You'll notice that on the host machine, a pop-up message indicates that a connection has been made.
-
Note that with a remote debugging configuration, the Nsight Monitor must be started prior to debugging. However, in a local debugging setup, the Nsight Monitor will launch automatically when the CUDA Debugger is started.
-
The CUDA Debugger launches the target application on the local machine. The CUDA Debugger communicates through port: 8000 by default, although this setting can be changed in the Nsight Monitor options. (See both Host Basics and Target Basics for more details on how to configure the default port settings.) You can use the CUDA Debugger to pause execution, step, and perform other debugger functions.
-
3.2. Remote Debugging
|
Note: |
If you are using the Next-Gen CUDA debugger: Remote debugging isn’t currently supported. The target machine is assumed to be localhost. Please see Local Debugging. |
You can launch and debug a program on any properly configured remote host. Please see How To: Install the Nsight Monitor and Setup Remote Debugging for more information on how to install and configure the NVIDIA Nsight™ VSE tools on your remote machine.
To configure a project for remote debugging:
-
Start Visual Studio.
-
Open a CUDA-based project.
-
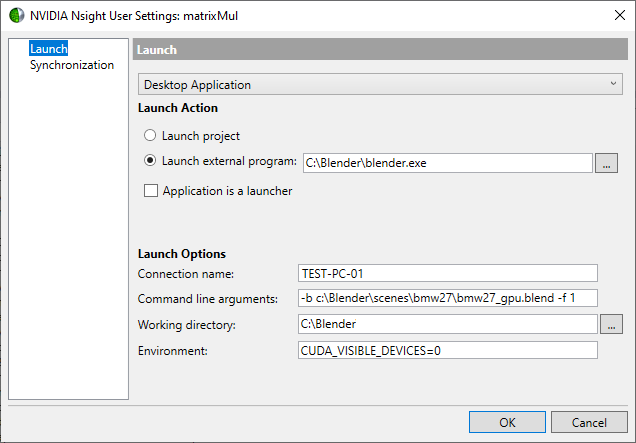
Right-click on the project name in the Solution Explorer, and choose Nsight User Properties. (As an alternative, you can also go to the Project menu > Nsight User Properties.)
-
In the Connection name field, replace localhost with the name of your target machine (the remote computer where the application to be debugged will run).
This can be the IP address of the machine on your local network, or the machine name as recognized on your network.
IMPORTANT: Do not use a mapped drive to specify the hostname. For example:
WRONG: M:\
CORRECT: jsmith.mydomain.com
-
In the Working directory field, you can specify the directory you want the application to use. The default working directory is the project directory.
-
Set any environment variables needed.
-
Click OK button.
To start the CUDA Debugger remotely:
-
Start the Nsight Monitor on the target machine (remote machine).
-
From the Windows Start menu, select All Programs.
-
Scroll down the through the installed programs and select: NVIDIA Corporation > Nsight Monitor.
-
-
Optional: To abort the launch when a file fails to copy to the remote system, set the Abort on synchronize failure option to "True."
-
From the Nsight menu, select Nsight Options. The Nsight Options window opens.
-
In the left hand pane, select Debugger.
-
Under Launch section, set Abort on synchronize failure to True.
-
Click OK button.
-
-
From the Nsight menu in Visual Studio:
-
Start CUDA Debugging (Legacy)
-
Note that Start CUDA Debugging (Next-Gen) does not currently support remote debugging. If launched, it will attempt to debug locally.
Alternatively, you can also choose to:
-
Right-click on the project, and select Debug > Start CUDA Debugging (Legacy)/(Next-Gen)
-
Click on the Start CUDA Debugging (Legacy)/(Next-Gen) toolbar icon.
Show/hide this icon group by right-clicking on the Visual Studio toolbar and toggling Nsight CUDA Debug.
-
Click on the Start CUDA Debugging (Legacy)/(Next-Gen) toolbar menu item.
Show/hide this icon group by right-clicking on the Visual Studio toolbar and toggling Nsight Connections.
-
-
-
Legacy CUDA debugging start up:
-
The host communicates with the Nsight Monitor on the remote machine, synchronizes the application files, and launches the application on the remote machine. The CUDA Debugger communicates through port: 8000 by default, although this setting can be changed in the Nsight Monitor options. (See both Host Basics and Target Basics for more details on how to configure the default port settings.) You can use the CUDA Debugger to pause execution, step, and perform other debugger functions.
-
To cancel the debugging sessions while files are synchronizing, select Nsight > Cancel Debug Startup.
-
NOTE: You cannot simultaneously perform CUDA debugging and x86 debugging of the same process when using the Legacy CUDA Debugger.
4. Attach to a Running CUDA Process
|
Note: |
This feature is only supported by the Legacy CUDA Debugger. The Next-Gen CUDA Debugger will support this in a future release. |
With NVIDIA Nsight™ VSE, it is possible to attach the Visual Studio debugger to a free-running CUDA application. This feature requires some one-time setup and setting additional environment variables when you launch programs that you wish to debug. The required steps are outlined below.
|
Note: |
Note that if you are using NVIDIA Nsight™ VSE on a Windows 10 x64 machine, you will not be able to attach to a win32/x86 CUDA application. Only 64-bit CUDA applications are supported. |
4.1. One Time Setup
-
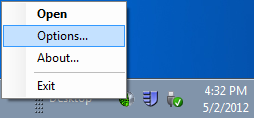
On the target machine (either local or remote, depending on your configuration), right-click on the Nsight Monitor icon on the taskbar and select Options.
-
Select the CUDA (Legacy) tab. Note that Attach does not work with the Next-Gen Debugger.
-
For the option Use this Monitor for CUDA attach, click the drop-down menu and select True. If this setting is not enabled, you will get a warning message in the attach dialog on the host machine.
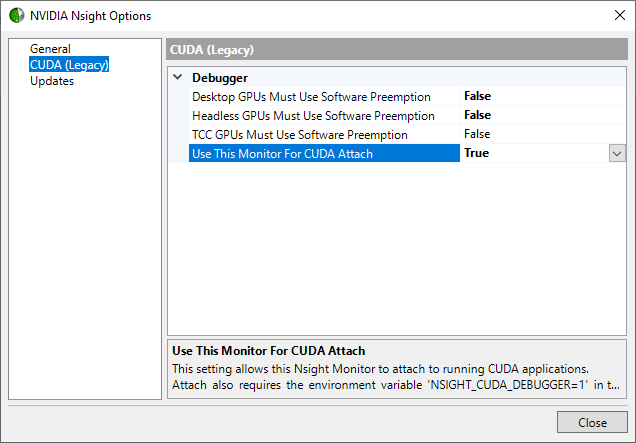
This setting is required to allow the Nsight Monitor to attach to free-running CUDA applications. It only needs to be configured one time after installing NVIDIA Nsight™ VSE.
4.2. When Launching Your Application
To make a process CUDA-attachable, you must set the environment variable NSIGHT_CUDA_DEBUGGER=1. The strict requirement is that the environment variable must be set before the application calls cuInit(). If the application uses the CUDA Runtime API, the environment variable must be set before the first CUDA Runtime API call is made.
Since environment variables are typically inherited by child processes, setting NSIGHT_CUDA_DEBUGGER=1 in a parent process that launches child processes will usually make the child processes CUDA-debuggable as well. Launcher processes and cluster nodes can benefit from this.
|
Warning! |
Setting NSIGHT_CUDA_DEBUGGER=1 can degrade the performance of an application, since the debugger is made resident. The effect is minimal on Tesla™ devices and headless devices; it is most severe on display devices with a desktop, where the debugger by necessity may need to serialize launches that would otherwise have been asynchronous. Therefore, it’s not always desirable to set NSIGHT_CUDA_DEBUGGER=1 at a system-wide or user-wide level. It is not recommended that you set NSIGHT_CUDA_DEBUGGER as a system environment variable, as it could adversely affect performance of other applications that use the CUDA Debugger. |
4.3. Attach to a CUDA Application in Visual Studio
-
On the host machine, open your project in Visual Studio.
-
This process will also work without a project. However, in that case, Visual Studio will not remember any breakpoints that are set.
-
To resolve and hit source breakpoints, the debugger requires the absolute paths of source files to match those in the debug symbols built into the application.
Note that if the project hits breakpoints when it is launched via the Nsight > Start CUDA Debugging (Legacy) command, then it will also work with attach.
Note that Attach does not work with the CUDA Next-Gen Debugger.
-
-
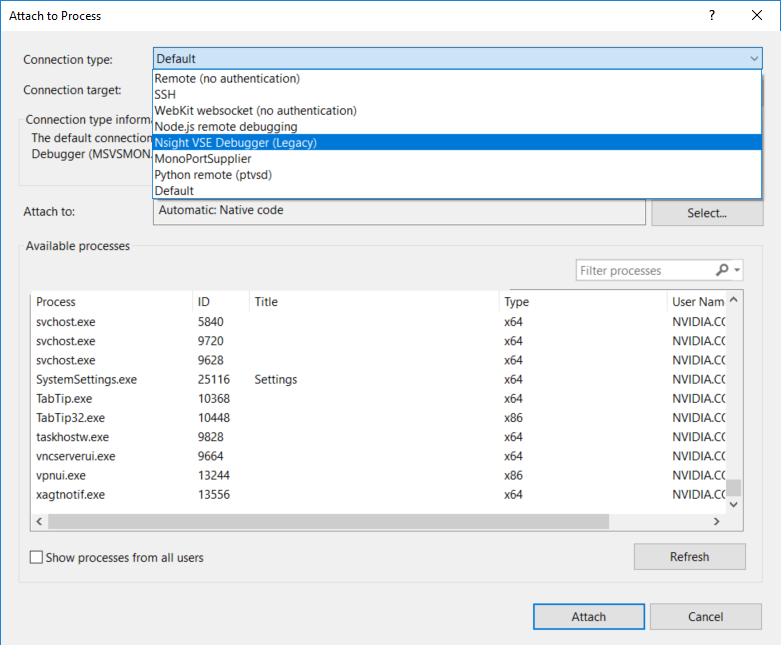
Go to Debug > Attach to Process. (Or as an alternative, go to the Tools menu, and select Attach to Process.)
This will open the Attach to Process dialog box.
-
Click the drop-down menu next to the Transport field, and choose Nsight GPU Debugger.
-
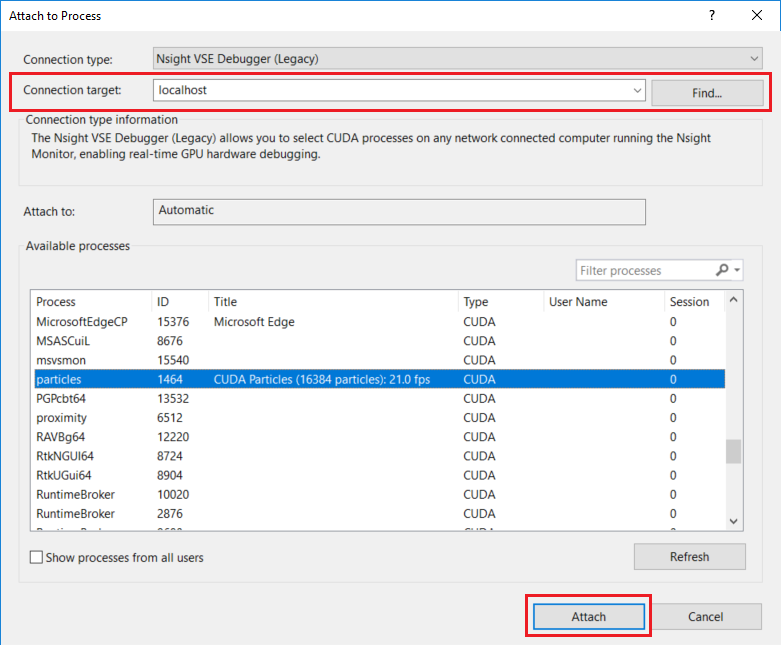
Ensure that your host machine name is listed in the Connection target field.
Note that this field is blank by default; you will have to manually select your machine name the first time this dialog is opened.
-
When you enter your computer's hostname in the Connection target field, a list of available processes will appear in the dialog box.
-
If a process is grayed out and CUDA is not listed in the Type column, then it cannot be debugged with the CUDA Debugger. Usually this occurs because the NSIGHT_CUDA_DEBUGGER environment variable is not set in that process.
-
If a process is grayed out and CUDA is listed in the Type column, then a CUDA Debugger is already attached. In this case, it cannot be attached to again.
-
Processes that may be attached will appear normally, and the Attach button will be enabled.
-
-
When you select the desired process and click Attach, a debug session will begin, exactly as if you had used the NVIDIA Nsight™ VSE menu in Visual Studio (Nsight > Start CUDA Debugging (Legacy)).
To end, choose Debug > Stop Debugging. Note that this will terminate the application.
4.4. Attach to CUDA in the Middle of a Kernel Launch
The following dialog is shown when an attachable process hits a GPU exception. A GPU exception can be an MMU fault, inline breakpoint (asm("brkpt;"); in CUDA C), or other abnormal condition.
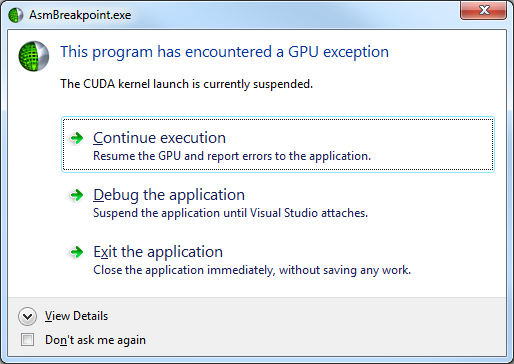
For safety reasons, the dialog will not be shown if any desktop GPUs are currently debugging in hardware mode, and the GPU will automatically resume. While detailed GPU inspection requires an attached Visual Studio instance, the dialog displays the faulting device name, CUcontext, kernel (mangled name), and the reason for the exception:
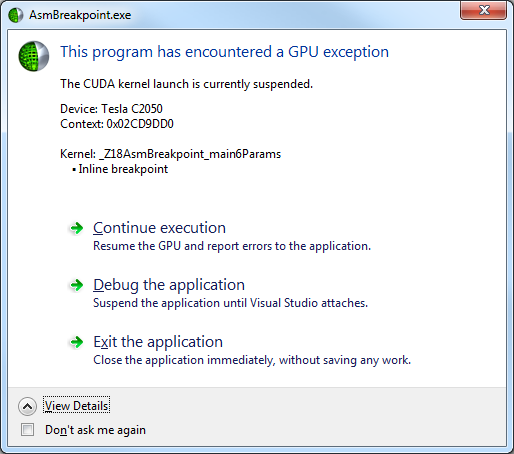
The following options are available:
-
Continue execution — This closes the dialog and resumes the GPU and application execution. This operation is equivalent to the Debug > Continue command in Visual Studio. The dialog will reappear upon the next GPU exception. If the "Don’t ask me again" box is checked, the program will instead automatically continue instead of showing this dialog again. This setting is not saved across program runs.
-
Debug the application — This pauses the program while the user attaches the CUDA debugger:
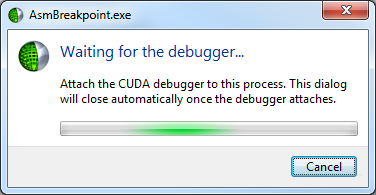
Canceling or closing this new dialog returns to the original dialog. The dialog automatically closes and reports the exception when the CUDA debugger attaches.
-
Exit the application — Terminates the program. Closing the dialog is equivalent to selecting "Exit the application."
Notices
Notice
NVIDIA® Nsight™ Application Development Environment for Heterogeneous Platforms, Visual Studio Edition 2022.2.1 User GuideSend Feedback
THE INFORMATION IN THIS GUIDE AND ALL OTHER INFORMATION CONTAINED IN NVIDIA DOCUMENTATION REFERENCED IN THIS GUIDE IS PROVIDED “AS IS.” NVIDIA MAKES NO WARRANTIES, EXPRESSED, IMPLIED, STATUTORY, OR OTHERWISE WITH RESPECT TO THE INFORMATION FOR THE PRODUCT, AND EXPRESSLY DISCLAIMS ALL IMPLIED WARRANTIES OF NONINFRINGEMENT, MERCHANTABILITY, AND FITNESS FOR A PARTICULAR PURPOSE. Notwithstanding any damages that customer might incur for any reason whatsoever, NVIDIA’s aggregate and cumulative liability towards customer for the product described in this guide shall be limited in accordance with the NVIDIA terms and conditions of sale for the product.
THE NVIDIA PRODUCT DESCRIBED IN THIS GUIDE IS NOT FAULT TOLERANT AND IS NOT DESIGNED, MANUFACTURED OR INTENDED FOR USE IN CONNECTION WITH THE DESIGN, CONSTRUCTION, MAINTENANCE, AND/OR OPERATION OF ANY SYSTEM WHERE THE USE OR A FAILURE OF SUCH SYSTEM COULD RESULT IN A SITUATION THAT THREATENS THE SAFETY OF HUMAN LIFE OR SEVERE PHYSICAL HARM OR PROPERTY DAMAGE (INCLUDING, FOR EXAMPLE, USE IN CONNECTION WITH ANY NUCLEAR, AVIONICS, LIFE SUPPORT OR OTHER LIFE CRITICAL APPLICATION). NVIDIA EXPRESSLY DISCLAIMS ANY EXPRESS OR IMPLIED WARRANTY OF FITNESS FOR SUCH HIGH RISK USES. NVIDIA SHALL NOT BE LIABLE TO CUSTOMER OR ANY THIRD PARTY, IN WHOLE OR IN PART, FOR ANY CLAIMS OR DAMAGES ARISING FROM SUCH HIGH RISK USES.
NVIDIA makes no representation or warranty that the product described in this guide will be suitable for any specified use without further testing or modification. Testing of all parameters of each product is not necessarily performed by NVIDIA. It is customer’s sole responsibility to ensure the product is suitable and fit for the application planned by customer and to do the necessary testing for the application in order to avoid a default of the application or the product. Weaknesses in customer’s product designs may affect the quality and reliability of the NVIDIA product and may result in additional or different conditions and/or requirements beyond those contained in this guide. NVIDIA does not accept any liability related to any default, damage, costs or problem which may be based on or attributable to: (i) the use of the NVIDIA product in any manner that is contrary to this guide, or (ii) customer product designs.
Other than the right for customer to use the information in this guide with the product, no other license, either expressed or implied, is hereby granted by NVIDIA under this guide. Reproduction of information in this guide is permissible only if reproduction is approved by NVIDIA in writing, is reproduced without alteration, and is accompanied by all associated conditions, limitations, and notices.
Trademarks
NVIDIA, the NVIDIA logo, and cuBLAS, CUDA, CUDA-GDB, CUDA-MEMCHECK, cuDNN, cuFFT, cuSPARSE, DIGITS, DGX, DGX-1, DGX Station, NVIDIA DRIVE, NVIDIA DRIVE AGX, NVIDIA DRIVE Software, NVIDIA DRIVE OS, NVIDIA Developer Zone (aka "DevZone"), GRID, Jetson, NVIDIA Jetson Nano, NVIDIA Jetson AGX Xavier, NVIDIA Jetson TX2, NVIDIA Jetson TX2i, NVIDIA Jetson TX1, NVIDIA Jetson TK1, Kepler, NGX, NVIDIA GPU Cloud, Maxwell, Multimedia API, NCCL, NVIDIA Nsight Compute, NVIDIA Nsight Eclipse Edition, NVIDIA Nsight Graphics, NVIDIA Nsight Integration, NVIDIA Nsight Systems, NVIDIA Nsight Visual Studio Edition, NVLink, nvprof, Pascal, NVIDIA SDK Manager, Tegra, TensorRT, Tesla, Visual Profiler, VisionWorks and Volta are trademarks and/or registered trademarks of NVIDIA Corporation in the United States and other countries. Other company and product names may be trademarks of the respective companies with which they are associated.