1. Control GPU Execution
In this section, learn more about how to control GPU execution, set GPU breakpoints, use global freeze, and work with barrier/warp-exit run control.
2. Control Execution
The CUDA Debugger allows you to control the execution of your CUDA program during the debugging session. The CUDA Debugger supports stepping into a line of code, and running the program to the cursor.
In order to use any of the below features, the debugged CUDA program must be halted as a result of stopping at a breakpoint or from a previous execution control statement.
2.1. Prerequisites
Source code should be compiled with nvcc using the -G option in order to provide non-optimized code with debug symbols and linetable information. It is also possible to compile with -linetable in order to debug with symbolics; however, this will optimize SASS and will result in erratic source stepping and source breakpoint behavior.
|
Note: |
OptiX applications are typically built with -linetable and may suffer from this behavior. See other OptiX restrictions, especially as they apply to stepping. |
2.2. Stepping Behavior
When stepping, all warps except the debugger focus warp are frozen. However, when stepping over __syncthreads(), all warps in the current block are allowed to make progress. This allows the focus warp to get past the __syncthreads() function.
Stepping out of a global function will resume the application (same result as pressing F5, or selecting the menu command Debug > Continue).
Stepping over the last line of a kernel function will also resume application execution.
Stepping over the last line of an inline function has the same result as stepping out of the inline function.
2.3. Best Practices
To experience the best stepping behavior when debugging, we recommend using curly braces when possible in your code. Place the curly braces on their own line of source code. For example, because of the way that the compiler produces scope information, the following coding styles result in different stepping behavior.
These code snippets results in less than optimal stepping behavior:
for () statement;
for ()        statement;
for () {        statement;
}
This code snippet results in optimal stepping behavior:
for ()
{
     statement;
}
In general, breaking up computation by declaring temporary variables results in code that is easier to debug. The chances of a variable being "live" over a certain set of lines increases. This means that as you step through code, the values of variables will be easier to identify.
-
Avoid killing the Debug Monitor when it is in use. If the Debug Monitor process is killed while an application is stopped at a CUDA breakpoint, you will not be able to kill the target process.
-
Use a separate Visual Studio instance to debug the host portion of a target application. If you wish to debug the host portion of your CUDA application while the CUDA Debugger is attached, you must attach using a different Visual Studio instance. Attaching the same instance of Visual Studio as both host and GPU debugger will cause the debugger to hang.
2.4. Single Stepping Your Program
-
Start a debugging session.
-
Select a thread you would like to single step using the Nsight CUDA Debug Location toolbar.
See Specify Debugger Context for more information.
-
From the Debug menu, choose Step Into.
As an alternative, press F11 on the keyboard.
-
The program counter for the current thread will advance one source line.
|
Note: |
Note: Using Step Into causes the debugger to execute the next instruction of the currently selected thread. Stepping occurs on the current focus thread. |
2.5. Running to the Cursor
To run the target application up to the cursor location:
-
In the Document window containing the source, right-click on the desired line of source code.
-
From the Context menu, choose Run To Cursor...
-
The program counter will advance to the specified line of source code.
2.6. Stopping the CUDA Debugger
From the Debug menu, choose Stop Debugging.
Alternatively, you can also press the Stop icon on the debugger toolbar, or type SHIFT+F5.
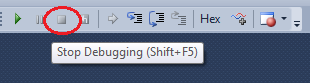
The target application will now stop. Visual Studio stops the debugging session and returns to the edit layout.
3. Set GPU Breakpoints
NVIDIA Nsight Visual Studio Edition's Next-Gen Debugger and Legacy Debugger can control exectuion, based on GPU breakpoints.
3.1. Prerequisites
Source code should be compiled with nvcc using the -G option in order to provide non-optimized code with debug symbols and linetable information. It is also possible to compile with -linetable in order to debug with symbolics; however, this will optimize SASS and will result in erratic source stepping and source breakpoint behavior.
|
Note: |
OptiX applications are typically built with -linetable and may suffer from this behavior. See other OptiX restrictions, especially as they affect GPU breakpoints. |
3.2. GPU Breakpoints
You can use NVIDIA Nsight™ VSE to set breakpoints in CUDA code. The development tools support two types of breakpoints: source breakpoints and data breakpoints.
Source breakpoints allow you to halt your application at the specified line of CUDA source code. You can also constrain your breakpoints to break only when a particular block and thread are executing. Constraining breakpoints to specific blocks and threads is a critical capability in a massively parallel environment where you can have hundreds or thousands of threads running simultaneously.
Data breakpoints halt your application's execution when the next executable line of code is going to write to a specified range of GPU memory.
You set and configure CUDA breakpoints with the same familiar dialog boxes, keyboard shortcuts, and tool windows used for other languages supported by Visual Studio.
|
Note: |
NOTE: A breakpoint condition can be met multiple times by the same line of code when the line of code has an inline function call. For example, setting a breakpoint on: x = cos() + sin() will generate 3 breakpoints on that line: one for the evaluation of the expression, plus one for each function on the line. |
|
Caution! |
If you are performing local debugging, make sure to disable WPF hardware acceleration before using the CUDA Debug Focus Picker dialog box. For more information about disabling WPF hardware acceleration, see Setup Local Debugging. |
3.2.1. Creating a Source Breakpoint
You can set breakpoints on any line of executable CUDA source code.
To set a breakpoint on a line of source code:
-
In a source code window, move the insertion point to the line where you want the application to break.
To set a breakpoint in a statement that spans two or more lines, move the insertion point to the last line of the statement.
-
From the Debug menu, choose Toggle Breakpoint.
Alternatively, press the F9 key, or left-click in the left margin of the source code document.
A red breakpoint glyph appears in the left margin of the source code document.
The color of the breakpoint glyph indicates the status of the breakpoint. A red filled glyph, for example, indicates a normal, enabled breakpoint. A white filled glyph indicates that the breakpoint is disabled. A + sign inside the breakpoint glyph indicates that the breakpoint has at least one advanced feature, such as condition, hit count, or filter, attached to it.
For more information on breakpoints, see the Visual Studio documentation from Microsoft: http://msdn.microsoft.com/en-us/library/5557y8b4.aspx
|
Note: |
If you set a breakpoint on an invalid source location (such as a comment line), the breakpoint will "jump" to the next available valid line of source code within a 10 line range. |
3.2.2. Creating a Data Breakpoint
You can also set data breakpoints at any GPU memory address, which will halt your program just prior to writing data to that address.
|
Note: |
Data Breakpoints are currently only supported with the Legacy Debugger. |
To set a data breakpoint at a memory address
-
In the Breakpoints Window, click on the New menu and select New Data Breakpoint.
-
Enter the name of the pointer or the numerical address in GPU memory space at which the program should halt when that memory space is written.
-
Click OK.
-
The application will halt just prior to the next application source line which writes to the specified area of memory.
3.2.3. Managing Breakpoints
Use the standard Visual Studio Breakpoints tool window to enable, disable, add and delete breakpoints.
-
From the Debug menu, choose Windows > Breakpoints, or use the Ctrl+Alt+B keyboard shortcut.
-
Enable or disable a breakpoint by marking the checkbox next to a breakpoint.
-
Delete a breakpoint by selecting a breakpoint and then clicking the Delete button in the toolbar.
-
Delete all breakpoints by selecting a breakpoint and then clicking the Delete All button in the toolbar.
-
Navigate to the source code location of the breakpoint by choosing Go To Source button in the toolbar.
|
Note: |
The debugger does not support the "Go To Assembly" Function in the Visual Studio Breakpoints tool window. |
3.3. Conditional Breakpoints
In a massively parallel environment with hundreds or thousands of threads, it is critical to be able to narrow your breakpoints to just the areas of interest. The CUDA Debugger supports setting conditional breakpoints for GPU threads with arbitrary expressions. Expressions may use program variables, the intrinsics blockIdx and threadIdx, and a few short-hand macros to make it easier to set conditions based on blockIdx and threadIdx.
- Both the Visual Studio debugger and the NVIDIA debuggers take an increasing amount of time to run as the number of threads and iterations evaluating the breakpoint condition and count increase. Noticeable delays should be expected when using this breakpoint feature in heavily utilized code. These delays can be exaggerated in CUDA kernels with thousands of threads.
- Hit count comparisons are evaluated on the host as opposed to on the local GPU, increasing the evaluation time of conditional breakpoints in CUDA code.
- During a suspend event (breakpoint hit), no matter how many threads are on the breakpoint, the hit count is only incremented once.
To set a block or thread condition on a CUDA C breakpoint:
-
Set a breakpoint on a line of source code.
-
Right-click on the breakpoint.
-
From the drop-down menu, select Condition...
-
Type an expression you want evaluated by the debugger at this breakpoint. For example, to break only on a specific block or thread index, such as block index (0,1) and thread index (0,1,0), type:
@blockIdx(0,1,0) && @threadIdx(0,1,0)
-
Click OK. The breakpoint glyph shows a plus sign.
The debugger pauses execution of the target application when the blockIdx and threadIdx of the running code matches the blockIdx and threadIdx specified in the conditional breakpoint.
Supported Debugger Macros
The CUDA Debugger has a basic macro expander that expands certain sub-expressions as follows:
| Macro | Expansion | Notes |
|---|---|---|
| @threadIdx(x, y, z) | (threadIdx.x == (x) && threadIdx.y == (y) && threadIdx.z == (z)) | x, y, and z must be decimal integers. |
| @threadIdx(#N) | ( (((threadIdx.z * blockDim.y) + threadIdx.y) * blockDim.x + threadIdx.x) == (N) ) | N must be a decimal integer. |
| @blockIdx(x, y, z) | (blockIdx.x == (x) && blockIdx.y == (y) && blockIdx.z == (z)) | x, y, and z must be decimal integers. |
| @blockIdx(#N) | ( (((blockIdx.z * gridDim.y) + blockIdx.y) * gridDim.x + blockIdx.x) == (N) ) | N must be a decimal integer. |
At this time, there’s no way for a user to add any extra macros.
|
Note: |
If an expression accesses a bad pointer, that expression will be evaluated as false, and the breakpoint will not be triggered. As a work-around, you may use expression short-circuiting with the && and || operators to conditionally evaluate sub-expressions. For example, if you use the following expression: p && (*p > 5) Then 'p' will not be de-referenced if it is set to NULL. |
3.4. Function Breakpoints
NVIDIA Nsight™ VSE supports function breakpoints. To set a function breakpoint, use one of the following methods:
-
From the Visual Studio Breakpoints window, select New > Break at Function.
-
From the Visual Studio Debug menu, select New Breakpoint > Break at Function.
-
From the CUDA Info window, select the Functions page from the drop-down menu. From here, you can right-click on a function row to set a breakpoint.
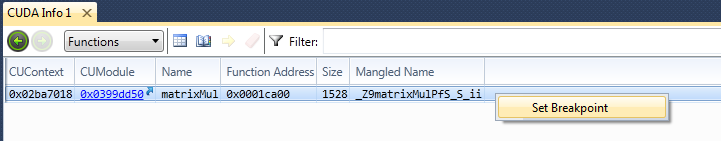
Function breakpoints will work even if the module is built without symbolics. However, only disassembly debugging will be available.
The user can enter either:
-
The mangled name of the function.
-
The unmangled name of the function, without any function signature. For example, matrixMul would resolve for matrixMul(int) and matrixMul(char).
If the signature is specified, the CUDA Debugger will not find the function(e.g., matrixMul(int) or matrixMul<int>()).
Optionally, the user can specify a module name. The syntax for this is the following:
[ModuleName!]FunctionName
If the ModuleName is left unspecified, the breakpoint will be set in each and every function of that name in all loaded modules. The module name works best when used with CUDART, since it has the .cu name for the module. For example: MyModule.cu!MyKernel
As a shortcut to this, the Functions page has the capability to enter the function name for the user. In this scenario the mangled function name is used, and it will set in each module that contains the specified function name.
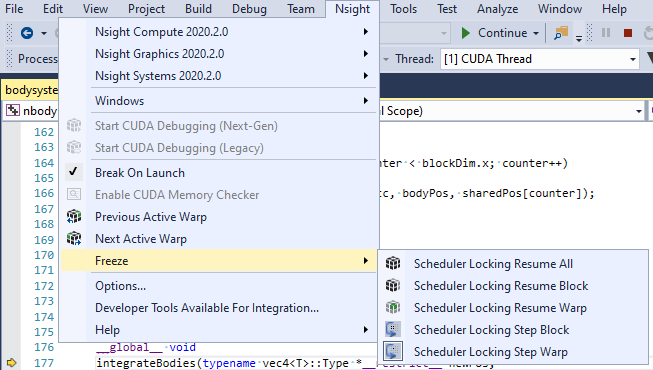
4. Global Freeze
The NVIDIA Nsight™ VSE main menu has a global freeze option. This allows you to control which warps will make progress when using any CUDA run control (such as stepping, resume, or run to cursor). For example, you can ensure that only one warp moves when stepping.
|
Note: |
Note that a barrier in the code will prevent a warp from making any progress, if the other warps are frozen. This is because all warps in a block need to get past the barrier, and they would not be able to if others are frozen. Please refer to Barrier Stepping for more details on how to control execution when continuing or stepping at a barrier or past the end of a kernel. |
This option must be set in each debug session. It does not persist between sessions.
To Use Global Freeze:
-
Launch the CUDA Debugger.
-
Open a CUDA-based project.
-
Set a breakpoint in the project. (See Walkthrough: Debugging a CUDA Application for information on how to set a breakpoint.)
-
Make sure that the Nsight Monitor is running on the target machine.
-
From the Nsight menu, select Start CUDA Debugging.
As an alternate option, you can also right-click on the project in Solution Explorer and choose Start CUDA Debugging.
- The CUDA Debugger starts and launches the target application.
-
- When the application is suspended at a breakpoint, go to the Nsight menu and choose Freeze. Select the freeze option that
you wish to utilize.
Selecting a Freeze Preference:
| Setting | Action on a "Run" command(Continue, F5, or Run to Cursor) | Action on a "Step" command (Step In, Step Out, or Step Over) |
|---|---|---|
| Scheduler Locking Resume All | Nothing is frozen. | Nothing is frozen. |
| Scheduler Locking Resume Block | All warps outside of the current block are frozen. | All warps outside of the current block are frozen. |
| Scheduler Locking Resume Warp | All warps except the current warp are frozen. | All warps except the current warp are frozen. |
| Scheduler Locking Step Block | Nothing is frozen. | All warps outside of the current block are frozen. |
| Scheduler Locking Step Warp (default) | Nothing is frozen. | All warps except the current warp are frozen. |
5. Barrier/Warp-Exit Run Control
In NVIDIA Nsight Visual Studio Edition 2019.3, the Next-Gen Debugger introduces options to control how run control behaves when the active warp attempts to move over a barrier or exit from a __global__ kernel (completing its execution).
5.1. How Barrier/Warp-Exit Run Control Helps
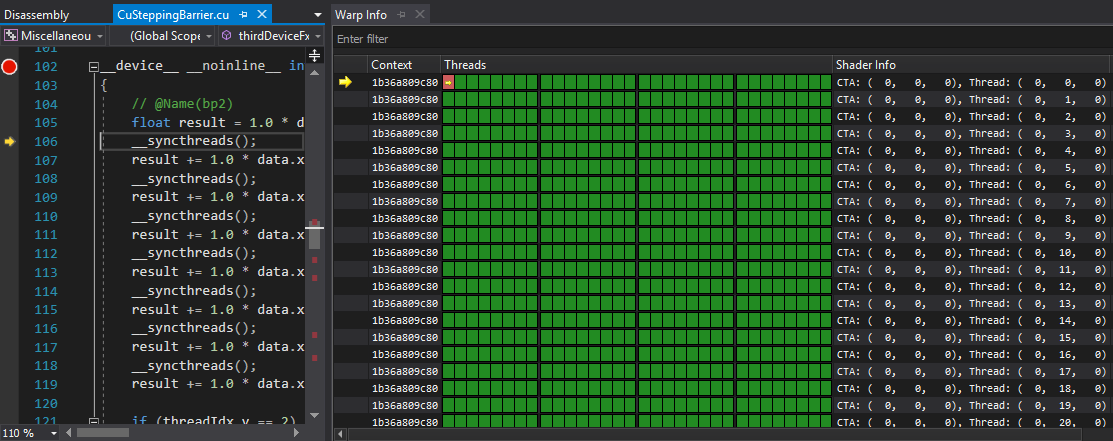
Prior to NVIDIA Nsight Visual Studio Edition 2019.3, the Next-Gen Debugger’s Global Freeze mode defaulted to Scheduler Locking Step Warp (only steps the active warp). When a barrier or end-of-global-kernel is hit, the active thread is stepped, then waits for the other warps in the block to hit the barrier, but they are all frozen, so no warps make progress and the kernel appears to be hung. To regain control of the execution, the user would have to use Debug > Break (Pause), and switch to another warp and/or change the Freeze mode to resume per block.
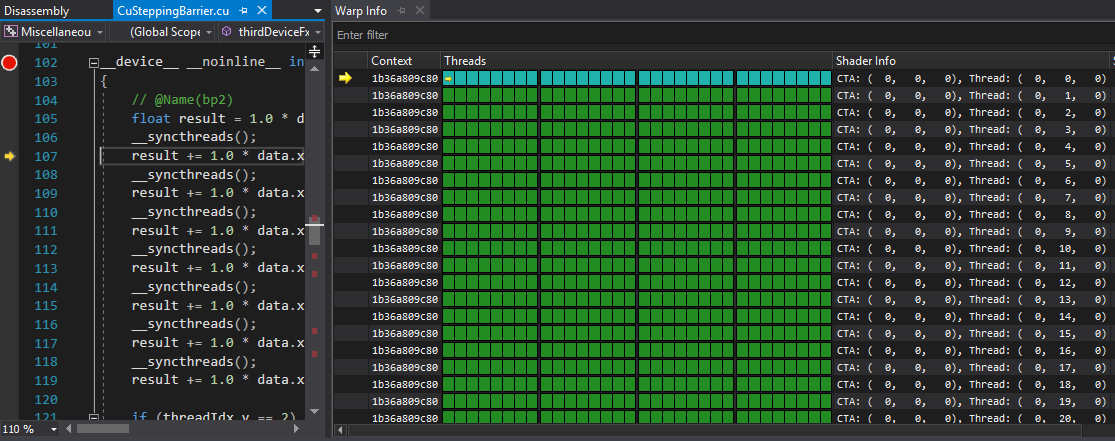
For example, this Warp Info page shows the active warp and thread (yellow arrow indicators) are stepping or at a breakpoint (red color – see Warp Info in Next-Gen Debugger State Inspection Views) and the remaining threads and warps in the block are active (green), but frozen and not making progress due to the Freeze Mode being set to Scheduler Locking Step Warp.
In NVIDIA Nsight Visual Studio Edition 2019.2 and earlier, attempting to step over a barrier (SASS BAR command or SyncThreads CUDA command) would cause the apparent hang described above.
As of version 2019.3, with Barrier/Warp-Exit mode set to Suspend, when the focus thread attempts to make progress (via step, continue, etc), it attempts to move past the barrier, but cannot until the remaining threads and warps reach the barrier. Notice that:
-
The instruction pointer has advanced past the __syncthreads() barrier (but will not advance further until the rest of the block catches up).
-
Warp (0,0,0) hit a barrier (teal color) and the remaining warps in the block are active (green) and still not making progress.
At this point:
-
Stepping the active warp will not result in any further progress.
-
Continuing (F5) will allow all warps to run to completion or the next breakpoint.
-
Changing the Freeze Mode to Scheduler Locking Step Block and stepping will allow the rest of the block to arrive at the barrier (and step the source Program Counter).
-
Changing the Freeze Mode to Scheduler Locking Resume All will allow all blocks to make progress (and step the source Program Counter).
5.2. Settings
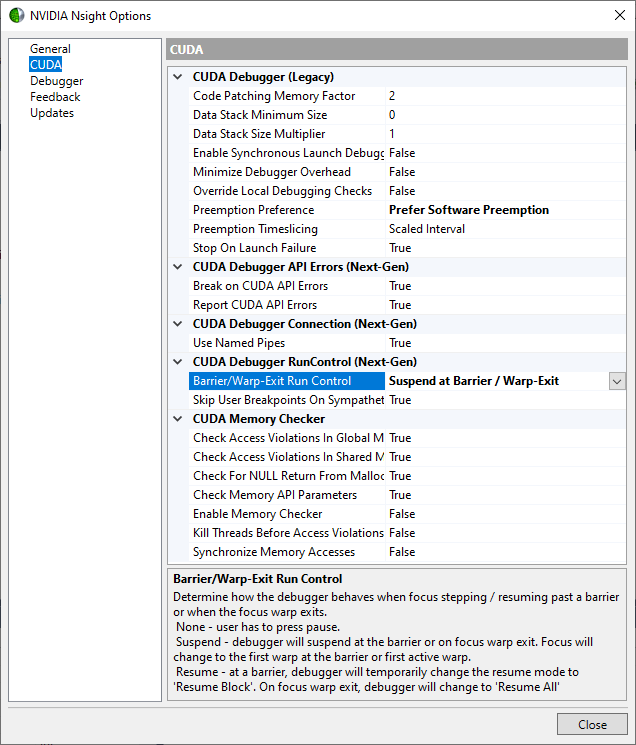
The settings to modify barrier and Warp-Exit run control behavior can be found under Nsight > Options > CUDA > CUDA Debugger RunControl (Next-Gen).
-
The Barrier/Warp-Exit Run Control settings determine how the debugger behaves when focus stepping or resuming past a barrier, or when the focus warp exits. The options are:
-
None – The active warp waits for the other warps in the block. However, the remaining warps are frozen and do not make progress. The kernel appears to hang.
The recommendation is to use Debug > Break (Pause) to change the active warp and/or the Global Freeze mode. Note you may end up on a CPU thread. In this case, you have to change the thread back to your CUDA thread to continue GPU debugging.
-
Resume at Barrier / Warp-Exit
-
Resume at a barrier – A warning notification appears:
Warning: Scheduler Locking Warp has been temporarily
changed to Scheduler Locking Block to step
past a barrier.
Stepping allows the entire block (including active warp) to step over the barrier, then refreezes the non-active warps (if Scheduler Locking Step Warp) or the other blocks (if Scheduler Locking Step Block).
Note:
Note: Other warps may make more progress than the focus warp.
-
Resume when exiting a __global__ function – The behavior matches the Resume mode. A warning notification appears:
Warning: Focus warp exited. Debugger automatically suspended.
The indicator falls into the next warp or block automatically, according to current Freeze Mode. Stepping allows the remaining warps to make progress, running to completion or hitting other breakpoints or barriers.
You can modify the Barrier/Warp-Exit Run Control setting to None to manually control the step warp.
-
- Suspend at Barrier / Warp-Exit
-
Suspend at a barrier – The active warp remains suspended at the barrier, while the other warps remain frozen (if Scheduler Locking Step Warp) or the other blocks remain frozen (if Scheduler Locking Step Block). A warning notification appears:
Warning: Focus warp hit a barrier.
Debugger automatically suspended.
Modify the 'Barrier/Warp-Exit Run Control' setting to change
this behavior.
-
Suspend when exiting a __global__ function – The behavior matches the Resume mode.
Warning: Focus warp exited.
Debugger automatically suspended.
The indicator falls into the next warp or block automatically, according to current Freeze Mode. Stepping allows the remaining warps to make progress, running to completion or hitting other breakpoints or barriers.
You can modify the Barrier/Warp-Exit Run Control setting to None to manually control the step warp.
-
-
-
Skip User Breakpoints on Sympathetic Warps can be set one of two ways:
-
True – Sympathetic warps ignore barriers and non-conditional breakpoints. These warps only suspend when focus warp hits a breakpoint or barrier.
-
False – This setting applies to stepping at a barrier and is not recommended for compute kernels with a high number of threads (e.g., graphics kernels). Performance may be severely impacted.
-
6. Break on Activity
In NVIDIA Nsight Visual Studio Edition 2020.2.0, the Next-Gen Debugger introduces options to halt execution when certain runtime activities occur, such as the launch of a kernel, or when API errors occur.
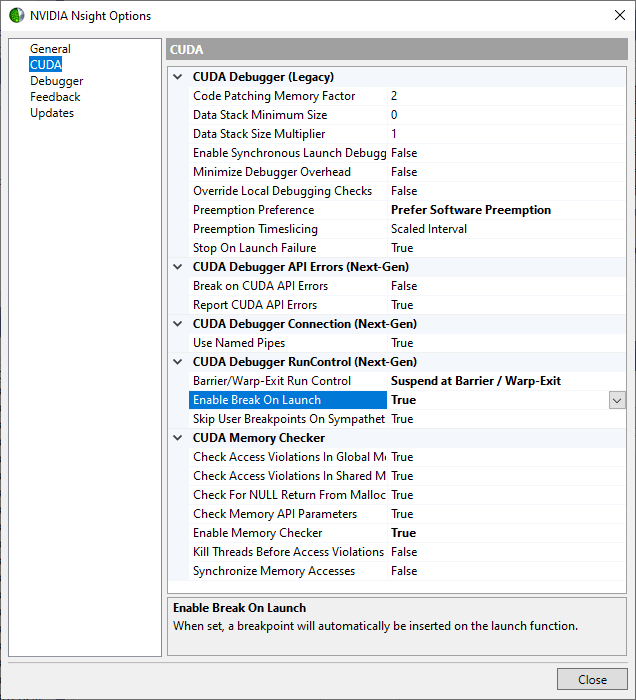
6.1. Break on Launch
Next-Gen Debugger can automatically insert an internal breakpoint on the launch function.
Enable the Break on Launch feature, by setting the option to 'True'.
You can easily toggle the Break on Launch behavior using the Nsight menu item:
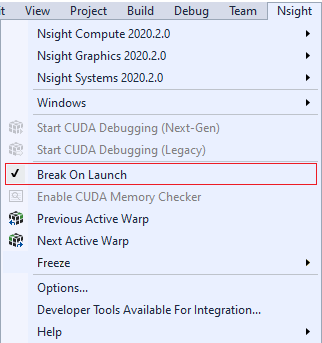
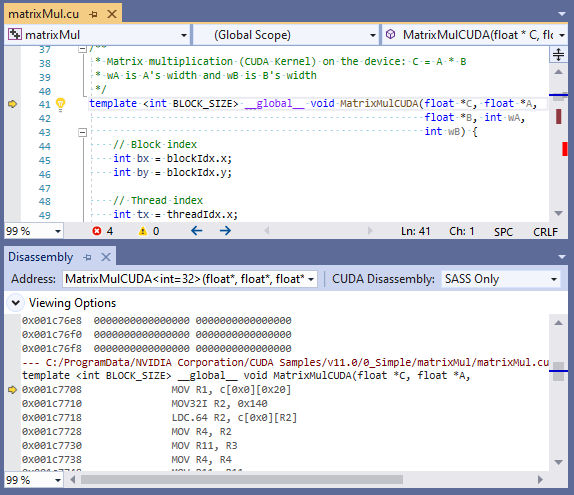
When enabled, execution will be halted when any[1] __global__ kernel is launched. This is useful to when setting function breakpoints is tedious. As shown below, there is no user breakpoint shown, but execution is halted on the kernel entry point.
[1] Note that this will not work on restricted Optix code.
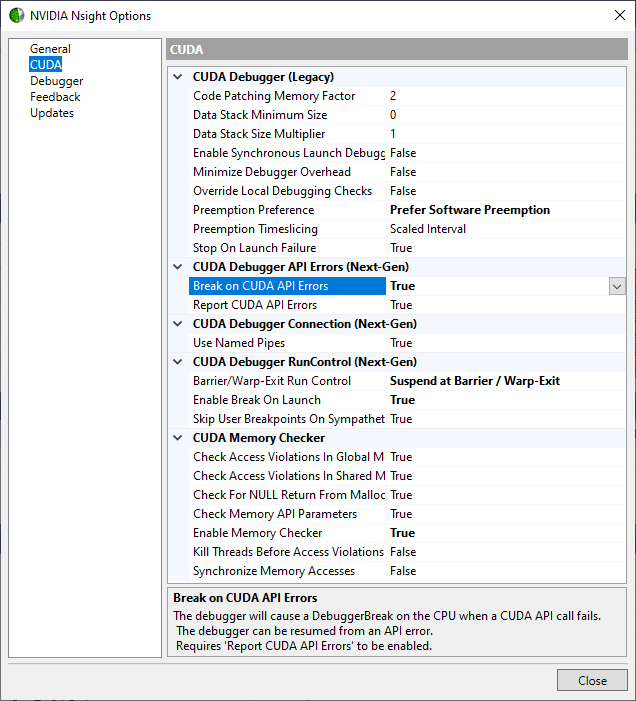
6.2. Break on API Error
- Report CUDA API Errors.
- When set to 'True', the debugger will log all CUDA API errors that occur in the target application.
- Break on CUDA API Errors.
- When set to 'True', the debugger will cause a CPU DebuggerBreak whenever a CUDA API call fails.
- Note that 'Report CUDA API Errors' must also be enabled for CUDA API errors to trigger the DebuggerBreak.
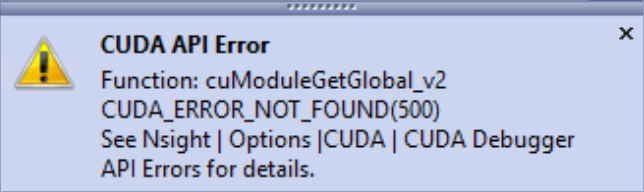
- A notification will appear, alerting you to the CUDA API error.
- Execution will be halted, allowing you switch to GPU threads and inspect the stack, variables, and GPU states.
Execution can be resumed (i.e. F5 to continue)
Notices
Notice
NVIDIA® Nsight™ Application Development Environment for Heterogeneous Platforms, Visual Studio Edition 2022.2.1 User GuideSend Feedback
THE INFORMATION IN THIS GUIDE AND ALL OTHER INFORMATION CONTAINED IN NVIDIA DOCUMENTATION REFERENCED IN THIS GUIDE IS PROVIDED “AS IS.” NVIDIA MAKES NO WARRANTIES, EXPRESSED, IMPLIED, STATUTORY, OR OTHERWISE WITH RESPECT TO THE INFORMATION FOR THE PRODUCT, AND EXPRESSLY DISCLAIMS ALL IMPLIED WARRANTIES OF NONINFRINGEMENT, MERCHANTABILITY, AND FITNESS FOR A PARTICULAR PURPOSE. Notwithstanding any damages that customer might incur for any reason whatsoever, NVIDIA’s aggregate and cumulative liability towards customer for the product described in this guide shall be limited in accordance with the NVIDIA terms and conditions of sale for the product.
THE NVIDIA PRODUCT DESCRIBED IN THIS GUIDE IS NOT FAULT TOLERANT AND IS NOT DESIGNED, MANUFACTURED OR INTENDED FOR USE IN CONNECTION WITH THE DESIGN, CONSTRUCTION, MAINTENANCE, AND/OR OPERATION OF ANY SYSTEM WHERE THE USE OR A FAILURE OF SUCH SYSTEM COULD RESULT IN A SITUATION THAT THREATENS THE SAFETY OF HUMAN LIFE OR SEVERE PHYSICAL HARM OR PROPERTY DAMAGE (INCLUDING, FOR EXAMPLE, USE IN CONNECTION WITH ANY NUCLEAR, AVIONICS, LIFE SUPPORT OR OTHER LIFE CRITICAL APPLICATION). NVIDIA EXPRESSLY DISCLAIMS ANY EXPRESS OR IMPLIED WARRANTY OF FITNESS FOR SUCH HIGH RISK USES. NVIDIA SHALL NOT BE LIABLE TO CUSTOMER OR ANY THIRD PARTY, IN WHOLE OR IN PART, FOR ANY CLAIMS OR DAMAGES ARISING FROM SUCH HIGH RISK USES.
NVIDIA makes no representation or warranty that the product described in this guide will be suitable for any specified use without further testing or modification. Testing of all parameters of each product is not necessarily performed by NVIDIA. It is customer’s sole responsibility to ensure the product is suitable and fit for the application planned by customer and to do the necessary testing for the application in order to avoid a default of the application or the product. Weaknesses in customer’s product designs may affect the quality and reliability of the NVIDIA product and may result in additional or different conditions and/or requirements beyond those contained in this guide. NVIDIA does not accept any liability related to any default, damage, costs or problem which may be based on or attributable to: (i) the use of the NVIDIA product in any manner that is contrary to this guide, or (ii) customer product designs.
Other than the right for customer to use the information in this guide with the product, no other license, either expressed or implied, is hereby granted by NVIDIA under this guide. Reproduction of information in this guide is permissible only if reproduction is approved by NVIDIA in writing, is reproduced without alteration, and is accompanied by all associated conditions, limitations, and notices.
Trademarks
NVIDIA, the NVIDIA logo, and cuBLAS, CUDA, CUDA-GDB, CUDA-MEMCHECK, cuDNN, cuFFT, cuSPARSE, DIGITS, DGX, DGX-1, DGX Station, NVIDIA DRIVE, NVIDIA DRIVE AGX, NVIDIA DRIVE Software, NVIDIA DRIVE OS, NVIDIA Developer Zone (aka "DevZone"), GRID, Jetson, NVIDIA Jetson Nano, NVIDIA Jetson AGX Xavier, NVIDIA Jetson TX2, NVIDIA Jetson TX2i, NVIDIA Jetson TX1, NVIDIA Jetson TK1, Kepler, NGX, NVIDIA GPU Cloud, Maxwell, Multimedia API, NCCL, NVIDIA Nsight Compute, NVIDIA Nsight Eclipse Edition, NVIDIA Nsight Graphics, NVIDIA Nsight Integration, NVIDIA Nsight Systems, NVIDIA Nsight Visual Studio Edition, NVLink, nvprof, Pascal, NVIDIA SDK Manager, Tegra, TensorRT, Tesla, Visual Profiler, VisionWorks and Volta are trademarks and/or registered trademarks of NVIDIA Corporation in the United States and other countries. Other company and product names may be trademarks of the respective companies with which they are associated.