1. Installation and Setup Essentials
To reduce the chance of encountering problems when installing the NVIDIA Nsight Visual Studio Edition tools, consider several items in advance. For example, determine whether you want to run the tools on one machine and debug your application on another, or if you will debug on a single machine. Performing remote debugging can be advantageous because the Visual Studio environment will continue to run on the host machine even if the target machine has to be rebooted because an application crash.
Remote debugging allows you to debug over a network, which means that a target machine can be made easily available to a development team, or to members who do not have physical access to the target GPU.
Before You Start
| Task | For more information, see... |
|---|---|
| Review the hardware and software requirements for the product to make sure that you have the minimum or recommended configurations. | System Requirements for NVIDIA® Nsight™ Software |
| Review the overview of installation procedures to make sure you understand the ways that you can configure your development system. | Target and Host Setup |
2. System Requirements for NVIDIA Nsight VSE Software
| Minimum | Recommended | |
|---|---|---|
| Operating System |
Windows® 10 RS4 (build 1803) Windows Server 2016 (64-bit) |
Minimum or higher |
|
CPU |
Intel(R) Pentium(R) Dual-core CPU or equivalent @ 1.6 GHz minimum |
Intel(R) >Pentium(R) Dual-core CPU or equivalent@ 2.2 GHz or higher |
|
Memory |
Host machine (with Visual Studio): 2 GB minimum Target machine: 2 GB minimum * |
Host machine (with Visual Studio): 2 GB or more Target machine: 4 GB or more |
|
Hard Disk Space |
330 MB for NVIDIA Nsight™ VSE software |
On a 64-bit machine with NVIDIA Nsight™ VSE Host software: 330 MB plus space for your project files. If using remote machine to run/debug target application, remote machine: 240 MB plus space for the debug version of your target application. |
|
Hardware |
Monitor dedicated to target GPU |
DVI connection recommended |
| Local debugging (host and target on same machine) |
One or more GPUs (for more information, see https://developer.nvidia.com/nsight-visual-studio-edition-requirements) For compute debugging, see Compute Debugger Supported Configurations. |
same as minimum |
|
Remote debugging (host and target on different machines) |
On the target machine: 1 GPU on target machine: must be a supported graphics card (see below). On the host machine (with Visual Studio): 1 GPU on host machine: can be any GPU For compute debugging, see Compute Debugger Supported Configurations. Note the Next-Gen Debugger does not yet support remote debugging. |
same as minimum |
| Software | ||
|
Display Driver |
You must install an NVIDIA display driver that supports NVIDIA Nsight™ VSE. Please see the release notes for compatible driver versions. |
same as minimum |
|
Local debugging (host and target are the same machine) |
.NET Framework 4.0 One or more of the following[1] :
For compute debugging, see Compute Debugger Supported Configurations. |
same as minimum |
|
Remote debugging (host and target on different machines) |
Host machine: .NET Framework 4.0 One or more of the following[1] :
Target machine:.NET Framework 4.0 For compute debugging, see Compute Debugger Supported Configurations. Note the Next-Gen Debugger does not yet support remote debugging. |
same as minimum |
|
Networking |
Internet connection to download installer For remote debugging: TCP/IP network to connect host machine to target machine |
same as minimum |
|
[1] Support for Visual Studio 2015, deprecated since 2020.2.0, has been dropped as of 2020.3.0. |
||
NVIDIA Nsight Visual Studio Edition supports four flexible hardware configurations:
- Single GPU System: For developers working on API level frame debugging[*], profiling, and GPGPU developer debugging with the NVIDIA Nsight™ VSE CUDA Debugger.
- Dual GPU System: The recommended single machine configuration for a GPGPU developer. This configuration supports both the NVIDIA Nsight™ VSE CUDA Debugger and Analyzer[*].
- Two systems, each with one GPU: The recommended configuration for graphics developers who need the additional power of the graphics API Frame Debugger[*] and Range Profiler[*], or developers doing both GPGPU and graphics tasks. Supports every GPGPU and graphics debugging[*], profiling[*], and analysis[*] features of the Nsight family of tools.
- Notebook equipped with NVIDIA Optimus technology: The recommended single notebook machine configuration for a GPGPU developer. This configuration supports both the NVIDIA Nsight™ VSE CUDA Debugger using NVIDIA Optimus technology.
[*] Note that NVIDIA Nsight Visual Studio Edition only supports GPGPU debugging.
- Graphics Range Profiling and Graphics Frame Debugging can be done with Nsight Graphics using NVIDIA Nsight Integration,
- System Trace Analysis should be done with Nsight Systems using NVIDIA Nsight Integration, and
- Kernel profiling may be accomplished with Nsight Coompute using NVIDIA Nsight Integration
2.1. Supported Graphics Cards
For the latest updates to the list of supported GPUs, see Nsight Visual Studio Edition Supported GPUs. For information on the compute debugger, see Compute Debugger Supported Configurations.
GeForce Quadro Tesla GeForce RTX 4090
GeForce RTX 4080
GeForce RTX 3090
GeForce RTX 3080
GeForce RTX 3070
NVIDIA TITAN RTX
NVIDIA TITAN V[2]
NVIDIA TITAN Xp[2]
NVIDIA TITAN X[2]
GeForce RTX 2080 Ti
GeForce RTX 2080 Super
GeForce RTX 2080
GeForce RTX 2070 Super
GeForce RTX 2070
GeForce RTX 2060 Super
GeForce RTX 2060
GeForce GTX 1660 Ti
GeForce GTX 1660
GeForce GTX 1650
GeForce GTX 1080 Ti[2]
GeForce GTX 1080[2]
GeForce GTX 1070Ti[2]
GeForce GTX 1070[2]
GeForce GTX 1060[2]
GeForce GTX 1050 Ti[2]
GeForce GTX 1050[2]
GeForce GT 1030[2]
GeForce GTX TITAN X
GeForce GTX 980 Ti[1]
GeForce GTX 980[1]
GeForce GTX 980M[1]
GeForce GTX 970[1]
GeForce GTX 970M[1]
GeForce GTX 960[1]
GeForce GTX 950[1]
GeForce GTX TITAN Black[1]
GeForce GTX TITAN[1]
GeForce GTX 780 Ti[1]
GeForce GTX 780[1]
GeForce GTX 780M[1]
GeForce GTX 770[1]
GeForce GTX 770M[1]
GeForce GTX 760[1]
GeForce GTX 760M[1]
GeForce GTX 750 Ti
GeForce GTX 750
GeForce GTX 745
GeForce GT 750M[1]
GeForce GT 745M[1]
GeForce GT 740M[1]
GeForce GT 735M[1]
GeForce GT 730M[1]
GeForce GTX 690[1]
GeForce GTX 680[1]
GeForce GTX 670[1]
GeForce GTX 660[1]
GeForce GTX 645[1]
GeForce GTX 660M[1]
GeForce GT 650M[1]
GeForce GT 640M[1]
Quadro RTX 8000
Quadro RTX 6000
Quadro RTX 5000
Quadro RTX 4000
Quadro GV100[2]
Quadro GP100[2]
Quadro P6000[2]
Quadro P5000[2]
Quadro P4000[2]
Quadro P2000[2]
Quadro P1000[2]
Quadro P600[2]
Quadro P500[2]
Quadro P400[2]
Quadro M6000
Quadro M5000
Quadro M4000
Quadro M2000
Quadro K6000[1]
Quadro K5200[1]
Quadro K5000[1]
Quadro K5000M[1]
Quadro K4200[1]
Quadro K4000[1]
Quadro K4000M[1]
Quadro K3000M[1]
Quadro K2200
Quadro K2000[1]
Quadro K2000M[1]
Quadro K1200
Quadro K1000M[1]
Quadro K620
Quadro K600[1]
Quadro K500M[1]
Quadro K420
Quadro 410[1]
NVIDIA H100 Tensor Core GPU
NVIDIA A100 Tensor Core GPU
Tesla T4
Tesla V100[2]
Tesla P100[2]
Tesla P40[2]
Tesla P4[2]
Tesla M60
Tesla M40
Tesla M10
Tesla M4
Tesla K80[1]
Tesla K40[1]
Tesla K20[1]
Tesla K10[1]
[1] Note that new NVIDIA Nsight Visual Studio Edition 5.3 and newer metrics may not be available on Kepler-based GPUs.
[2] NVIDIA Nsight™ VSE 5.5 and 5.6 now support CUDA debugging in TCC mode on Pascal and later family GPUs using the Next-Gen CUDA debugger. WDDM support is supported as of the 6.0 release. See below for more details on the Next-Gen CUDA debugger.
-
GPU Support Cut/Dropped in the 2020.1 release
-
NsightVSE 2020.1 removes support for sm-30 - "GK104", "GK106", "GK107"
-
-
Imminent GPU "Support Removal in the next release" deprecation notice
-
NsightVSE 2020.1 deprecates sm-35 - "GK110", "GK208"
-
NsightVSE 2020.1 deprecates sm-37 - "GK210"
-
NsightVSE 2020.1 deprecates sm-50 - "GM107", "GM108"
-
2.2. Compute Debugger Supported Configurations
CUDA Debugger support for Pascal, Volta, Turing and Ampere family GPUs is undergoing a transition that requires a new NVIDIA Nsight Visual Studio Edition compute debugger we are calling Next-Gen.
The Legacy Compute Debugger, provided in NVIDIA Nsight™ VSE 6.0 and earlier, will not support Pascal (or later) GPUs running with TCC mode drivers, or Volta (or later) ;GPUs in either TCC or WDDM mode.
The Next-Gen Compute Debugger will support Pascal, Volta, and Turing GPUs.
Starting with NVIDIA Nsight™ VSE 5.5, both the Legacy and Next-Gen compute debuggers are available on the Visual Studio NSIGHT menu.
In NVIDIA Nsight™ VSE 5.5 and 5.6:
-
Pascal and Volta hardware may be debugged in the TCC driver mode using the Next-Gen CUDA debugger.
-
Pascal GPUs may be debugged in the WDDM driver mode using the Legacy CUDA debugger.
-
Maxwell and earlier GPUs may be debugged on Legacy hardware.
-
Volta GPU support on WDDM mode drivers is only available as of the 6.0 release with r400 drivers.
As of NVIDIA Nsight Visual Studio Edition 6.0, the Next-Gen CUDA debugger adds support for:
-
Turing family GPU debugging in the TCC driver mode.
-
Pascal, Volta, and Turing family GPU debugging in the WDDM driver mode with 410.29 or later drivers, and Win10RS4 or later.
In NVIDIA Nsight Visual Studio Edition 2020.1:
-
NVIDIA Ampere GA100 support was added for the Next-Gen Debugger (in r445 and r450 TCC driver mode only)
-
Kepler (sm_30, sm_32) support was dropped from the Legacy debugger
-
Kepler (sm_35, sm_37, sm_50) support had been deprecated in the Legacy debugger
-
Pascal support was dropped from the Legacy debugger
-
Windows 7 support was dropped for all debuggers
-
445.53 or later drivers are required for all debuggers as of Nsight VSE version 2020.1
In NVIDIA Nsight Visual Studio Edition 2020.2:
-
NVIDIA Ampere GA102 ang GA104 support was added for the Next-Gen Debugger
-
455.00 or later drivers are required for all debuggers as of Nsight VSE version 2020.2
Please refer to the table below for supported compute debugger, driver, GPU, and OS configurations.
| Supported NVIDIA GPU architecture, driver, and OS configurations for the Legacy and Next-Gen CUDA Debuggers | ||||
|---|---|---|---|---|
| Operating System |
Windows 7 Dropped in v2020.1 |
Windows 10, 11 | ||
| Driver mode | WDDM RS4 → | TCC | ||
| Driver version | r445 → | r445 → | ||
|
Kepler sm_30, sm_32 |
Dropped in v2020.1 |
 |
|
|
| Kepler sm_35, sm_37, sm_50 | Legacy | |
 |
|
| Next-Gen | UNSUPPORTED | |||
|
Maxwell |
Legacy | |
||
| Next-Gen | UNSUPPORTED | |||
| Pascal | Legacy | |
|
|
| Next-Gen | ||||
|
Volta Turing Ampere |
Legacy | |
||
| Next-Gen | ||||
| Supported configuration for the CUDA debugger. | |
| CUDA debugger is incompatible with this GPU, driver, and/or OS. | |
| UNSUPPORTED | Unsupported by the CUDA debugger. Multi-context applications will not work. |
| N/A | Invalid GPU/driver combination. |
|
Deprecated GPU. NVIDIA Nsight™ VSE support for this GPU will be removed in a future release. |
|
Support for this configuration has been cut/dropped in version 2020.1. |
3. How To: Install the Suite of NVIDIA Nsight Developer Tools
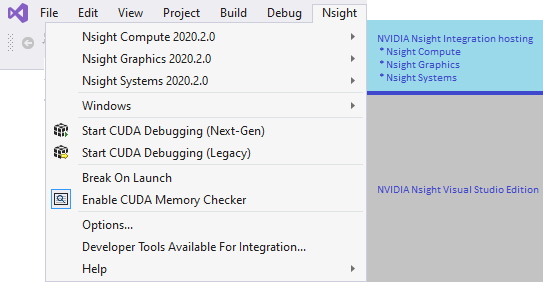
Among the many tools NVIDIA provides for GPU-based application development, the NVIDIA Nsight suite of tools integrate into Visual Studio. In order to use the full suite of NVIDIA Nsight tools within Visual Studio, you'll need to download and install the following tools:
| NVIDIA Nsight Tool | Purpose | Requires NVIDIA Nsight Integration for Use in Microsoft Visual Studio |
|---|---|---|
| NVIDIA Nsight Visual Studio Edition | CPU+GPU CUDA debugger for integrated Visual Studio development, build, debugging, code correctness, and core dump analysis. | No, this tool self-integrates |
| NVIDIA Nsight Compute | CUDA application interactive kernel profiler |
Visual Studio extension allowing integration of participating NVIDIA Nsight tools. |
| NVIDIA Nsight Graphics | Graphics application frame debugger and profiler | |
| NVIDIA Nsight Systems | System-wide-performance analysis tool | |
|
[1] Install this extension from either of the following:
|
||
3.1. For More Information about Using This Extension
Please visit the following for NVIDIA Nsight Developer Tools Visual Studio Integration:
3.2. Download NVIDIA Nsight Integration from the Visual Studio Marketplace
Install this extension from either of the following:
- Microsoft Visual Studio Marketplace
- Visual Studio main menu > Tools > Extensions & Updates > Online > Visual Studio Marketplace > Tools' Nsight Developer Tools Integration
3.3. For More Information about NVIDIA Developer Tools
NVIDIA provides a host of tools for GPU-based application development targeted at many hardware platforms and operating systems. To learn more, please visit:
4. How To: Install NVIDIA Nsight Visual Studio Edition
The NVIDIA Nsight Visual Studio Edition software comprises two main pieces of software:
-
The Nsight Monitor, and
-
The Visual Studio® extensions.
You need to install Nsight Monitor on both your target and host machines. Note that in order to run a CUDA-based application, the target machine must have a graphics card that supports CUDA. See the System Requirements for NVIDIA® Nsight™ Software for a complete list.
4.1. Install the NVIDIA Nsight VSE Software
-
Obtain the installer from NVIDIA. Choose the version of the installer that is appropriate for your operating system.
-
Run the installer.
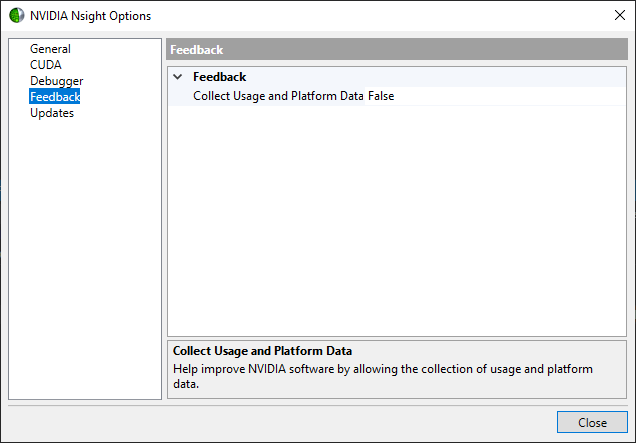
The next page asks for permission to collect anonymous usage data to help NVIDIA improve Nsight Visual Studio Edition.
Note that your preference may be changed at any time using the Visual Studio main menu > Nsight > Options > Feedback menu. (See Host Basics for more information.)
-
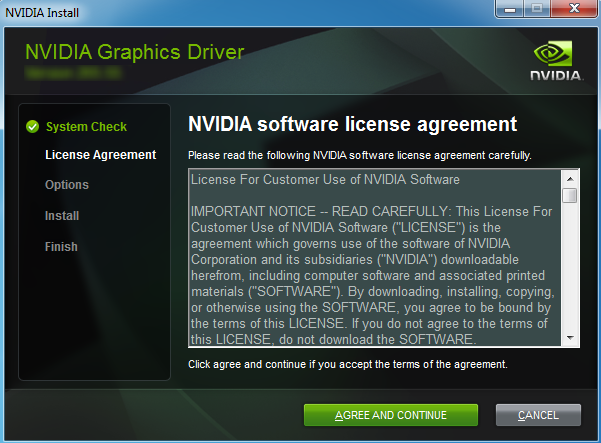
On the first screen, accept the license agreement, and click Next.
-
The next screen allows you to customize the features that will be installed. These include:
-
NVIDIA Nsight for Visual Studio[1] 2017, 2019, or 2022.
(Note: for Visual Studio 2017, 2019, and 2022 the NVIDIA Nsight™ VSE installation setting will apply to all instances of the respective version.)
-
NVIDIA Nsight™ VSE Monitor.
-
-
Click Install to begin the installation process. You may get a warning message, asking you to verify that the software you are installing is from a trusted source. In this case, click Yes and the installation will continue.
-
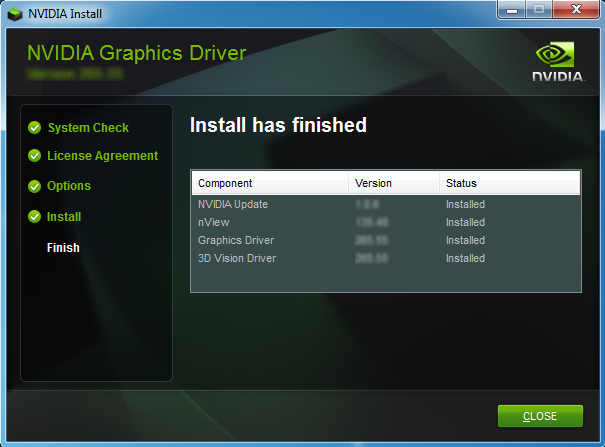
Click Finish to complete the installation.
C:\Program Files (x86)\NVIDIA Corporation\Nsight Visual Studio Edition 2022.3
[1] Support for Visual Studio 2015, deprecated since 2020.2.0, has been dropped as of 2020.3.0.
4.2. Running the Nsight Monitor
4.2.1. Security and Authentication
The Nsight Monitor requires administrator authentication to run. UAC can affect how Windows prompts you to authenticate.
SCENARIO 1 (UAC not enabled and remote debugging):
Suppose that you have configured your system for remote debugging, and that you log on to the remote machine as User1. If Windows User Account Control (UAC) is not enabled, User1 can start the Nsight Monitor only if the user account has Administrator privileges on that remote machine. For example, User1 could start the Nsight Monitor if User1 is:
-
A member of the Administrators local group, or
-
A domain account that has been added to the administrators group on the remote machine, or
-
Defined by Group Policy to have local administrator privileges, or
-
An Administrator account.
SCENARIO 2 (UAC enabled and remote debugging):
Suppose you log on to the remote machine as User2. If Windows User Account Control (UAC) is enabled, when you attempt to start the Nsight Monitor on the remote machine, you will be prompted to provide authentication.
-
If User2 does not have administrator privileges, you will be prompted for a username and password that has Administrator privileges.
-
If User2 has Administrator privileges, you will need to click Allow when prompted by the User Account Control window.
For more information on UAC, see: http://windows.microsoft.com/en-US/windows7/what-is-user-account-control
|
Note: |
Scenario 2 tends to be a more secure method for launching the Nsight Monitor because the administrator privileges apply only to the running of the Monitor. |
4.3. Non-ASCII Characters in Hostnames
If you install the Nsight Monitor on a machine that uses international characters you must modify one of the Visual Studio configuration files. An international character is a Unicode character that is not in the set of ASCII characters, such as Cyrillic characters, characters with accent marks, or characters used in non-English languages such as ñ.
To add support for international characters:
-
Open the devenv.exe.config file in your Visual Studio installation directory.
-
Add the following text:
<configuration>
	<configSections>
	     <section
	         name="uri"
	         type="System.Configuration.UriSection, System,  Version=2.0.0.0,
	         Culture=neutral,
	         PublicKeyToken=b77a5c561934e089" />
	</configSections>
	    <uri>
	        <idn enabled="All"  />
	        <iriParsing enabled="true" />
	    </uri>
</configuration>
-
Save and close the devenv.exe.config file.
Be aware that there are side effects to changing the above configuration file. For more information, please refer to the NVIDIA forums:
5. Target and Host Setup
NVIDIA Nsight™ VSE allows you to debug your applications in two different ways:
-
Local debugging, in which the host and target are on the same machine.
-
Remote debugging, in which the host and target are on two different machines.
5.1. Local Debugging
|
Note: |
When using NVIDIA Nsight™ VSE to debug certain types of applications (such as most graphics applications), it's generally recommended to use a remote debugging configuration, as local debugging can adversely impact the performance of your application. |
If you configure your system for local debugging, you will use a single computer to build the project and run the application to be debugged. This means that you will need to have one or more GPUs in your computer, and must meet minimum requirements. (See System Requirements for a list of supported GPUs.) Note that CUDA debugging only requires one GPU
5.2. Remote Debugging
If you choose to configure your systems for remote debugging, you will use one computer as the host machine. The host machine will run Visual Studio to build your project, as well as to launch debugging sessions.
Meanwhile, a separate computer is configured as the target machine. The target will do the following:
-
Run the NVIDIA Nsight™ VSE Monitor. The monitor detects incoming requests from the host to execute an application on the target machine.
-
Run the application to be debugged or analyzed. NVIDIA Nsight™ VSE software manages the synchronization of files between the host and target machines.
Performing remote debugging this way can be advantageous because the Visual Studio environment will continue to run on the host machine, even if the target machine has to be rebooted because of an application crash. Remote debugging also allows you to debug over a network, which means that a target machine can be made easily available to a development team, or to members who do not have physical access to the target GPU.
5.3. Target Basics
When debugging an application with NVIDIA Nsight™ VSE, the computer that will run both the application that is being analyzed as well as the Nsight Monitor is commonly referred to as the target. The Nsight Monitor detects incoming requests from the host to launch an application on the target machine.
The target computer does not need to be running Visual Studio. As long as the application itself will run on the machine, all you need to install on the target is the Nsight Monitor software.
5.3.1. Configure Remote Debugging on the Target Computer
-
After installing the NVIDIA Nsight™ VSE software on the target, start the Nsight Monitor.
-
Click the Windows Start Menu in the bottom left corner of the screen.
-
Scroll down the through the installed programs and select: NVIDIA Corporation > Nsight Monitor.
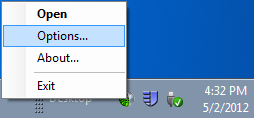
The Nsight Monitor starts. The monitor icon appears in the system tray.
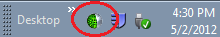
-
-
Right-click the Nsight Monitor icon in the system tray, and select Options.
-
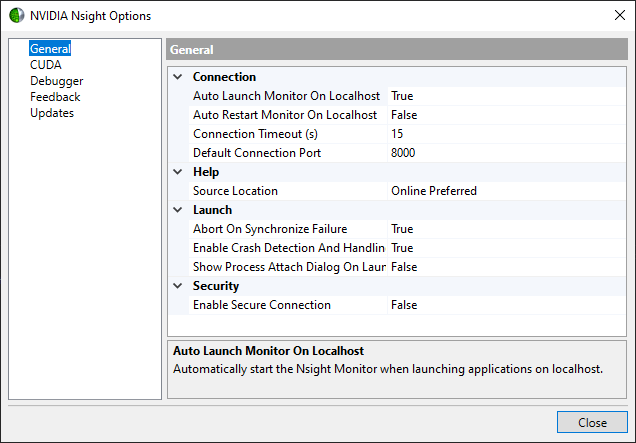
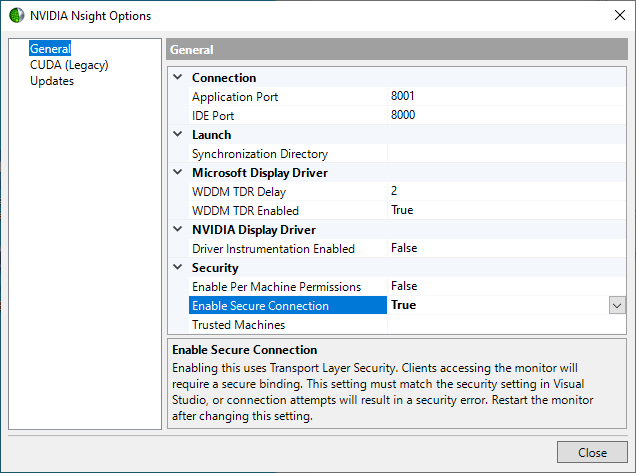
On the General page of the Options screen, you have the option to change the communication port numbers used by NVIDIA Nsight™ VSE as well as your application. The default port number for NVIDIA Nsight™ VSE is 8000, while the default port for the application is 8001. Note that the port number on both the host and target machines must match in order for a successful connection to occur. (See Host Basics for more information.)
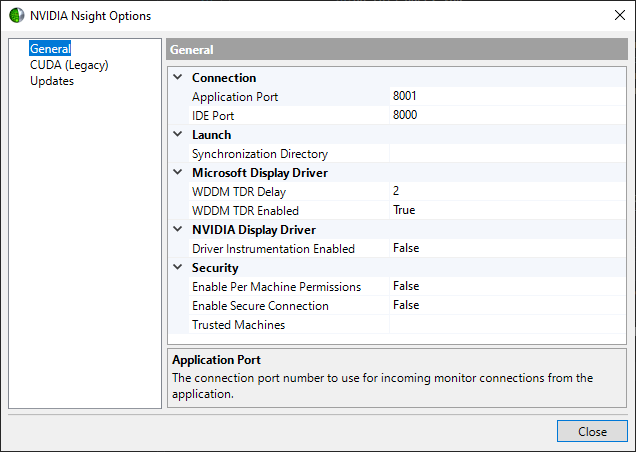
On this page, you can select whether or not to enable secure server, and also enter the computer names of trusted machines that can connect to the target computer.
To enable certain debugging functions, you may need to adjust the Windows Timeout Detection and Recovery settings. See Timeout Detection and Recovery for more information.
Note:
Note on Next-Gen Debugger port usage: Although not specifically configurable, the Next-Gen Debugger uses port 4501, but may use up to 4510, if 4501 is in use. Therefore, opening the range of 4501-4510 is recommended when using the Next-Gen Debugger.
-
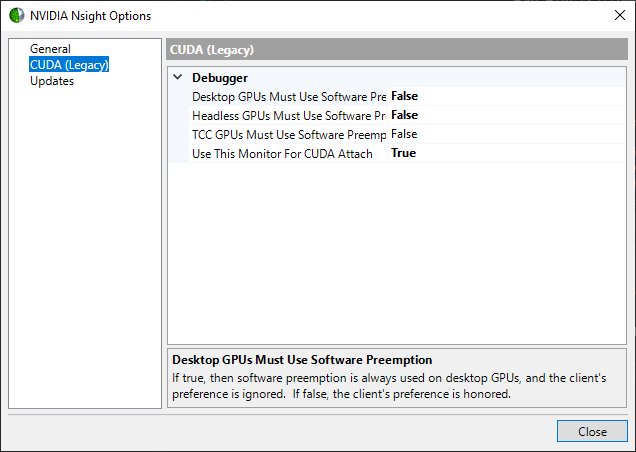
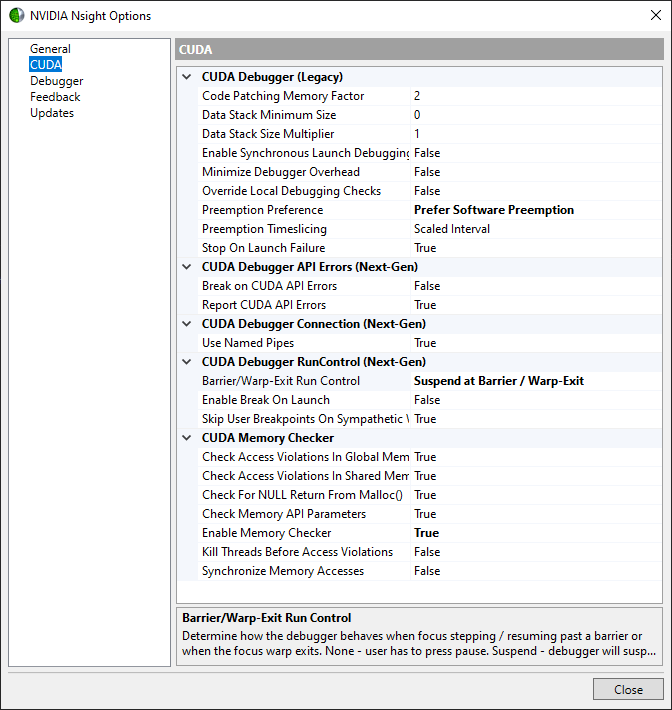
On the CUDA (Legacy) page, you can set the various options for the Legacy CUDA Debugger, such as whether or not to allow the Nsight Monitor to attach to CUDA applications that are already running.
-
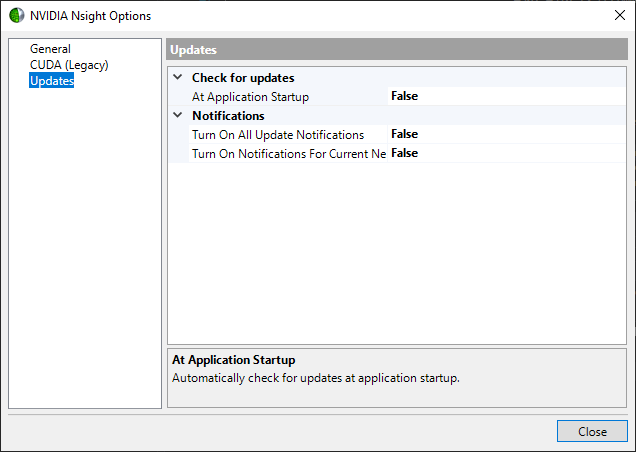
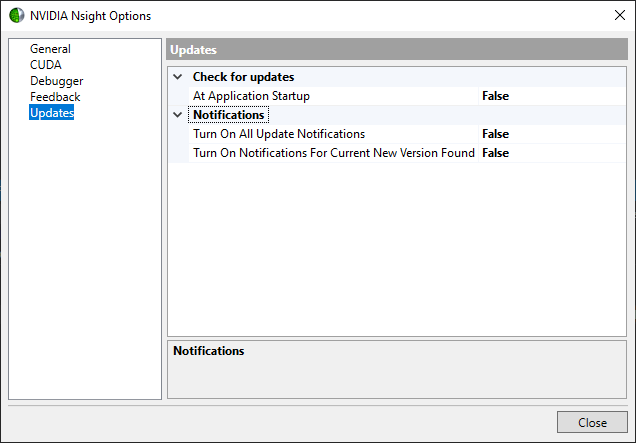
On the Updates page, configure the options that NVIDIA Nsight™ VSE will use to check for updates.
-
Click OK to apply your new settings.
5.4. Host Basics
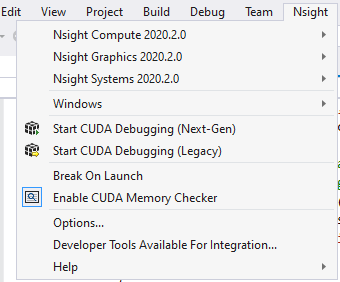
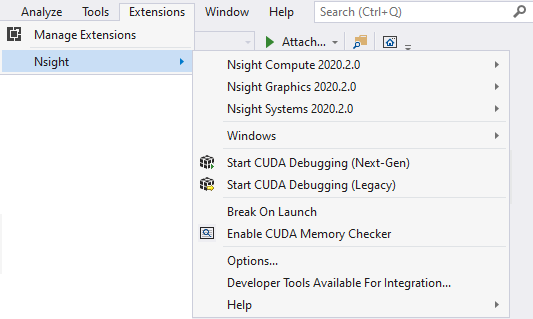
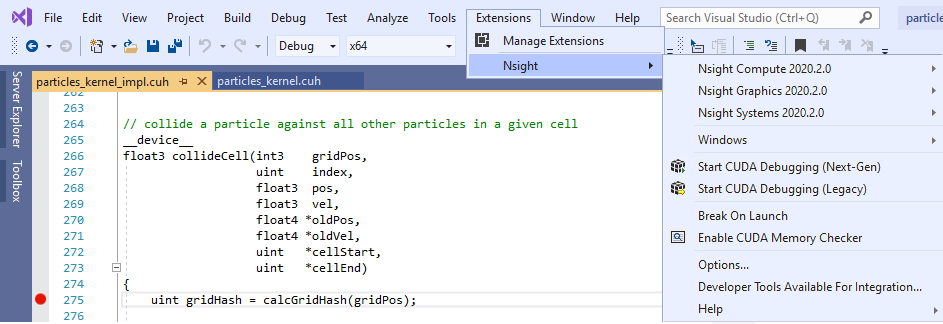
In NVIDIA Nsight Visual Studio Edition, the host is the term for the computer that is running Visual Studio, where your application is being built and debugged. After you install NVIDIA Nsight™ VSE on your computer, you will see a new menu called Nsight on your Visual Studio taskbar.
| Visual Studio 2017 and earlier | Visual Studio 2019 and later |
|---|---|
|
|
|
|
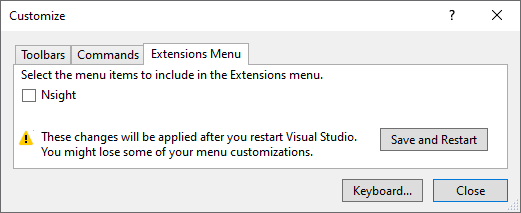
In Visual Studio 2019 Update 4 and later, you can choose to move the Nsight menu to
the Visual Studio main menu by using the Visual Studio main menu
> Tools > Customize, then unchecking the following
(assuming both are installed):
After restarting Visual Studio, Nsight will no longer be included under the Extension menu. Instead, the Nsight menu will appear on the Visual Studio main menu. NOTE: This must be done for each extension after integration of the extension. By default, the installer places the extension under the Extensions menu. |
|
Feel free to explore the various options on this menu. The items that are critical for debugging will be discussed in further detail in later topics.
5.4.1. NVIDIA Nsight Host Settings
After installing NVIDIA Nsight™ VSE on the host machine, open Visual Studio and go to Nsight > Options to configure your settings.
-
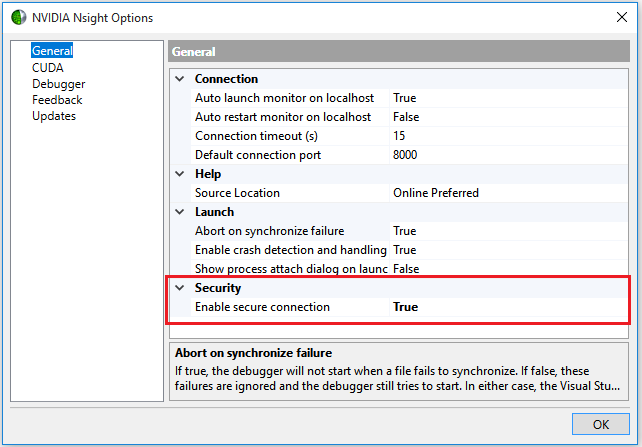
On the General page, configure some of the basic options such as timeouts, whether to enable secure connections, and which port NVIDIA Nsight™ VSE should use to connect to the target machine.
Note that the default port setting is 8000. The port number on both the host and target machines must match in order for a successful connection to occur. (See Target Basics for more information.)
-
On the CUDA page, you can configure several options for both the Legacy CUDA Debugger as well as the CUDA Memory Checker.
-
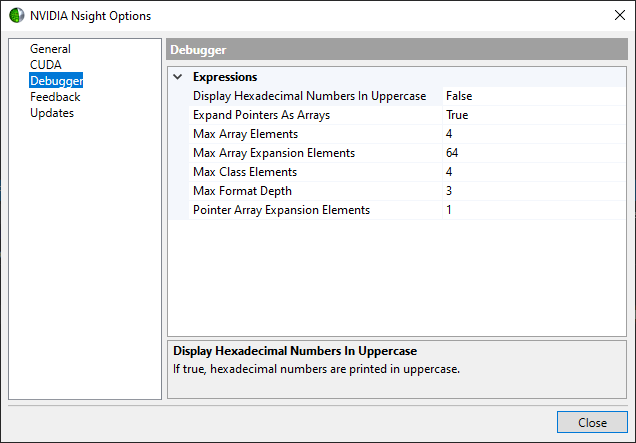
On the Debugger page, configure some basic display options for NVIDIA Nsight™ VSE.
-
On the Feedback page, you can choose whether or not to allow the collection of anonymous usage data to help NVIDIA improve Nsight Visual Studio Edition.
-
On the Updates page, select whether or not you want NVIDIA Nsight™ VSE to automatically search for updates upon startup.
Click OK when you are finished configuring your options for NVIDIA Nsight™ VSE.
5.4.2. Configuring NVIDIA Nsight VSE on the Host Machine
After NVIDIA Nsight™ VSE has been installed on the host machine, it will need to be configured. To do this:
-
Open your project in Visual Studio.
-
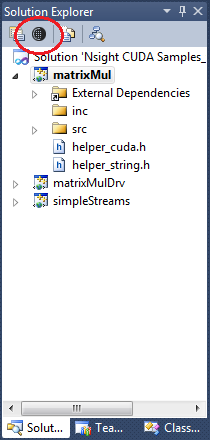
On the Solution Explorer menu, click the Nsight User Properties icon. (As an alternative, you can also go to the Project menu > Nsight User Properties.)
-
This will open the NVIDIA Nsight™ VSE User Settings dialog box.
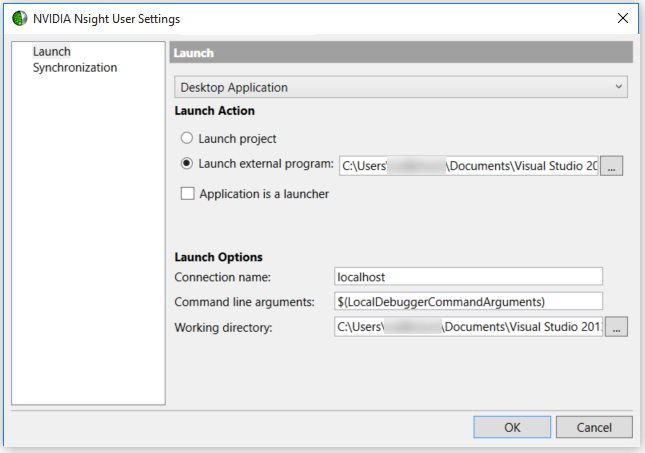
On the default Launch page, you configure the appropriate actions and options to be used when you begin debugging your project.
-
At the top, choose from the drop-down whether you are debugging a desktop or UWP application.
-
For Launch external program, enter the file path to the application that is being debugged.
-
For applications that are launched by another application (such as a Steam app or a proprietary launcher app), you should check the Application is a launcher checkbox.
-
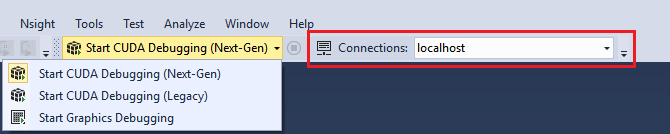
The Launch Options section allows you to configure the address of the target machine, any command line arguments needed, and set the working directory.
The Connection name field can be the IP address of the machine on your local network, or the machine name as recognized on your network (see Recommended IP Address Formatting for more information).
Note that you can also opt to use the Nsight Connections toolbar to specify the address of the computer that should be used for running the target application.
-
-
Click the Synchronization page.
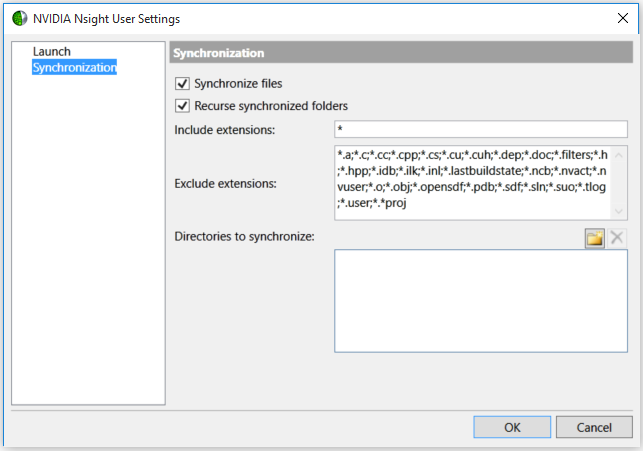
From here, you can choose which file extensions to include or exclude for synchronization purposes.
If you're debugging a large application, you'll want to turn off synchronization to prevent performance problems.
Note: When using file synchronization, all file paths are relative to localhost.
When file synchronization is turned off, the file path is relative to the target machine (which could be localhost as well, depending on your settings.)
5.4.3. Recommended IP Address Formatting
|
IPv6 |
IPv6 addresses should be formatted according to the IEFF RFC 5952 specification. |
Examples: |
|---|---|---|
|
IPv6 addresses without port specification uses colons as group delimiters or optional square brackets. |
2001:cb8:3:16d3:131:98a2:370f:7324 Or [2001:cb8:3:16d3:131:98a2:370f:7324] |
|
| IPv6 with port specification requires square brackets surrounding the address so the following colon is recognized as a port delimiter. | [2001:cb8:3:16d3:131:98a2:370f:7324]:443 |
|
IPv4 |
IPv4 addresses should be formatted according to the IETF RFC 791. |
Examples: |
|---|---|---|
| IPv4 addresses without port specification use decimals as group delimiters. | 169.244.0.23 | |
| IPv4 addresses without port specification use a colon as the port delimiter. | 169.244.0.23:443 |
|
DNS |
The trusted machine's address can also be specified as a DNS address or hostname. |
Examples: |
|---|---|---|
| Addresses may be specified without a port. | Computer.domain.com localhost | |
| Addresses may be specified with a port. | Computer.domain.com:443 |
Note that specifying the port in the address overrides the default port.
There are multiple places that the target machine can be specified. The order of preference is as follows:
-
Address/port that defaults to the address specified in the Nsight Connections toolbar
-
If a project is open, the address/port set in the Launch Options
-
If none of the above apply (e.g. if no project is loaded and/or the global connection setting has been disabled), the default connection will be localhost.
|
Note: |
NVIDIA Nsight™ VSE does not support zone indexes when using IPv6 link-local addressing. For example, instead of: fe80::1ff:fe23:4567:890a%eth2 (customary on Linux) fe80::1ff:fe23:4567:890a%3 (customary on Windows) Use this instead: fe80::1ff:fe23:4567:890a |
5.5. Setup Remote Debugging
To configure NVIDIA Nsight™ VSE in a remote debugging configuration, follow these steps:
-
Make sure that the target machine (this machine must have a supported GPU) and the host machine meet the system requirements.
For more information, see System Requirements for NVIDIA Nsight Software.
-
Install the NVIDIA Display Driver that came with the NVIDIA Nsight™ VSE tools.
If you already have an NVIDIA driver installed, the installer replaces it with an updated driver.
For more information, see How To: Install the NVIDIA Display Driver.
-
Install the NVIDIA Nsight™ VSE software on the target machine.
For more information, see How To: Install NVIDIA Nsight VSE.
-
Start the Nsight Monitor.
-
On the target machine, click the Windows Start Menu in the bottom left corner of the screen.
-
Scroll down the through the installed programs and select: NVIDIA Corporation > Nsight Monitor.
The Nsight Monitor starts. The monitor icon appears in the system tray.
-
-
Make any necessary configuration changes to the Nsight Monitor. (See Target Basics for more information on configuring the target machine, and see Timeout Detection and Recovery for information on configuring TDR settings.)
-
Certain changes will require you to reboot the target machine; others only require you to exit and restart the Nsight Monitor itself.
-
Install the NVIDIA Nsight™ VSE software on the host machine. For more information, see How To: Install NVIDIA Nsight™ VSE.
You have completed the installation of components needed to perform remote debugging.
5.6. Setup Local Debugging
To configure NVIDIA Nsight™ VSE in a local debugging configuration, follow these steps:
-
Make sure that the machine you are using meets the system requirements.
For more information, see System Requirements for NVIDIA Nsight Software.
-
Install the NVIDIA Display Driver that came with the NVIDIA Nsight™ VSE tools.
If you already have an NVIDIA driver installed, the installer replaces it with an updated driver.
For more information, see How To: Install the NVIDIA Display Driver.
-
Install the NVIDIA Nsight™ VSE software.
For more information, see How To: Install NVIDIA Nsight VSE.
-
Start the Nsight Monitor.
-
On the target machine, click the Windows Start Menu in the bottom left corner of the screen.
-
Scroll down the through the installed programs and select: NVIDIA Corporation > Nsight Monitor.
The Nsight Monitor starts. The monitor icon appears in the system tray.
-
-
Make any necessary configuration changes to the Nsight Monitor. (See Target Basics for more information on configuring the target machine, and see Timeout Detection and Recovery for information on configuring TDR settings.)
-
Certain changes will require you to reboot the target machine; others only require you to exit and restart the Nsight Monitor itself.
You have completed the installation of components needed to perform local debugging with NVIDIA Nsight™ VSE.
5.7. Setup Hybrid Mode
NVIDIA Nsight Visual Studio Edition is able to profile and debug applications on laptops using Windows 10 Hybrid mode. In order to do so, you will need to configure your machine to use the high-performance NVIDIA GPU for NVIDIA Nsight™ VSE.
There are two methods to direct an application to use the NVIDIA GPU.
-
Configure all applications use the NVIDIA GPU.
-
Configure only specific applications to use the NVIDIA GPU.
The first option is the easiest to control, but may adversely affect overall system performance. The second option is more fine grain and allows the system to maintain lower power.
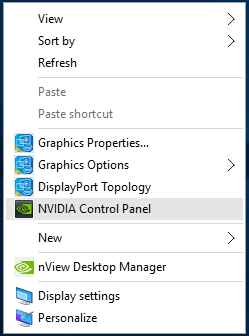
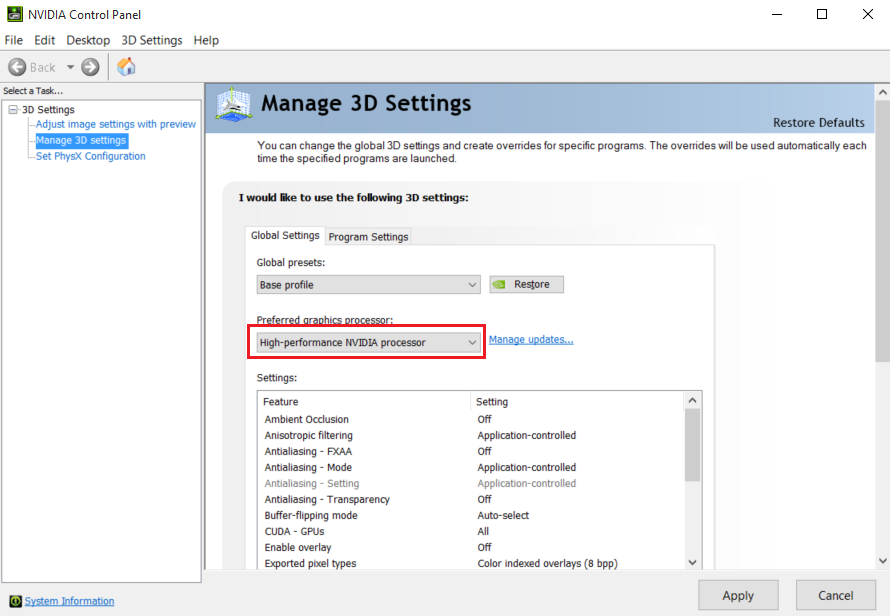
To get started, right-click on your desktop, and open the NVIDIA Control Panel.
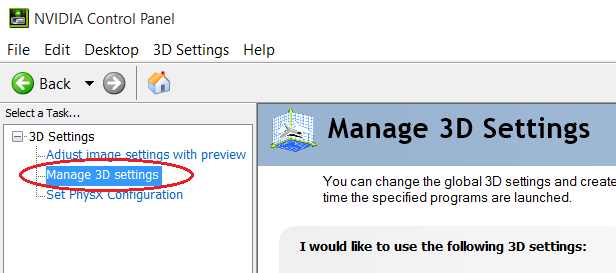
Once the NVIDIA Control Panel has opened, click Manage 3D Settings.
5.7.1. Option 1: Global Settings
-
On the Global Settings tab, select the drop-down menu under Preferred graphics processor, and select High Performance NVIDIA processor.
-
Click Apply to save the changes. All applications can now be profiled, traced, and debugged in Hybrid mode.
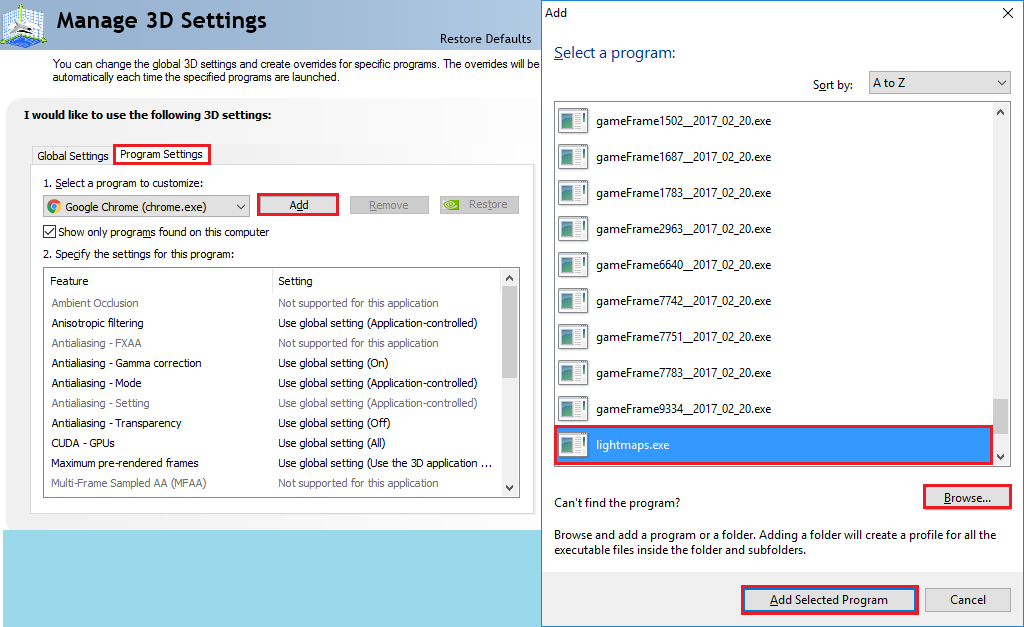
5.7.2. Option 2: Program Settings
On the Program Settings tab, you can add each application that should run on the NVIDIA GPU.
-
Under 1. Select a program to customize, press Add to select a running instance of the executable to be debugged, profiled, and/or traced. You may also Browse directly to the location of the desired executable.
If you plan on running a serialized frame capture, the solution (and built executable) are typically found in:
C:\Users\<user>\Documents\NVIDIA Nsight\Captures\<TimeStampedCaptureProcess>
with the built executable in the subdirectory:
<architecture>\<build>\<TimeStampedCaptureProcess>.exe
-
Press Add Selected Program to confirm your selection.
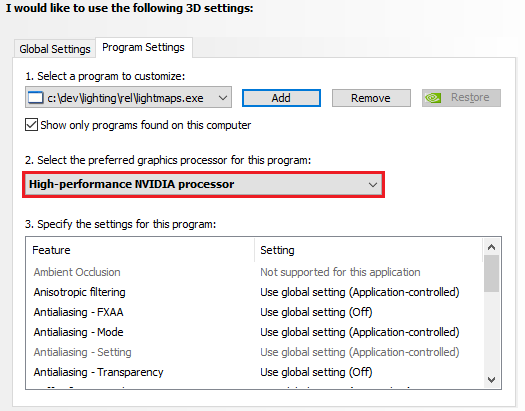
-
Click the drop-down menu under 2. Select the preferred graphics processor for this program:, and select High-performance NVIDIA processor.
-
Click Apply to save the changes. The specified application(s) can now be profiled, traced, and debugged in Hybrid mode.
5.8. Setup Local Headless GPU Debugging
On a computer that has two GPUs, you can designate one GPU as the "headless GPU." In this case, the term "headless" refers to a configuration in which the additional GPU does not send display information to a display monitor.
The reason that you may choose to use headless GPU debugging is because the Windows operating system normally requires a desktop to be assigned to every usable GPU. This can cause problems when trying to debug a CUDA-based application locally. If a desktop is running on the same GPU that is running a CUDA-based application that is being debugged, the CUDA Debugger can have problems communicating with the application that is being debugged. The CUDA Debugger disables breakpoints automatically when attempting to debug locally on a GPU that has displays attached.
The following procedure allows you to work around the desktop requirement.
To run headless:
-
Make sure you have at least one CUDA-capable NVIDIA GPU installed.
-
Make sure that the NVIDIA display driver installed on your system matches the display driver recommended in release notes. If you install a new display driver, reboot the Windows operating system.
-
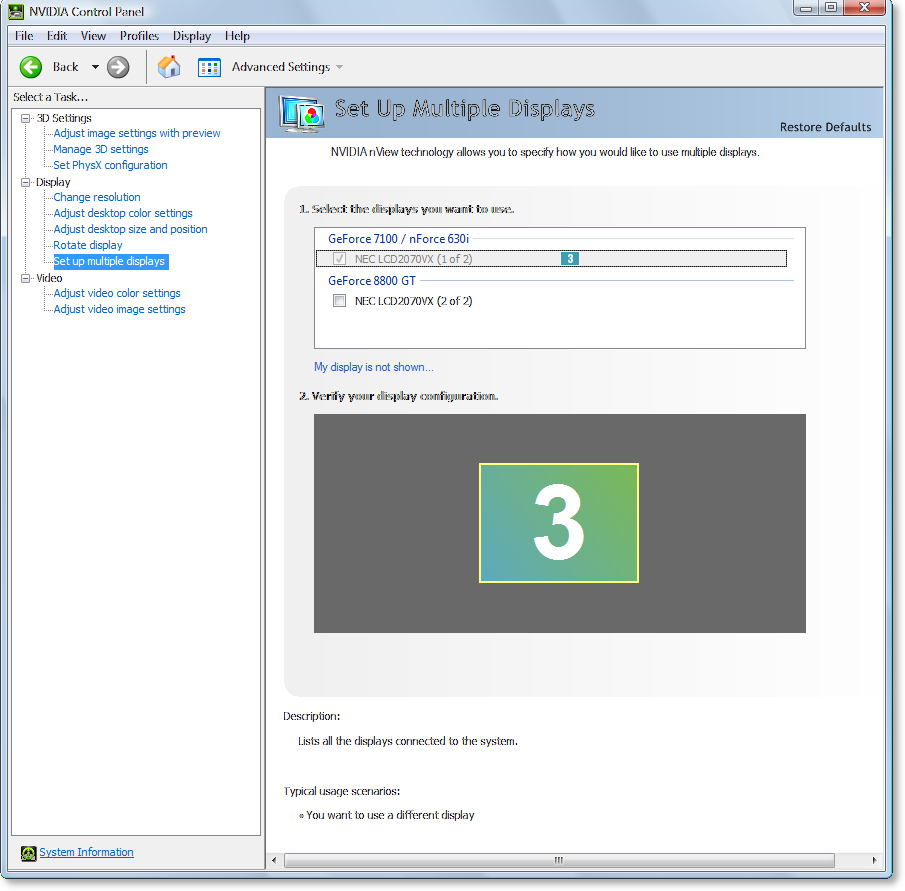
If you have a physical monitor cable attached to each GPU, turn off the display for one of the GPUs from the NVIDIA Control Panel.
-
Right-click on your desktop, and select NVIDIA Control Panel.
-
In the left-hand pane, under Displays, select Setup Multiple Displays.
-
Unmark the checkbox of the display that is to be used as the target (the headless GPU).
-
Click the Apply button.
-
-
Close the NVIDIA Control Panel.
-
Make sure that your CUDA source code specifies the non-desktop device as the device that will execute the CUDA portion of your code.
If you aren't sure which device is the headless GPU, use the DeviceQueryDrv sample from the CUDA SDK Toolkit, then set the CUDA_VISIBLE_DEVICES environment variable.
|
Note: |
For a local debugging configuration, make sure that you first disable D3D acceleration for WPF. For assistance, see Setup Local Debugging. |
6. How To: Install the NVIDIA Display Driver
It is recommended that you install an NVIDIA display driver that NVIDIA Nsight™ VSE 2020.1.1 requires. See the release notes for more information.
If you have an NVIDIA graphics card installed on your target machine, you probably already have an NVIDIA display driver. However, NVIDIA Nsight Visual Studio Edition requires an updated version of the driver in order to function properly. Please see the latest release notes for instructions on compatible driver versions:
7. How To: Configure a Secure Connection
In order for the NVIDIA Nsight™ VSE host software in Visual Studio and the Nsight Monitor on the target machine to communicate with each other, their security settings must match.
To enable a secured connection:
-
On the host machine, open the General page on the NVIDIA Nsight™ VSEOptions window.
-
From the Nsight menu in Visual Studio, select Options.
-
Select the General tab.
-
-
Under Security, choose the drop-down menu next to Enable secure connection and select True.
-
Click OK. The NVIDIA Nsight™ VSE Options window closes.
-
On the target machine (either a remote machine or localhost, depending on your configuration), start the Nsight Monitor, if it is not already running.
-
Click the Windows Start menu.
-
Scroll down the through the installed programs and select: NVIDIA Corporation > Nsight Monitor.
-
-
Right-click on the Nsight Monitor icon in the taskbar.
- Select Options.
The NVIDIA Nsight™ VSE Options window appears.
-
Click on General.
- Select Options.
-
Next to Enable secure connection, select True.
-
Optionally, next to Trusted machines you can list the hostnames of the machines that are always allowed to connect to the Nsight Monitor. You can enter either the DNS lookup name or the IP address (see Recommended IP Address Formatting for more information).
-
Click OK.
-
Exit and restart the Nsight Monitor.
The NVIDIA Nsight™ VSEhost and target are now configured to communicate with each other through a secured connection.
8. Synchronization
When performing remote debugging with NVIDIA Nsight Visual Studio Edition, all of the files that your target application needs at runtime must be copied to the remote machine. The status bar shows you when the debugger is synchronizing files, including how many have been copied out of the total number of files to be copied:
8.1. When Do Files Get Synchronized?
At the start of a remote debugging or analysis session, the files are synchronized. Files are not copied if they are already on the target system and their timestamps match the host system’s project files.
8.2. Which Files Get Synchronized?
The Nsight Monitor copies the files that match the pattern in the Extensions to synchronize field of the User Settings window. The Nsight Monitor looks for files in the following directories:
-
The Output Directory specified in the project's Property Pages.
(Project > Properties > Configuration Properties > General > Output Directory).
-
Directories you specify in the Directories To Synchronize field of the User Settings window.
To specify files and directories to synchronize when remote debugging:
-
From the Solution Explorer window in Visual Studio, select Nsight User Properties. (As an alternative, you can also go to the Project menu > Nsight User Properties.)
-
The NVIDIA Nsight™ VSE User Settings window appears. Click on the Synchronization node.
-
Mark the Synchronize files checkbox.
-
If you want subdirectories to be synchronized, mark the Recurse synchronized folders checkbox.
-
If you want only specific extensions to be copied, specify them in Include extensions.
Separate multiple extensions with a semicolon. Do not use commas or spaces. For example:
MyKillerApp.*;*.dll;*.pdb;*.exe
You can use the question mark and asterisk as wildcards:
* - substitute for multiple characters
? - substitute for a single character
Remember to include the target application (usually *.exe).
-
In the Exclude extensions field, select the file extensions (if any) that you want to exclude from the synchronization process.
-
If there are additional directories that your application needs in order to run on the remote machine, specify them in the Directories to synchronize field.
This is often the case when your application uses runtime libraries from SDKs that are not in the project directory.
If you defined a working directory in the Launch page of the User Settings window, consider adding that directory to the list of Directories to synchronize. If there are runtime files in that working directory, you need to add it to the list.
8.3. Where Does NVIDIA Nsight Visual Studio Edition Put Synchronized Files?
When the Nsight Monitor synchronizes files to a remote machine, it saves them to a specific directory. This directory is the concatenation of two parts:
[SynchronizationDirectory]+[OutputDirectory]
The default for the first part, the Synchronization Directory, is in the following subdirectory of the %AppData% folder:
C:\Users\[current-user-on-target]\AppData\Roaming\NVIDIA Corporation\Nsight\Monitor\Mirror\[hostname]\[host-outdir]
The default for the second part, the Output Directory, is the output directory defined in your project’s Project Properties, including the hostname and drive letter. You can specify additional Directories To Synchronize in the Nsight – User Settings window as explained above.
For example, let’s say that the hostname of your local machine is MyDesktop-01, and that the output directory of your project on your local machine is:
C:\MyKillerApp\Bin
Let’s also assume that you have logged on to the remote machine as jsmith.
When the Nsight Monitor synchronizes files for remote debugging, it creates the following directory (the result of the concatenation of the two paths described above):
The Nsight Monitor copies the files from the local machine to the above directory. In the above example, it would copy the files from the C:\MyKillerApp\Bin directory on the local machine to the remote machine. In addition to those files, the debugger will also copy files from any directories you specified in the Directories To Synchronize field in the Nsight – User Settings window.
8.4. Synchronization Directory
You can override the default Synchronization Directory. For example, instead of the default path in the AppData directory, you could specify the Synchronization Directory to be:
C:\TargetAppRoot
If the hostname of your local machine were MyDesktop-01 and the output directory of your project on your local machine were C:\MyKillerApp\Bin, the Nsight Monitor would copy the files to this directory on the remote machine:
C:\TargetAppRoot\MyDesktop-01\c\MyKillerApp\Bin
To change the Synchronization Directory:
-
Right click on the Nsight Monitor icon in the taskbar.
-
Select Options. The NVIDIA Nsight™ VSE Options window opens.
-
In the left-hand pane, select General.
-
In the right-hand pane, next to Synchronization Directory, type the name of the directory you want to use as the root Synchronization Directory.
For example, you could specify C:\MySyncRoot.
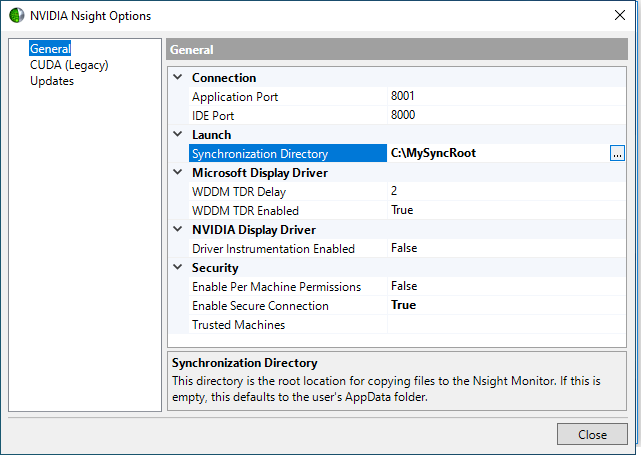
- Click OK.
The Nsight Monitor uses the directory you specified as the root directory for file synchronization the next time you perform remote debugging with this project. If this directory does not exist on the remote machine, the Nsight Monitor creates the directory.
9. Working with Samples
There is one primary source for samples that you can use with the NVIDIA Nsight Visual Studio Edition tools:
10. Using Visual Studio 2019
We've Moved!
The first thing you’ll notice is that Microsoft is now restricting where extensions, like NVIDIA Nsight Visual Studio Edition, can be placed in the Visual Studio menu layout.
Visual Studio 2017 and earlier
In previous Visual Studio versions, Nsight was a top-level menu item.

Starting with Visual Studio 2019
Starting in Visual Studio 2019, Nsight can be found under Extensions with all other extensions.
|
Note: |
In Visual Studio 2019
Update 4 and later, you can choose to move the
Nsight menu to the Visual Studio main menu by
using the Visual Studio main menu > Tools > Customize, then
unchecking the following (assuming both are
installed):
After restarting Visual Studio, Nsight will no longer be included under the Extension menu. Instead, the Nsight menu will appear on the Visual Studio main menu. NOTE: This must be done for each extension after integration of the extension. By default, the installer places the extension under the Extensions menu.
|
Creating a New Project
Another Visual Studio 2019 difference is how new projects are created. In previous versions, you could select NVIDIA and then specify the desired CUDA version.
Visual Studio 2017 and earlier
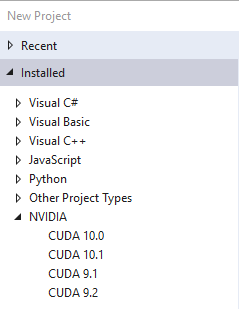
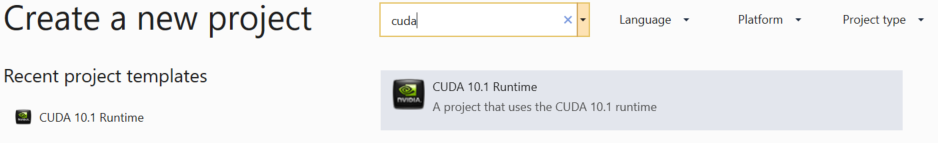
In the initial release of Visual Studio 2019, extensions (like NVIDIA Nsight Visual Studio Edition) cannot add project types. So you won’t find NVIDIA or CUDA in the Project Type menu. This is expected to change in Visual Studio 2019 Update1 and an upcoming CUDA Toolkit release.
For now, we recommend finding CUDA project types by typing CUDA in the search filter.
Starting with Visual Studio 2019
Notices
Notice
NVIDIA® Nsight™ Application Development Environment for Heterogeneous Platforms, Visual Studio Edition 2022.2.1 User GuideSend Feedback
THE INFORMATION IN THIS GUIDE AND ALL OTHER INFORMATION CONTAINED IN NVIDIA DOCUMENTATION REFERENCED IN THIS GUIDE IS PROVIDED “AS IS.” NVIDIA MAKES NO WARRANTIES, EXPRESSED, IMPLIED, STATUTORY, OR OTHERWISE WITH RESPECT TO THE INFORMATION FOR THE PRODUCT, AND EXPRESSLY DISCLAIMS ALL IMPLIED WARRANTIES OF NONINFRINGEMENT, MERCHANTABILITY, AND FITNESS FOR A PARTICULAR PURPOSE. Notwithstanding any damages that customer might incur for any reason whatsoever, NVIDIA’s aggregate and cumulative liability towards customer for the product described in this guide shall be limited in accordance with the NVIDIA terms and conditions of sale for the product.
THE NVIDIA PRODUCT DESCRIBED IN THIS GUIDE IS NOT FAULT TOLERANT AND IS NOT DESIGNED, MANUFACTURED OR INTENDED FOR USE IN CONNECTION WITH THE DESIGN, CONSTRUCTION, MAINTENANCE, AND/OR OPERATION OF ANY SYSTEM WHERE THE USE OR A FAILURE OF SUCH SYSTEM COULD RESULT IN A SITUATION THAT THREATENS THE SAFETY OF HUMAN LIFE OR SEVERE PHYSICAL HARM OR PROPERTY DAMAGE (INCLUDING, FOR EXAMPLE, USE IN CONNECTION WITH ANY NUCLEAR, AVIONICS, LIFE SUPPORT OR OTHER LIFE CRITICAL APPLICATION). NVIDIA EXPRESSLY DISCLAIMS ANY EXPRESS OR IMPLIED WARRANTY OF FITNESS FOR SUCH HIGH RISK USES. NVIDIA SHALL NOT BE LIABLE TO CUSTOMER OR ANY THIRD PARTY, IN WHOLE OR IN PART, FOR ANY CLAIMS OR DAMAGES ARISING FROM SUCH HIGH RISK USES.
NVIDIA makes no representation or warranty that the product described in this guide will be suitable for any specified use without further testing or modification. Testing of all parameters of each product is not necessarily performed by NVIDIA. It is customer’s sole responsibility to ensure the product is suitable and fit for the application planned by customer and to do the necessary testing for the application in order to avoid a default of the application or the product. Weaknesses in customer’s product designs may affect the quality and reliability of the NVIDIA product and may result in additional or different conditions and/or requirements beyond those contained in this guide. NVIDIA does not accept any liability related to any default, damage, costs or problem which may be based on or attributable to: (i) the use of the NVIDIA product in any manner that is contrary to this guide, or (ii) customer product designs.
Other than the right for customer to use the information in this guide with the product, no other license, either expressed or implied, is hereby granted by NVIDIA under this guide. Reproduction of information in this guide is permissible only if reproduction is approved by NVIDIA in writing, is reproduced without alteration, and is accompanied by all associated conditions, limitations, and notices.
Trademarks
NVIDIA, the NVIDIA logo, and cuBLAS, CUDA, CUDA-GDB, CUDA-MEMCHECK, cuDNN, cuFFT, cuSPARSE, DIGITS, DGX, DGX-1, DGX Station, NVIDIA DRIVE, NVIDIA DRIVE AGX, NVIDIA DRIVE Software, NVIDIA DRIVE OS, NVIDIA Developer Zone (aka "DevZone"), GRID, Jetson, NVIDIA Jetson Nano, NVIDIA Jetson AGX Xavier, NVIDIA Jetson TX2, NVIDIA Jetson TX2i, NVIDIA Jetson TX1, NVIDIA Jetson TK1, Kepler, NGX, NVIDIA GPU Cloud, Maxwell, Multimedia API, NCCL, NVIDIA Nsight Compute, NVIDIA Nsight Eclipse Edition, NVIDIA Nsight Graphics, NVIDIA Nsight Integration, NVIDIA Nsight Systems, NVIDIA Nsight Visual Studio Edition, NVLink, nvprof, Pascal, NVIDIA SDK Manager, Tegra, TensorRT, Tesla, Visual Profiler, VisionWorks and Volta are trademarks and/or registered trademarks of NVIDIA Corporation in the United States and other countries. Other company and product names may be trademarks of the respective companies with which they are associated.