1. Reference Topics
This section provides additional information and resources for the NVIDIA Nsight Visual Studio Edition User Guide.
2. Debugging External Applications
Early versions of NVIDIA Nsight™ VSE were only able to debug projects built in Visual C++. However, as of NVIDIA Nsight™ VSE 3.1, CUDA debugging is supported for both C++ and C# projects.
If you would like to use NVIDIA Nsight™ VSE to debug an application that is built in an environment other than C++ or C#, use the tutorial outlined below.
Using NVIDIA Nsight™ VSE Debugging with Other Project Types
-
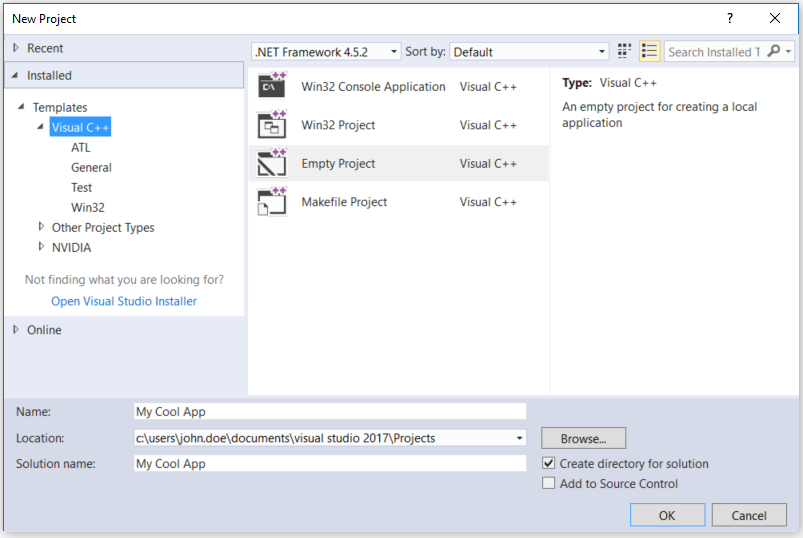
In Visual Studio, create a "dummy" project by going to File > New > Project.
Note:
For Visual Studio 2019, the new project setup process is slightly different. Please see Using Visual Studio 2019.
-
On the node for Visual C++ templates, select Empty Project.
Enter the name for your project and click OK.
-
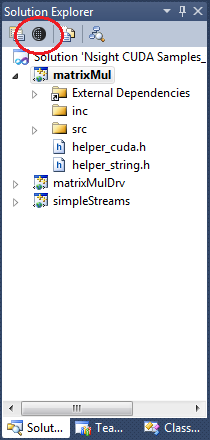
Select the project's Nsight User Properties to edit the default settings.
As an alternative, you can also go to the Project menu > Nsight User Properties.
-
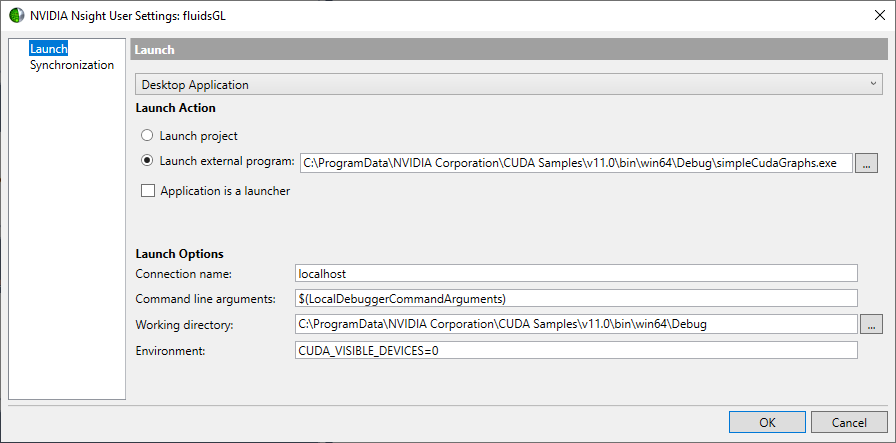
Select Launch external program, and enter the path to the external program for the application that is to be debugged.
-
Configure any other launch options or file synchronization settings which may be necessary for your particular debugging environment.
(For assistance, refer to Host Basics and Synchronization.)
-
Click OK to save your settings.
-
You can now begin debugging your application with NVIDIA Nsight™ VSE.
To do so, go to the Nsight menu or right-click on your project, then select the appropriate activity [Start CUDA Debugging (Legacy/Next-Gen), Start Graphics Debugging, etc.].
3. Timeout Detection & Recovery (TDR)
TDR stands for Timeout Detection and Recovery. This is a feature of the Windows operating system which detects response problems from a graphics card, and recovers to a functional desktop by resetting the card. If the operating system does not receive a response from a graphics card within a certain amount of time (default is 2 seconds), the operating system resets the graphics card.
Before TDR existed, problems of this nature would have resulted in a system freeze and required a reboot of the operating system. If TDR is enabled and you see the TDR error message, "Display driver stopped responding and has recovered," this means that the Windows operating system reset the display driver.
There are three different possible debugging configurations:
-
Local debugging with a single GPU,
-
Local debugging with multiple GPUs, or
-
Remote debugging.
Choose the one that most closely reflects your NVIDIA Nsight™ VSE setup:
3.1. Local Debugging with a Single GPU
Disabling TDR removes a valuable layer of protection, so it is generally recommended that you keep it enabled.
However, setting the TDR delay too low can cause the debugger to fail for one of two reasons:
-
Debugging on some GPUs will fails with a TDR delay of less than 10 seconds.
-
Debug builds of CUDA kernels run more slowly and may intrinsically require additional time to complete. With too low of a TDR delay, the kernels may not have enough time to complete.
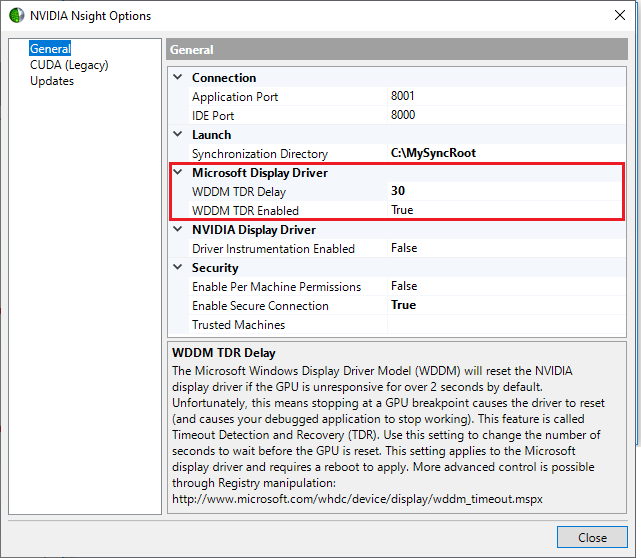
Therefore, if you are using local debugging with a single GPU, it's recommended that you leave TDR enabled, and set the delay to 10 seconds.
To enable TDR and change the delay, do the following:
-
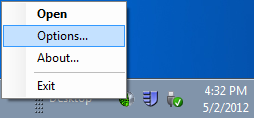
Right-click the Nsight Monitor icon in the system tray.
-
Select Options.
-
In the Options window on the General tab, set WDDM TDR enabled to True.
-
Change the WDDM TDR Delay from the default setting to 10.
3.2. Local Debugging with Multiple GPUs or Remote Debugging
When using either a local debugging configuration with multiple GPUs, or a remote debugging configuration, it's important to disable TDR. This is because with most CUDA applications, a TDR means that any debugging operation after the TDR will fail. You will not be able to step, set breakpoints, view variables, etc. The application will receive a grid launch failure, and the CUcontext will begin to report errors.
Having TDR enabled can interfere with GPU debugging because the graphics card is perceived by the operating system as unresponsive when the execution of a target application is paused or when the debugger is performing certain operations.
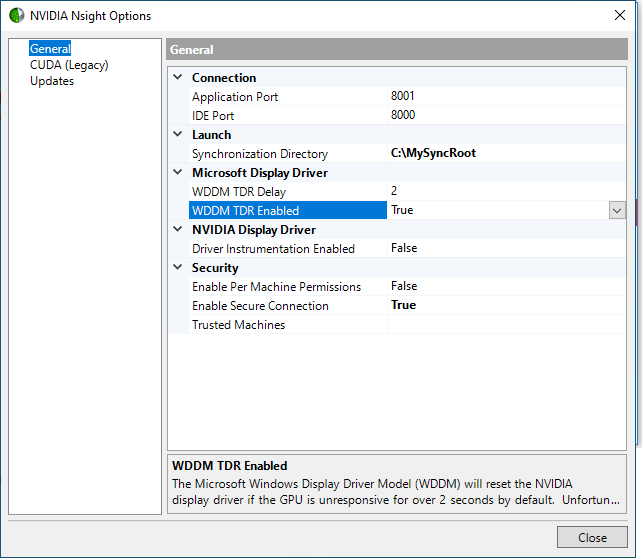
To disable TDR, do the following:
-
Right-click the Nsight Monitor icon in the system tray.
-
Select Options.
-
In the Options window on the General tab, set WDDM TDR enabled to False.
For more information about TDR, see:
http://www.microsoft.com/whdc/device/display/wddm_timeout.mspx
4. Tesla Compute Cluster (TCC)
For most GPUs, you do not have to do anything specific in NVIDIA Nsight™ VSE to enable debugging on a Tesla Compute Cluster (TCC) device. You don't have to modify your Visual Studio project or enable any specific setting. The TCC device simply shows up as a standard CUDA device. For some GPUs, the default mode is not TCC. See below for more information.
|
Note: |
Do not kill a process that is executing code on a TCC device and paused on a breakpoint, except through the normal Stop Debugging command (SHIFT+F5) in Visual Studio. Abnormal termination of a target application that is paused during a debugging session on a TCC device results in unpredictable behavior. It causes future calls to cuCtxInit() to hang indefinitely, even though the killed process seems to terminate normally. The only way to recover is to reboot the target machine. See the latest release notes to learn about any changes in this behavior. |
4.1. Limitations
There are 2 main limitations you will encounter when debugging code running on a TCC device:
-
There is no Vulkan, OpenGL, or Direct3D interop support.
-
You cannot have a display connected to an adapter when the underlying device is running in TCC mode. Physically connecting a display causes unpredictable behavior. Windows detects the TCC adapter as a "Standard VGA" device (which it is not), connected to the existing NVIDIA device. The unpredictable behavior results in having to reboot the entire system.
4.2. Setting TCC Mode for Tesla Products
NVIDIA GPUs can exist in one of two modes: TCC or WDDM. TCC mode disables Windows graphics and is used in headless configurations, whereas WDDM mode is required for Windows graphics. NVIDIA GPUs also come in three classes:
-
GeForce — typically defaults to WDDM mode; used in gaming graphics.
-
Quadro — typically defaults to WDDM mode, but often used as TCC compute devices as well.
-
Tesla — typically defaults to TCC mode. Current drivers require a GRID license to enable WDDM on Tesla devices.
NVIDIA Nsight™ VSE Compute debugging does not require a specific driver mode.
The NVIDIA Control Panel will show you what mode your GPUs are in; alternately, you can use the nvidia-smi command to generate a table that will display your GPUs and what mode they are using.
To change the TCC mode, use the NVIDIA SMI utility. This is located by default at C:\Program Files\NVIDIA Corporation\NVSMI. Use the following syntax to change the TCC mode:
nvidia-smi -g {GPU_ID} -dm {0|1}0 = WDDM
1 = TCC
|
Note: |
NVIDIA Nsight Visual Studio Edition supports CUDA debugging in TCC mode:
|
4.3. About TCC
The TCC (Tesla Compute Cluster) driver is a Windows driver that supports CUDA C/C++ applications. The driver enables remote desktop services, and reduces the CUDA kernel launch overhead on Windows. Note that the TCC driver disables graphics on the Tesla products.
The main purpose of TCC and the Tesla products is to aid applications that use CUDA to perform simulations, and large scale calculations (especially floating-point calculations), such as image generation for professional use and scientific fields of study.
The benefits of using the Tesla Compute Cluster driver package:
-
TCC drivers make it possible to use NVIDIA GPUs in nodes with non‐NVIDIA integrated graphics.
-
NVIDIA GPUs on systems running the TCC drivers will be available via Remote Desktop, both directly and via cluster management systems that rely on Remote Desktop.
-
NVIDIA GPUs will be available to applications running as a Windows service (in Session 0) on systems running the TCC drivers.
The TCC driver was specifically designed to be used with Microsoft's Windows HPC Server 2008. However, NVIDIA's TCC driver can be used with operating systems other than Windows HPC Server 2008. The NVIDIA TCC driver does not have the same pinned allocation limits or memory fragmentation behavior as WDDM. You can mix TCC drivers with XP-style display drivers.
For more information about supported operating systems, and compatibility with other NVIDIA drivers, refer to the documentation on NVIDIA Tesla:
http://www.nvidia.com/object/tesla_computing_solutions.html
For more information about NVIDIA hardware compatibility on Windows HPC Server 2008, see:
http://technet.microsoft.com/en-us/library/ff793340_ws.10_.aspx
To search the NVIDIA web site for Tesla drivers, see:
5. Environment Variables
NVIDIA Nsight™ VSE creates certain system environment variables that are useful when defining build properties. These are separate from the build macros defined by Visual Studio.
For more information about the list of macros available for build commands such as $(OutDir) and $(TargetName), see the MSDN article on Macros for Build Commands and Properties.
To see the environment variables related to CUDA paths:
-
Open the Advanced System Settings panel in the Control Panel.
-
Start > Control Panel.
-
Select System and Maintenance.
-
Select System.
-
In the left-hand pane, select Advanced system settings.
The System Properties window opens.
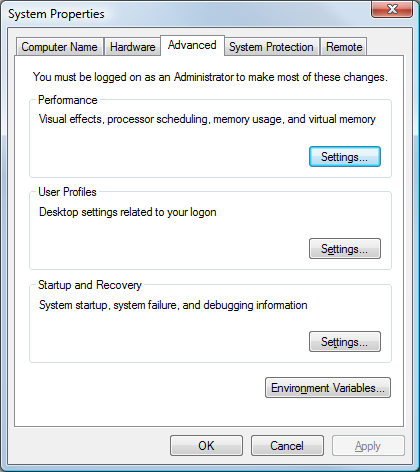
-
-
Click the Environment Variables button.
-
Under System Variables, scroll to see the variables that have CUDA in the name.
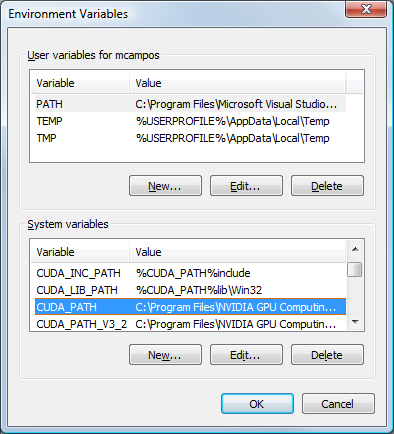
-
Click OK to close the window.
The Environment Variables window lists the system environment variables that begin with CUDA. These are variables that you can use in the project Property Pages to control various aspects of the build process.
6. DirectCompute
Microsoft DirectCompute is an application programming interface (API) that supports general-purpose computing on graphics processing units on Microsoft Windows 7 and Windows 8.
NVIDIA's Direct3D 11 GPUs support DirectCompute. This allows developers to harness the massive parallel computing power of NVIDIA GPUs to create compelling computing applications in consumer and professional markets.
See Also
Reference
7. Troubleshooting NVIDIA Nsight Visual Studio Edition
Problem:
When I convert a project to a newer version of Visual Studio, I get build errors.
Resolution:
For more information on how to convert a project, see the NVIDIA Developer Forums.
Problem:
How do I get a diagnostic log(s) of the NVIDIA Nsight™ VSE host and monitor for troubleshooting purposes?
Resolution:
-
Close both Visual Studio and the Nsight Monitor.
-
On both the host and target machines, go to the following locations, and delete any existing files:
%AppData%\NVIDIA Corporation\Nsight\Vsip\1.0\Logs
%AppData%\NVIDIA Corporation\Nsight\Monitor\1.0\Logs
-
Edit Nvda.Diagnostics.nlog as follows.
-
On the host machine:
C:\Program Files (x86)\NVIDIA Corporation\Nsight Visual Studio Edition 2023.1\Host\Common\Configurations -
On the target machine:
C:\Program Files (x86)\NVIDIA Corporation\Nsight Visual Studio Edition 2023.1\Monitor\Common\Configurations
-
-
Go to the last logger at the bottom of the file:
<logger name="*" minlevel="Error" writeTo="file-high-severity" />.
-
Change the minlevel attribute value from "Error" to "Trace".
-
Save the file.
-
Reproduce the problem, and send the following generated logs:
%AppData%\NVIDIA Corporation\Nsight\Vsip\1.0\Logs
%AppData%\NVIDIA  Corporation\Nsight\Monitor\1.0\Logs
Problem:
When breakpoints are set in source code, the CUDA Debugger pauses execution at locations unrelated to the breakpoints.
This can happen when more than one __global__ function (kernel) makes a call to a __device__ function within a single module, and both of the following are true:
-
the __device__ function is not inlined.
-
the different kernels call the exact same __device__ function.
Resolution:
There are a couple of approaches you can take to work around this issue:
-
Force the __device__ function to be inlined by applying the __forceinline__ keyword to the __device__ function. Note that using the inline keyword does not force inlining in debug builds.
-
Reorganize source code so that there is only one __global__ function for each instance of the __device__ function. This means that each .cu file that is compiled with the NVIDIA CUDA Compiler (nvcc.exe) should contain no more than one __global__ function. This works for both Driver API and CUDART applications. Be aware that there are other potential issues with this approach:
-
Recommended: move commonly used __device__ functions to common header files. Use the #include statement to include the __device__ function in each .cu file containing a __global__ function.
-
Potential issue: If your source code contains declarations of a global variable in the following style:
__device__ int x;
and that variable is used by multiple __global__ functions, then using multiple files to make multiple calls to the __global__ function is not a trivial work-around. In this case, we recommend eliminating global variables that are declared in that style from the source code, and making them kernel parameters instead.
-
Potential issue: Each __constant__ variable is associated with one CUDA module (a compiled .cu file).
If your source code is written in a way that multiple kernels depend on the same __constant__ variable, and the host code side of your application dynamically updates that variable, then you will need some broader changes to your source code:
-
For a CUDART application, when copying the __constant__ variable into each .cu file, give each variable a different name.
-
Any host code that was updating the previously single instance of the variable must now update all the instances.
-
-
Problem:
I get warnings that 64-bit injection and/or 32-bit injection is not present.
Resolution:
The Nsight Monitor checks for 64-bit versions of the CUDA injection. This means that you can get warnings if 64-bit and/or 32-bit injection is not present. If this happens, re-install the tools.
Problem:
My machine hangs when I use the CUDA Debugger locally on a single machine with 2 GPUs on it.
Resolution:
There are several possible issues that can cause a machine to hang when locally debugging on two GPUs with the NVIDIA Nsight™ VSE tools.
-
Make sure that your TDR settings have been configured correctly. For more information, see Timeout Detection and Recovery.
We recommend not having a display attached or a desktop running on the GPU on which you are debugging CUDA code, as having concurrent activities on a GPU can cause machine hangs. See How To: Setup Local Headless GPU Debugging for more information.
Problem:
The GPU debugger hangs when I also use the CPU debugger.
Resolution:
Never use the same Visual Studio instance to run both the CUDA Debugger and the CPU debugger.
In general, make sure you only use either CUDA Debugger or CPU debugger, not both. Attaching the CPU debugger and hitting a CPU breakpoint during a CUDA debugging session will cause the CUDA Debugger to hang (until you resume the CPU process).
If you are careful, you can attach two separate Visual Studio instances (one CUDA, one CPU). While you are stopped in CPU code, the CUDA Debugger will hang. Once you resume the CPU code, CUDA Debugger will come back alive.
Problem:
I am unable to set and hit a breakpoint in my CUDA code.
Resolution:
Make sure to use the driver version specified in the release notes. This is the most common reason that breakpoints do not work. The driver must be installed on the machine where your application code runs.
Also, make sure your project uses a compatible CUDA toolkit. A compatible version of the CUDA toolkit generates symbolics information that allows the CUDA Debugger to properly debug your code when you use the -G0 flag on the nvcc command line. If you are using the CUDA Driver API, make sure that there are .cubin.elf.o files alongside each of your compiled .cubin files in the build output directory for your project. Projects using the CUDA Runtime API have the symbolics information embedded in the object file itself.
Problem:
I get the following error message:
Local debugging failed. Nsight is incompatible with WPF acceleration.Please see documentation about WPF acceleration. Run theDisableWpfHardwareAcceleration.reg in your Nsight installation.
Resolution:
Disable WPF D3D acceleration. For more information, see Setup Local Debugging.
If one or more applications are running with WPF hardware acceleration and you run the .reg file, you could still have issues until those applications are restarted. If you are performing local debugging, this includes the Nsight Monitor - you need to restart it seeing as it too is a WPF application.
Problem:
My program ignores breakpoints set in CPU code when I debug a program by choosing Start CUDA Debugging from the Nsight menu.
Resolution:
The CUDA Debugger ignores breakpoints set in CPU code as it does not currently support debugging x86 or other CPU code.
Problem:
When I hit a CUDA breakpoint, I only break once on thread (0, 0, 0) in my CUDA kernel. If I hit Continue (F5), it never breaks again and the entire launch completes.
Resolution:
The default behavior of the CUDA Debugger is to break unconditionally on the first thread of a kernel. After that, the breakpoints have an implicit conditional based on the CUDA Focus Picker. If you would like to break on a different thread, use the CUDA Focus Picker to switch focus to the desired thread or set a conditional breakpoint so that the debugger stops only on the thread you specify. For more information on setting the conditional breakpoint, see How To: Specify Debugger Context and How To: Set GPU Breakpoints. After you switch focus, the CUDA Debugger maintains the focus and breaks on breakpoints only in that thread for the duration of the kernel launch.
Problem:
I encounter an error when trying to copy and paste my shader code.
Resolution:
This can happen in Visual Studio 2012, when the Productivity Power Tools extension is being used. Disable the HTML Copy option, and you should be able to copy and paste normally in the shader editor.
Notices
Notice
NVIDIA® Nsight™ Application Development Environment for Heterogeneous Platforms, Visual Studio Edition 2023.1.1 User GuideSend Feedback
THE INFORMATION IN THIS GUIDE AND ALL OTHER INFORMATION CONTAINED IN NVIDIA DOCUMENTATION REFERENCED IN THIS GUIDE IS PROVIDED “AS IS.” NVIDIA MAKES NO WARRANTIES, EXPRESSED, IMPLIED, STATUTORY, OR OTHERWISE WITH RESPECT TO THE INFORMATION FOR THE PRODUCT, AND EXPRESSLY DISCLAIMS ALL IMPLIED WARRANTIES OF NONINFRINGEMENT, MERCHANTABILITY, AND FITNESS FOR A PARTICULAR PURPOSE. Notwithstanding any damages that customer might incur for any reason whatsoever, NVIDIA’s aggregate and cumulative liability towards customer for the product described in this guide shall be limited in accordance with the NVIDIA terms and conditions of sale for the product.
THE NVIDIA PRODUCT DESCRIBED IN THIS GUIDE IS NOT FAULT TOLERANT AND IS NOT DESIGNED, MANUFACTURED OR INTENDED FOR USE IN CONNECTION WITH THE DESIGN, CONSTRUCTION, MAINTENANCE, AND/OR OPERATION OF ANY SYSTEM WHERE THE USE OR A FAILURE OF SUCH SYSTEM COULD RESULT IN A SITUATION THAT THREATENS THE SAFETY OF HUMAN LIFE OR SEVERE PHYSICAL HARM OR PROPERTY DAMAGE (INCLUDING, FOR EXAMPLE, USE IN CONNECTION WITH ANY NUCLEAR, AVIONICS, LIFE SUPPORT OR OTHER LIFE CRITICAL APPLICATION). NVIDIA EXPRESSLY DISCLAIMS ANY EXPRESS OR IMPLIED WARRANTY OF FITNESS FOR SUCH HIGH RISK USES. NVIDIA SHALL NOT BE LIABLE TO CUSTOMER OR ANY THIRD PARTY, IN WHOLE OR IN PART, FOR ANY CLAIMS OR DAMAGES ARISING FROM SUCH HIGH RISK USES.
NVIDIA makes no representation or warranty that the product described in this guide will be suitable for any specified use without further testing or modification. Testing of all parameters of each product is not necessarily performed by NVIDIA. It is customer’s sole responsibility to ensure the product is suitable and fit for the application planned by customer and to do the necessary testing for the application in order to avoid a default of the application or the product. Weaknesses in customer’s product designs may affect the quality and reliability of the NVIDIA product and may result in additional or different conditions and/or requirements beyond those contained in this guide. NVIDIA does not accept any liability related to any default, damage, costs or problem which may be based on or attributable to: (i) the use of the NVIDIA product in any manner that is contrary to this guide, or (ii) customer product designs.
Other than the right for customer to use the information in this guide with the product, no other license, either expressed or implied, is hereby granted by NVIDIA under this guide. Reproduction of information in this guide is permissible only if reproduction is approved by NVIDIA in writing, is reproduced without alteration, and is accompanied by all associated conditions, limitations, and notices.
Trademarks
NVIDIA, the NVIDIA logo, and cuBLAS, CUDA, CUDA-GDB, CUDA-MEMCHECK, cuDNN, cuFFT, cuSPARSE, DIGITS, DGX, DGX-1, DGX Station, NVIDIA DRIVE, NVIDIA DRIVE AGX, NVIDIA DRIVE Software, NVIDIA DRIVE OS, NVIDIA Developer Zone (aka "DevZone"), GRID, Jetson, NVIDIA Jetson Nano, NVIDIA Jetson AGX Xavier, NVIDIA Jetson TX2, NVIDIA Jetson TX2i, NVIDIA Jetson TX1, NVIDIA Jetson TK1, Kepler, NGX, NVIDIA GPU Cloud, Maxwell, Multimedia API, NCCL, NVIDIA Nsight Compute, NVIDIA Nsight Eclipse Edition, NVIDIA Nsight Graphics, NVIDIA Nsight Integration, NVIDIA Nsight Systems, NVIDIA Nsight Visual Studio Edition, NVLink, nvprof, Pascal, NVIDIA SDK Manager, Tegra, TensorRT, Tesla, Visual Profiler, VisionWorks and Volta are trademarks and/or registered trademarks of NVIDIA Corporation in the United States and other countries. Other company and product names may be trademarks of the respective companies with which they are associated.