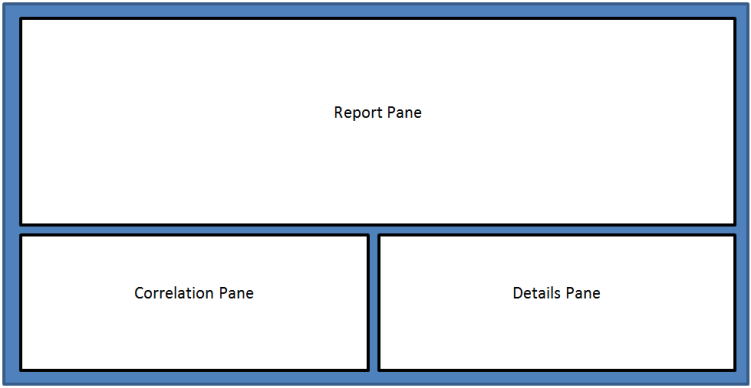
Figure 1: Report Page Layout
NVIDIA® Nsight™ Development Platform, Visual Studio Edition 4.6 User Guide
Send Feedback
NVIDIA Nsight has introduced the concept of data correlation within the Analysis Report pages. This document outlines the basic functionality of this correlation system.
Report pages that contain correlation data will be divided into the sections shown in Figure 1.
Figure 1: Report Page Layout
As shown above, each report page will contain a main report pane, a correlation pane and an object details pane. More detail on each pane is provided below.

|
Note that if a report page has no correlation data (like the GPU Devices page), then the lower two panes will not be visible. |
The panes can be resized by dragging the partitions between them. The pane sizes are shared between all pages within a report. In this way, as the user navigates between pages the layout will be the same.
An example of an actual report page with this layout can be seen in Figure 2.
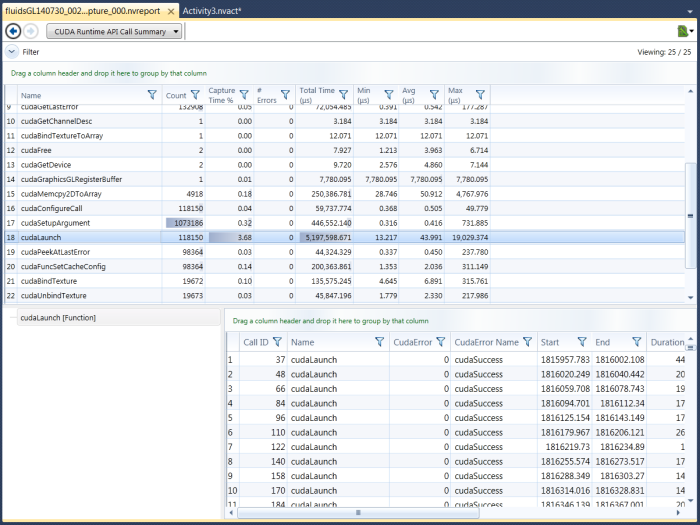
Figure 2: Report Page with Correlation Data
The Report Pane contains the summary content, grids and timelines as were previously presented on each report page. This pane is the largest in the layout as it contains the most information and should be the focus of the page.
Historically, all grid-based pages as well as the timeline have supported the concept of a selected item. This selected item is now more important as it drives the context of the Correlation Pane.
On Grid-based reports we currently support one selected item – the selected row. However, on the timeline page, we support selection on two different axes – the selected row and the selected data points under the cursor on this row. In either case, the selected items determine what information is displayed in the Correlation Pane.
As mentioned above, the Correlation Pane displays information relevant to the selected item(s) in the Report Pane. The data is displayed in hierarchical fashion with the selected item(s) on top of the hierarchy.
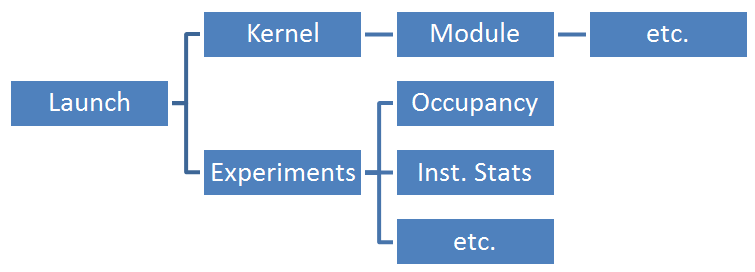
The children of the root node will represent things of interest relative to the root, and not necessarily physical children. For example, a hierarchy for a selected CUDA Launch object may contain something like the following:
As seen above, the items in the hierarchy may represent a single object, or they may represent a list of objects (the Experiments node). For items representing lists, each item of the list is a child of the list node.
The content of the correlation hierarchy is generated dynamically based on attributes of the selected object in the report pane. As such, the contents of the correlation hierarchy is dependent on what type of object is selected in the report as well as what information is available.
The tree control used to render the correlation information supports the selection of a single item. This selected item determines the content of the Details Pane.
As mentioned above, the Details Pane displays information relevant to the selected item in the Correlation Pane. The information presented may simply be a list of properties of interest, like start time, end time, duration etc. However, depending on the object selected, the details pane may present more in-depth information such as graphs, charts and tables used to describe experiment results, or lists of related information.
So, putting it all together:
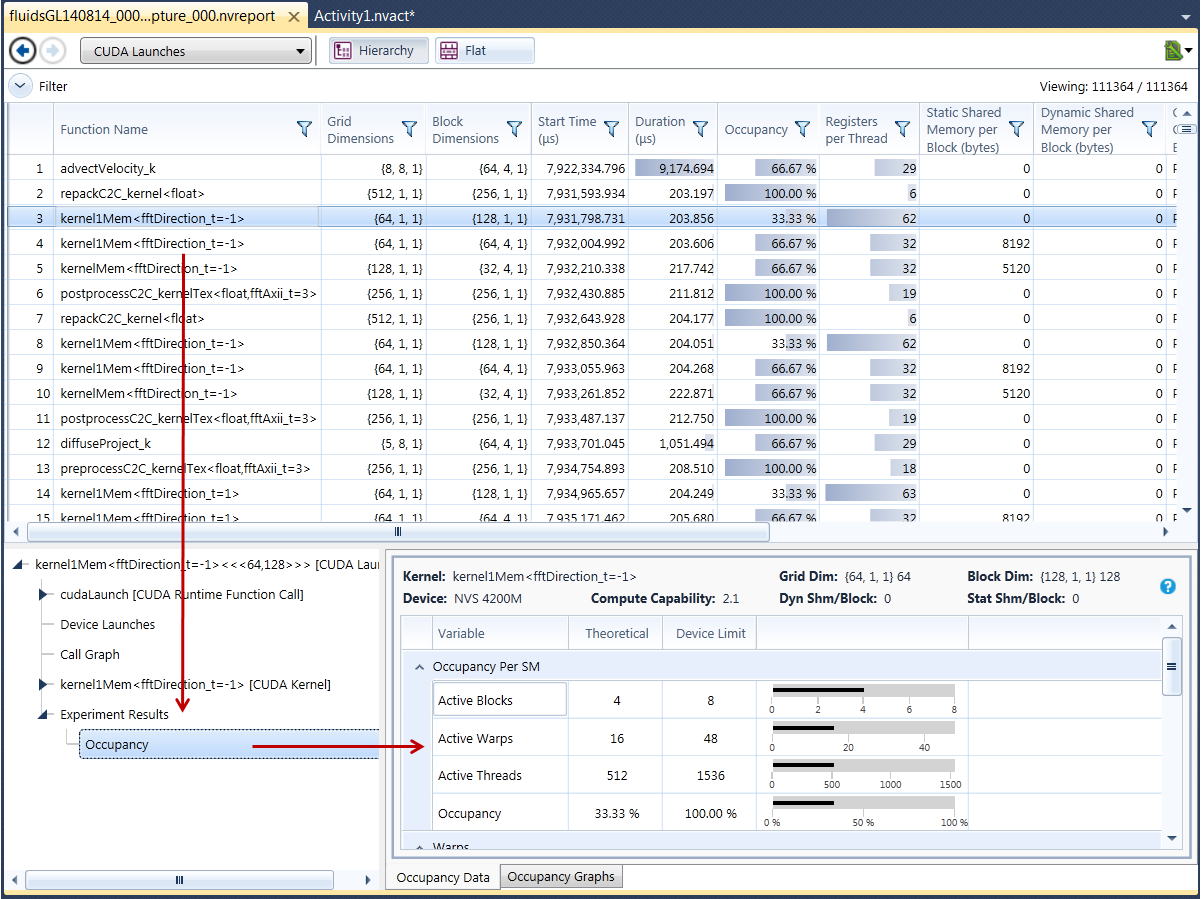
This interaction is shown in Figure 3.
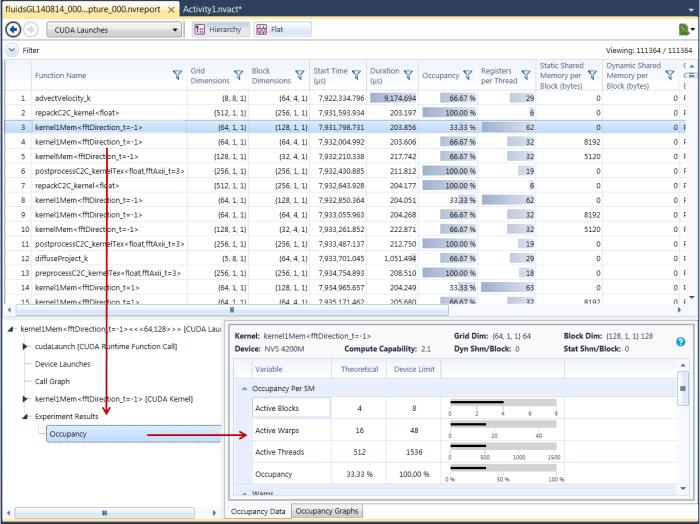
Figure 3: Correlation Data Interaction
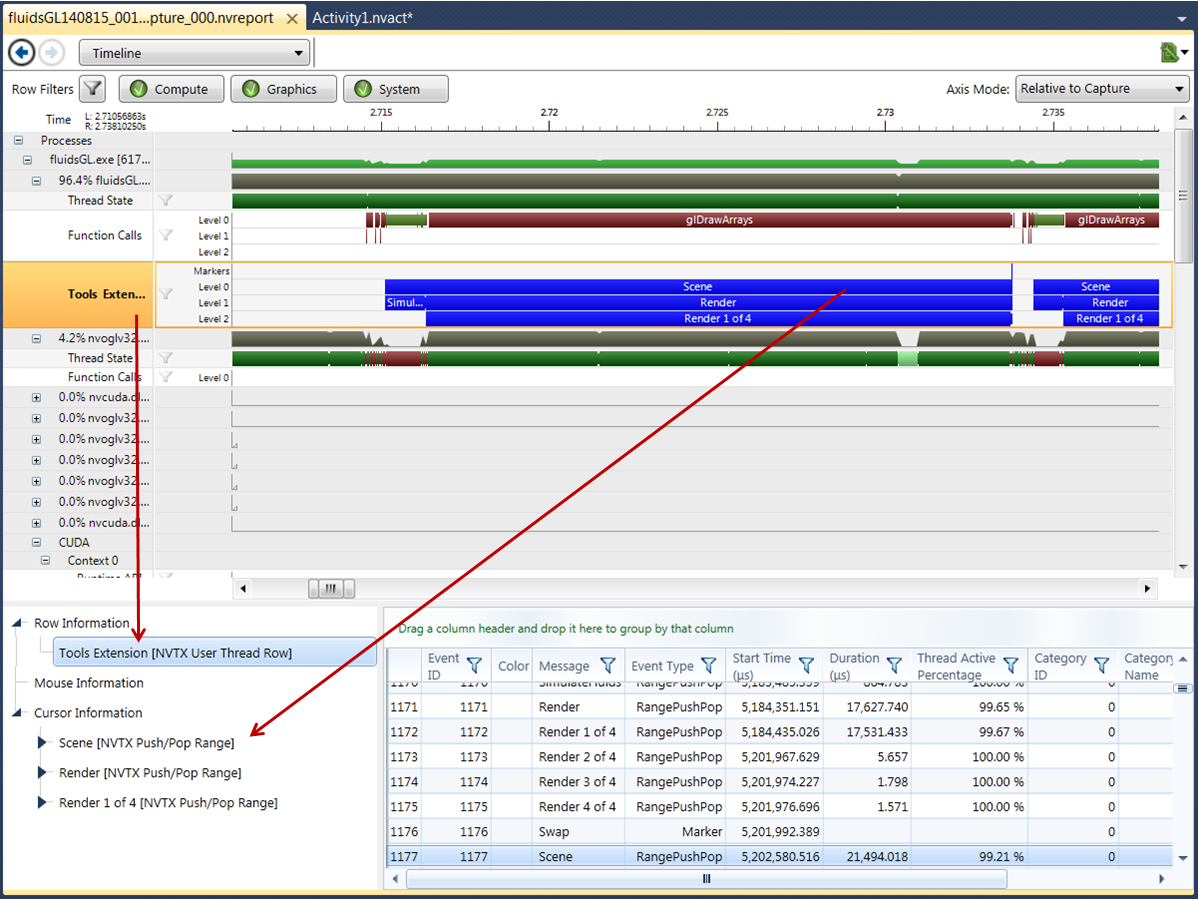
As mentioned above, the Correlation Pane is populated with data from two different "axes" when the timeline is visible – Row information, and Cursor Information. This results in a correlation pane with multiple root nodes as shown in Figure 4.

Figure 4: Correlation Data for the Timeline
In this example, note the following:
In this use-case, the selected items in the details pane will get updated as the cursor moves along the row. Similarly, if the user clicks on a row in the Details Pane, the cursor location will be moved to the location of the selected data point. This two-way interactivity of the correlation data can be very helpful in allowing the user to explore the captured data.
NVIDIA® Nsight™ Development Platform, Visual Studio Edition User Guide Rev. 4.6.150311 ©2009-2015. NVIDIA Corporation. All Rights Reserved.