NVIDIA® Nsight™ Development Platform, Visual Studio Edition 4.6 User Guide
Send Feedback
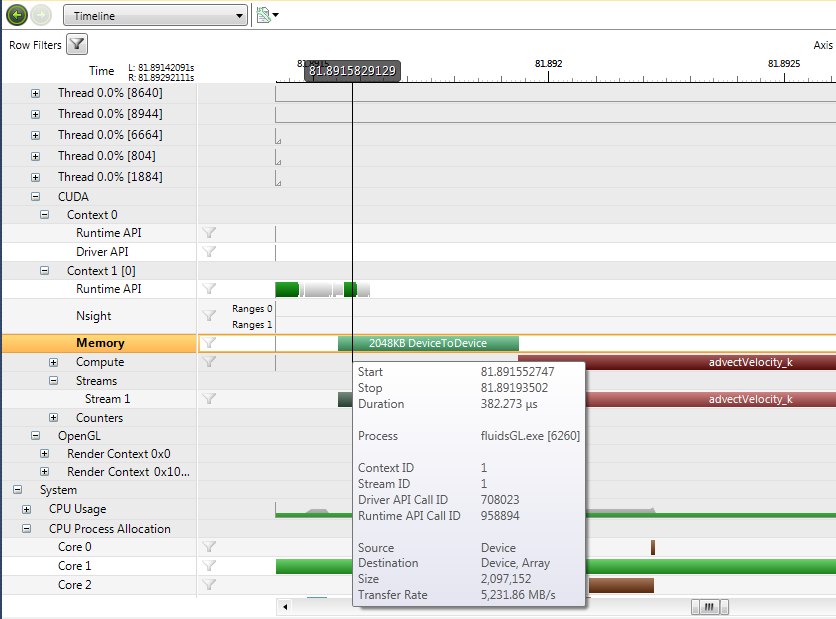
The Timeline page shows domain-specific events (CUDA events, DirectX events, OpenCL events) and system events visually along a timeline that corresponds to the duration of an analysis session (capture). The Timeline page can be broken down into several key elements, detailed below:
 Filters
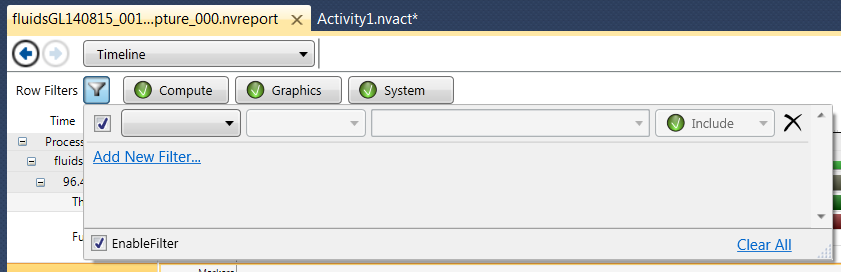
 At the top of the timeline report page, you can select if you want to view analysis results on Compute, Graphics, or System.
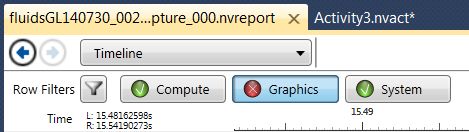
The ones that are displayed on the timeline report are green, the options that have been de-selected are shown in red.
 Axis Mode
 There are three axis modes to view the rendering of the timeline report. You can change the axis mode at runtime through a drop-down menu on the far upper-right corner of the timeline report page.
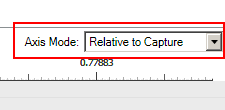
Regardless of which mode you select, the cursor label always displays the seconds from the beginning of the capture. For example, L: reports time from the left edge of the viewport and R: shows the right edge.
There is also a setting in Nsight > Options > Analysis that allows the user to set the default axis mode. This axis mode is persisted with the report, so whenever the user opens a report again, the axis mode should be the same as it was previously.
 Process Information
The information in the Process section of the timeline shows data about each thread and function call invoked within each process.
Group/Row Description Process Row Each process appears on a row with its own name, and contains a group of rows with information about the process. To see data in these rows, you must mark the CPU Thread Trace checkbox (located on the Analysis Activity page) before you begin the capture.
The label is in the following format:
Process_Name [n]
where the Process_Name is the name of the process, and n represents the process ID assigned by the operating system. The timeline shows an area graph with the percentage of CPU capacity used by the process.
To see more precision in the area graph, change the height of the row by clicking and dragging the bottom of the row.
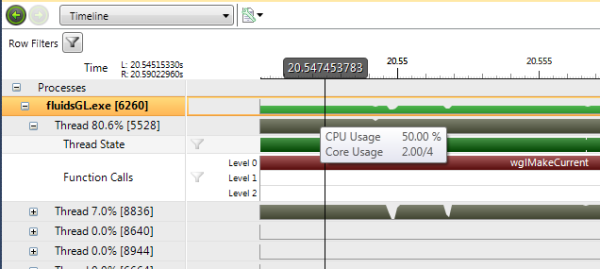
Thread Row Each thread appears on a row, and contains sub-rows with information about the thread's state through time and the function calls made when the thread was runnable. The label is in the following format:
Thread x% [n]
where x% is the percentage of time the thread was running compared to the total capture time. n is the thread ID assigned by the operating system.
Thread State row The Thread State row shows the state of the thread over the lifetime of the thread.
The color ... indicates that the thread was in a ... Blue Initialized state Light green Ready (runnable) state Dark green Running state Medium green Standby state Light gray Terminated state Medium gray state unknown Red Wait state Orange Transition state Function Calls Row The Function Calls row shows the function calls made over the lifetime of the thread.
User Events Row The User Events row shows information about calls made to the nvnxMark function.
The User Events row has multiple child rows. The child rows display a view of nested calls to
nvtxRangePop()andnvtxRangePop()on the thread.To see data in these rows, you must enable the Nsight Markers and Ranges setting, located on the Analysis Activity page. For more information available markers, see the
nvToolsExt.hheader file in the following directory:On 32-bit Windows OS:
C:\Program Files\NVIDIA GPU Computing Toolkit\nvToolsExt\includeOn 64-bit Windows OS:
C:\Program Files (x86)\NVIDIA GPU Computing Toolkit\nvToolsExt\include
 CUDA Information
The information in the CUDA section of the timeline shows information related to each CUDA Context, such as function calls and memory copies that occurred within the Context.
| Group/Row | Description |
|---|---|
| Context Row |
Each CUDA context contains a group of rows with information about that context. The label is in the following format:
where the first number represents the context ID and the second number represents the device ID. The above example represents the first context created in the process on [device]. In the above example device == 0 Context 0 is a "dummy" context where CUDA Driver API calls are made when no context is active on the current thread. |
| Runtime API Row | For each context, a Runtime API row shows the CPU calls made into the CUDA Runtime interface on this context. |
| Driver API Row |
Within each context, a Driver API row shows the CPU calls made to the CUDA driver interface during the lifetime of the CUDA Context. If the target application was programmed against the CUDA runtime interface, this row can also include the driver calls made through the runtime layer. This behavior is configurable from the NVIDIA Nsight activity page. |
| Nsight Row | This row contains information, such as warnings or error messages, output by NVIDIA Nsight to annotate the trace capture. These messages are aimed at providing a better understanding of the tools' impact on the capture. |
| Memory Row |
Within each context group, a Memory row shows information about memory copies. This row corresponds to the information displayed in the Activity Report called CUDA Memory Copies. Each interval represents a memory copy or memory set of type H->D, or D->H. For D->D (intradevice transfer) activity, look at the Compute row located below the Memory row.
|
| Compute Group |
The top row shows the summation of all kernel launches on a specific context. Each row under the Compute group shows when a specific function executed. The label is in the following format:
where the first number represents the amount of time the kernel executed divided by the total amount of time for the capture. The second number represents the number of kernel launches. In the above example, 20.9% of the capture time was occupied by kernel execution, and 51 kernels were launches. (Many D to D memory copies and memset calls are implemented as kernels.) Children rows show the time for each template instantiation. You can expand each templated kernel row to see information about each instantiation. |
| Counters Group |
Within each context group, the Counters row shows the software counters derived from the trace data. |
 OpenCL, OpenGL and DirectX Information
The OpenCL, OpenGL, and the DirectX group of rows show API trace information. To see data in these rows, you must enable the collection of OpenCL, OpenGL or DirextX information on the Analysis Activity Document.
NOTE: The rows show the timing of the calls from the CPU portion of source code. The rows do not indicate when the GPU performed the work.
 System Information
The information in the System section of the timeline shows CPU usage.
| Group/Row | Description |
|---|---|
| CPU% Row |
Each row shows a different virtual core of the system. Each row shows two area graphs: one in gray and the other in light green. The gray area represents the core utilization of all processes combined (excluding the IDLE process). The light green area represents the core utilization of the launched process. |
| CPU (Process Core Allocation) Row |
Each row shows a different virtual core of the system. The graph shows the allocation of a process to the core. Each process has its own color. The launched process is shown in light green. |
In the GPU Usage section, you will notice various node and engine numbers when you expand the drop-down.
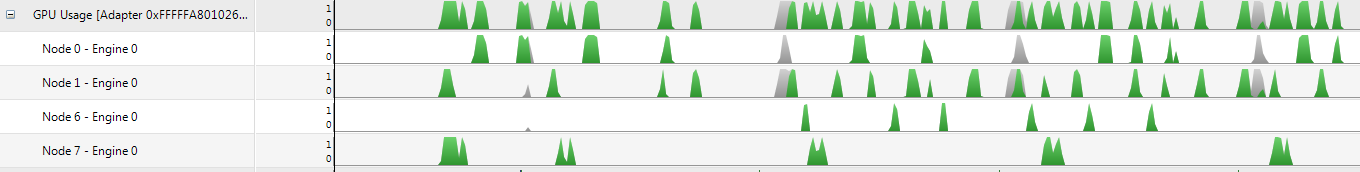
The WDDM represents GPUs as a set of engines. These engines get assigned to nodes to make up virtual function units.
All engines in a node need to be of the same type – the types are as follows:
typedef enum _DXGK_ENGINE_TYPE {
DXGK_ENGINE_TYPE_OTHER             = 0,
DXGK_ENGINE_TYPE_3D                = 1,
DXGK_ENGINE_TYPE_VIDEO_DECODE      = 2,
DXGK_ENGINE_TYPE_VIDEO_ENCODE      = 3,
DXGK_ENGINE_TYPE_VIDEO_PROCESSING  = 4,
DXGK_ENGINE_TYPE_SCENE_ASSEMBLY    = 5,
DXGK_ENGINE_TYPE_COPY              = 6,
DXGK_ENGINE_TYPE_OVERLAY           = 7
} DXGK_ENGINE_TYPE;
Activity on nodes such as "Other" and "3D" can be treated as "graphics and/or compute." They are not necessarily a strict split by compute versus graphics.
For more information, see http://msdn.microsoft.com/en-us/library/windows/hardware/dn265417%28v=vs.85%29.aspx
 Correlation and Details Panes
Please see Analysis Report Correlation for more information on this section of the timeline report.
The following tips explain how to move around the timeline. For more information about hotkeys and navigation, see How To: Navigate the Timeline Report.
Hold down the Ctrl key, and left-click and drag to the right or left to move the visible part of the timeline.
Hold down the Shift key, and use the mouse scrollwheel.
Select a portion of the timeline, and then left-click on the selection to set the view extent of the timeline to selection interval.
NVIDIA® Nsight™ Development Platform, Visual Studio Edition User Guide Rev. 4.6.150311 ©2009-2015. NVIDIA Corporation. All Rights Reserved.