Open topic with navigation
API Inspector
NVIDIA® Nsight™ Application Development Environment for Heterogeneous Platforms, Visual Studio Edition 5.2 User Guide
Send Feedback
When using the Frame Debugger feature of NVIDIA Nsight, you may wish to do a deep dive into the specific draw calls in order to analyze your application further.
To use the API Inspector:
- Start the Frame Debugger by launching the application and going to Nsight > Pause and Capture Frame.
- If not already opened by default, you can open the API Inspector by going to Nsight > Windows > API Inspector or by clicking the link for the action in the Events View.
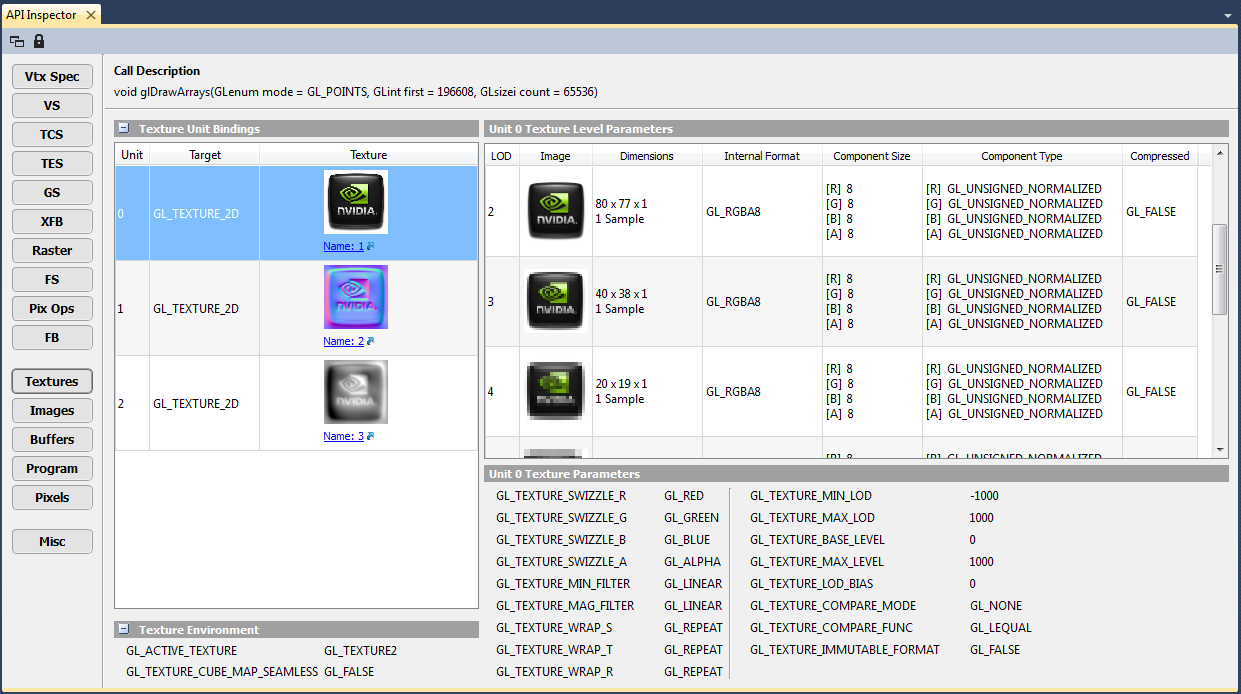
- The API Inspector page opens, and shows information about the draw event.

API Inspector Navigation
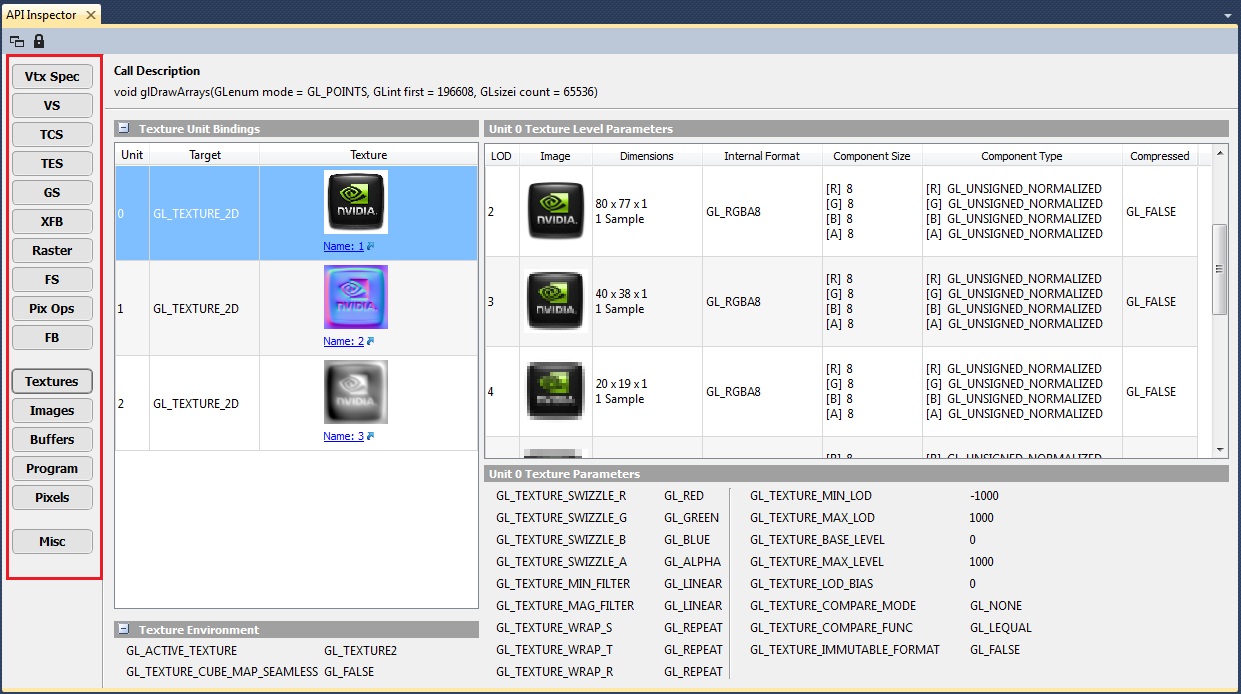
There are three different categories of API Inspector navigation.

1. The Pipeline Section
The first category is laid out like a "virtual GPU pipeline." This pipeline section of the API Inspector consists of the following:
- Vtx Spec (Vertex Specification) – State information associated with your vertex attributes, vertex array object state, element array buffer, and draw indirect buffer.
- VS (Vertex Shader) – Vertex shader state, including attributes, samplers, uniforms, etc.
- TCS (Tessellation Control Shader) – Tessellation control shader state, including attributes, samplers, uniforms, control state, etc.
- TES (Tessellation Evaluation Shader) – Tessellation evaluation shader state, including attributes, samplers, uniforms, evaluation state, etc.
- GS (Geometry Shader) – Geometry shader state, including attributes, samplers, uniforms, geometry state, etc.
- XFB (Transform Feedback) – Transform feedback state, including object state and bound buffers.
- Raster (Rasterizer) – Rasterizer state, including point, line, and polygon state, culling state, multisampling state, etc.
- FS (Fragment Shader) – Fragment shader state, including attributes, samplers, uniforms, etc.
- Pix Ops (Pixel Operations) – State information for pixel operations, including blend settings, depth and stencil state, etc.
- FB (Framebuffer) – State of the currently drawn framebuffer, including the default framebuffer, read buffer, draw buffer, etc.
2. Object and Pixel State Inspectors
The object and pixel state inspectors section of the API Inspector consists of the following:
- Textures – Details about all of the currently bound textures and samplers, including texture and sampler parameters.
- Images – Details about all of the images currently bound to the image units.
- Buffers – Details about all of the bound buffer objects, including size, usage, etc.
- Program – Information about the currently bound program object and/or pipeline program pipeline object, including shaders, active uniforms, etc.
- Pixels – Current settings for pixel pack and unpack state.
3. Miscellaneous
The miscellaneous screen contains additional information such as shader limits, implementation dependent values, transform feedback limits, and various minimum/maximum values.
NVIDIA® Nsight™ Application Development Environment for Heterogeneous Platforms, Visual Studio Edition User Guide Rev. 5.2.161206 ©2009-2016. NVIDIA Corporation. All Rights Reserved.
Open topic with navigation