To open a previously saved frame timings session, go to File > Open, and select the *.nvframetimings file.
If you select a performance marker, all of the draw calls inside that performance marker are selected in the graphs below, helping to visualize the draw calls for that section of rendering.
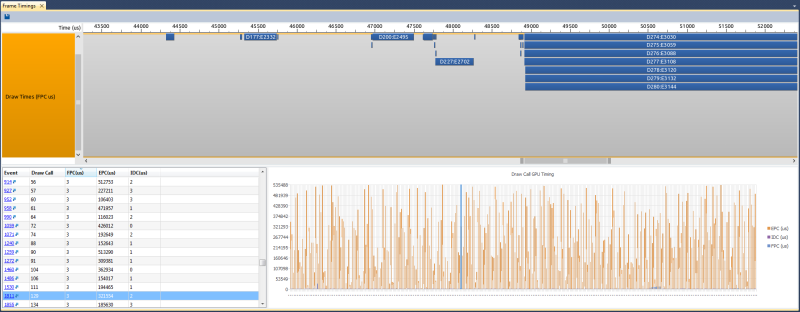
- Empty Pipeline Cost (EPC) — The cost of the draw call when isolated on the GPU. This value shows how much a given draw call costs by itself, not taking into account contention for resources with other draw calls.
- Full Pipeline Cost (FPC) — The cost of the draw call while other draw calls are in flight. This is important because it shows the impact of the other work that is being processed while the draw call in question is rendering.
- Incremental Draw Cost (IDC) — This is the incremental cost of a given draw call. Because of the bandwidth of the GPU pipeline, many draw calls can be processed in parallel, resulting in little to no frame rate hit when you add a draw call.
