NVIDIA® Nsight™ Application Development Environment for Heterogeneous Platforms, Visual Studio Edition 5.2 User Guide
Send Feedback
The Resources View allows you to see all of the available resources in the scene.
To open the Resources page, go to Nsight > Windows > Resources. There are two tabs available here: Graphical and Memory.
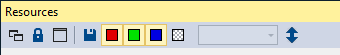
At the top of the Resources view, you'll find a toolbar:
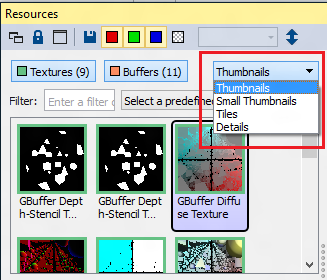
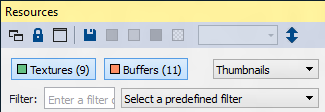
Below the toolbar is a set of buttons, described below, for high-level filtering of the resources based on type. Next to that, there is a drop-down menu that allows you to select how you wish to view the resources: thumbnails, small thumbnails, tiles, or details.
If you select the Details view, you can sort the resources by the available column headings (type, name, size, etc.).
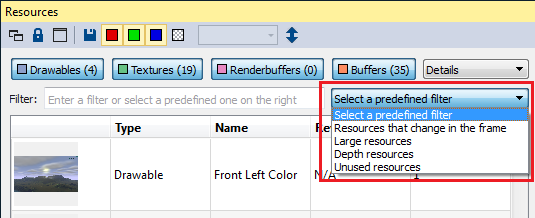
There are three ways to filter the available resources.
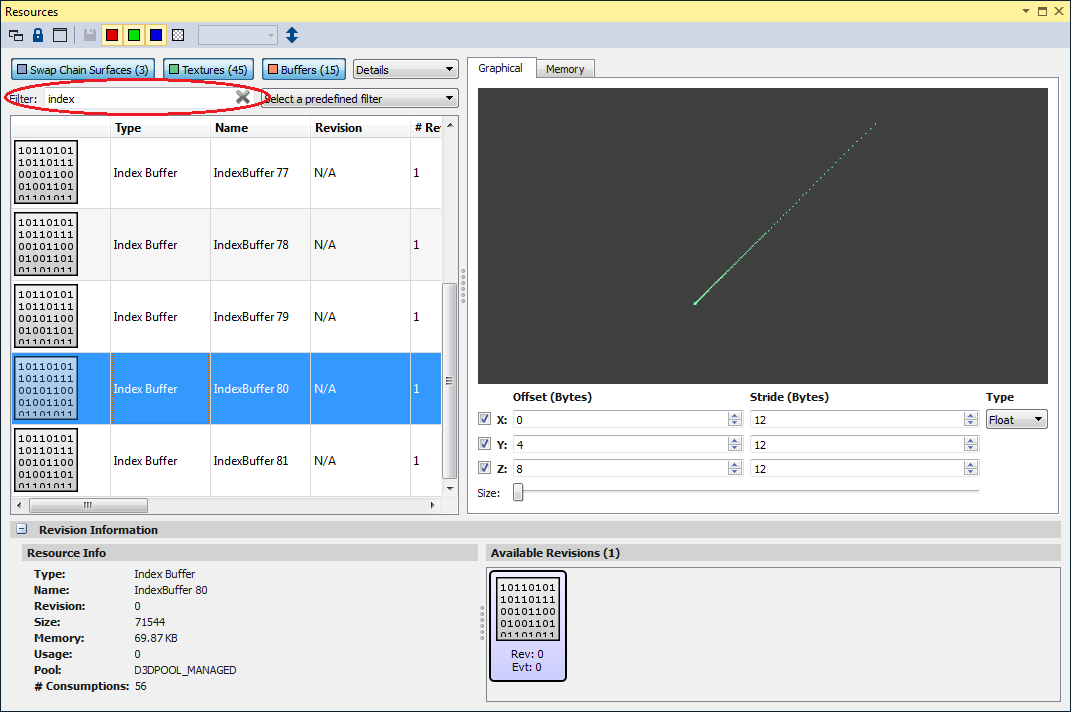
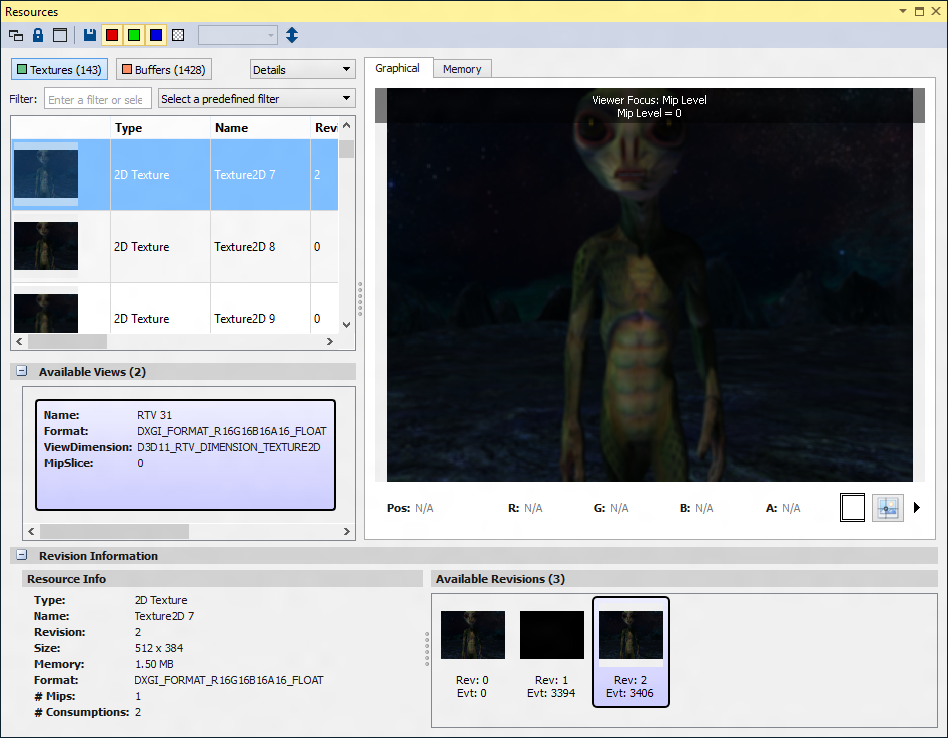
The Graphical tab allows you to view the resource, pan using the left mouse button to click and drag, zoom using the mouse wheel, and inspect pixel values. Also, this is where you can initiate a pixel history (by clicking Select Pixel, see Pixel History for more detail), as well as save the resource to disk.
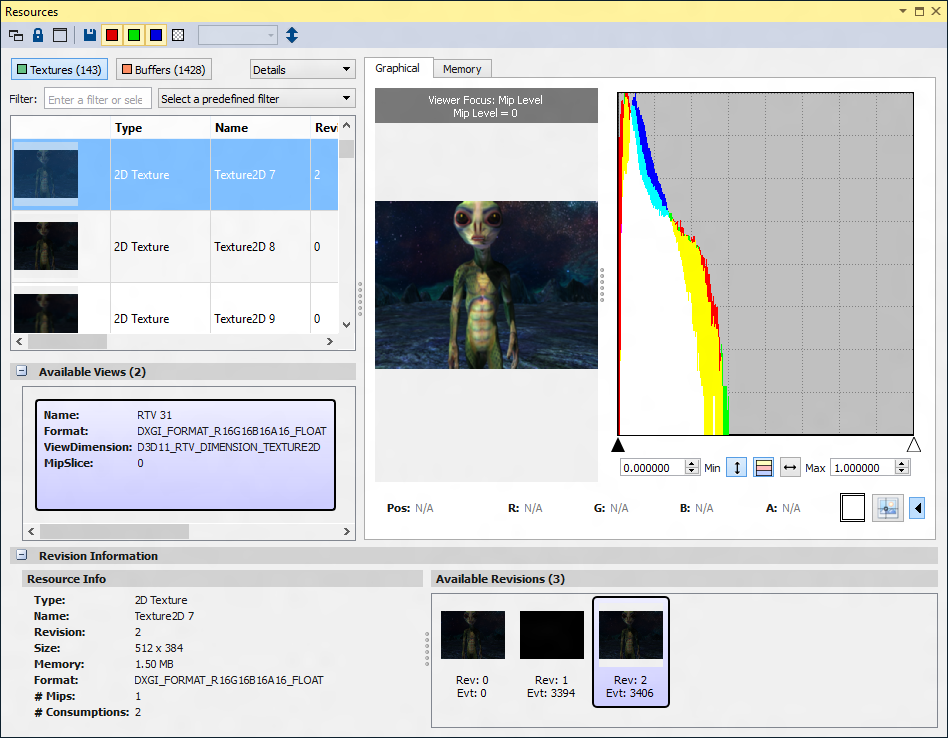
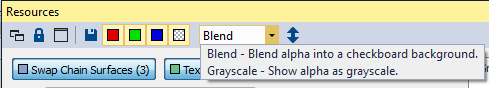
When you have selected a resource from the left pane, the Show Histogram button will be available on the right side of the Graphical tab, which allows for remapping the color channels for the resource being viewed.
To modify the histogram view, the following options are available:
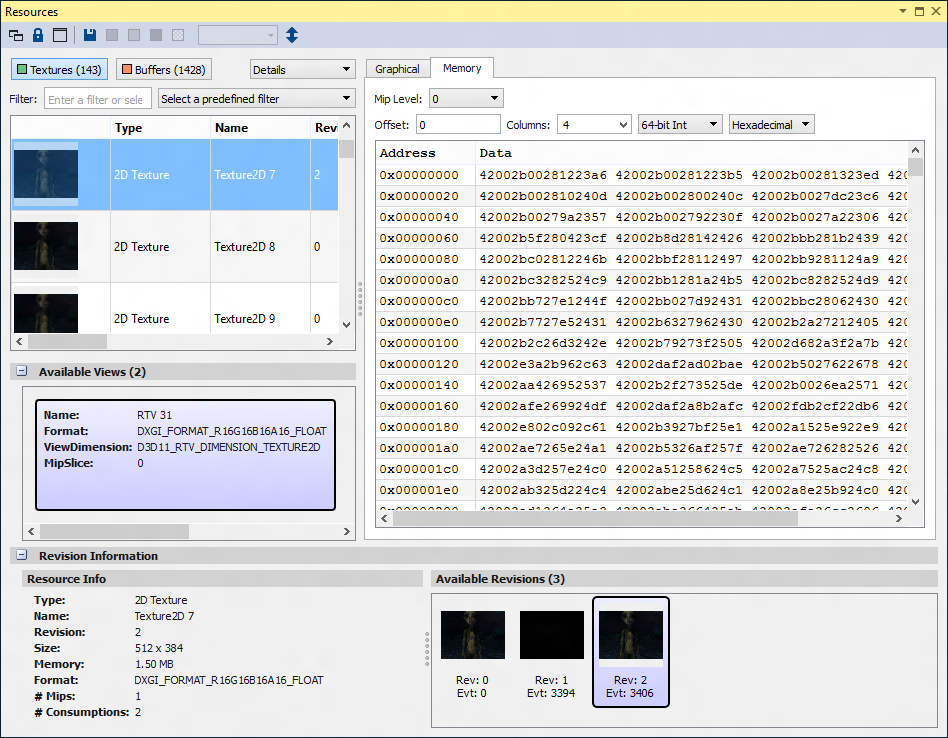
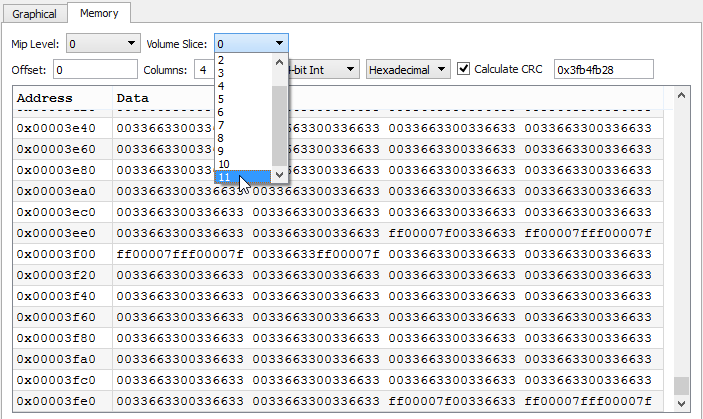
The Memory tab shows a binary dump of the resource data. You can use the controls at the top to cast the values to different data types and decide how many columns to display.
On the Memory tab, you can view details about the texture you've selected.
Mip Level is used for lower-resolution textures, while Volume Slice is used for 3D textures. You can select either the slice or the mip level you are interested in viewing, which will provide more data on both the Memory and Graphical tabs.
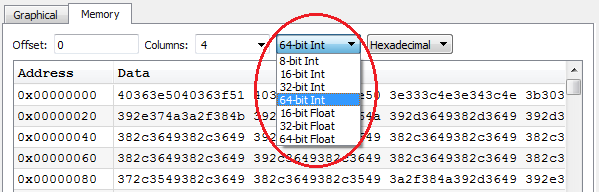
You will also find two drop-down menus on the Memory tab, for setting how you want to view the memory data.
The first drop-down specifies the size and type to use when displaying the data (either integer or floating point data).
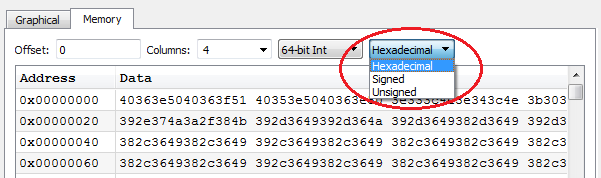
The second drop-down is a further modifier for the integer formats — you can choose hexadecimal, signed, or unsigned formats. Note that if you select to display floating point data, this drop-down menu will be disabled.
NVIDIA® Nsight™ Application Development Environment for Heterogeneous Platforms, Visual Studio Edition User Guide Rev. 5.2.161206 ©2009-2016. NVIDIA Corporation. All Rights Reserved.