You are here: Graphics Debugger > Shader Debugging > Direct3D 11 Shader Debugging > Pixel History

Pixel History

NVIDIA® Nsight™ Application Development Environment for Heterogeneous Platforms, Visual Studio Edition 5.2 User Guide
Send Feedback


The NVIDIA Nsight Shader Debugger allows you to inspect which draw events contributed to a pixel’s values up to the currently selected event.

To view Pixel History:

  1. Open the Resources page by going to NsightWindowsResources.
  2. Click on the Graphical page.

  3. Zoom in or out of the render target image to make it easier to select a pixel.
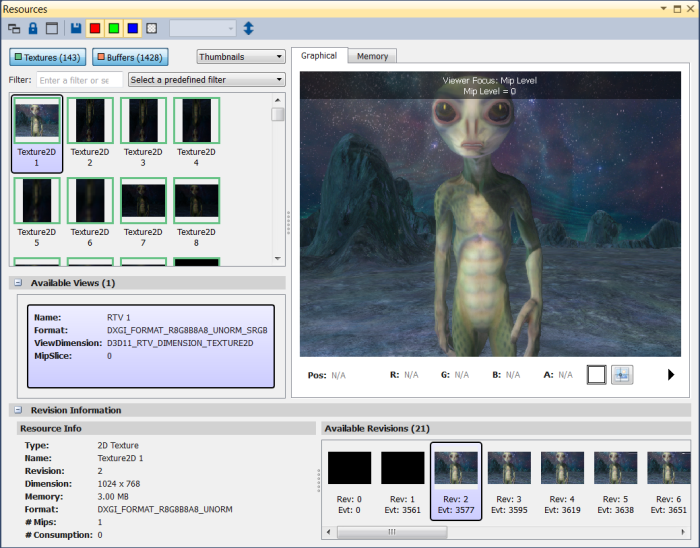
    1. Click on the render target image.
    2. Move the scroll wheel on the mouse to zoom in and out.
    3. Click and drag the render target image to move the image up and down, and side to side.
  4. Click on the Select Pixel link. The crosshairs change color.

  5. Use the mouse to move the crosshairs over the pixel you want to inspect.
  6. Click the mouse on the pixel of interest. The Pixel History page opens, showing pixel information for each draw event that generated a change to that pixel's attributes.

    To see the draw call page for a particular draw call, click on the corresponding Draw Call link.

    To open the source code of the draw call, click on the corresponding Debug Pixel link.


NVIDIA® Nsight™ Application Development Environment for Heterogeneous Platforms, Visual Studio Edition User Guide Rev. 5.2.161206 ©2009-2016. NVIDIA Corporation. All Rights Reserved.