
|
Note that the NVIDIA Nsight Shader Debugger supports only Direct3D 11 and OpenGL applications. Debugging of HLSL Effects (anything compiled with an fx_N_M target) is not supported, only pure HLSL shaders. |
NVIDIA® Nsight™ Application Development Environment for Heterogeneous Platforms, Visual Studio Edition 5.2 User Guide
Send Feedback
The NVIDIA Nsight Shader Debugger tools allow you to perform source-level debugging of various HLSL shader types.
|
|
Note that the NVIDIA Nsight Shader Debugger supports only Direct3D 11 and OpenGL applications. Debugging of HLSL Effects (anything compiled with an fx_N_M target) is not supported, only pure HLSL shaders. |
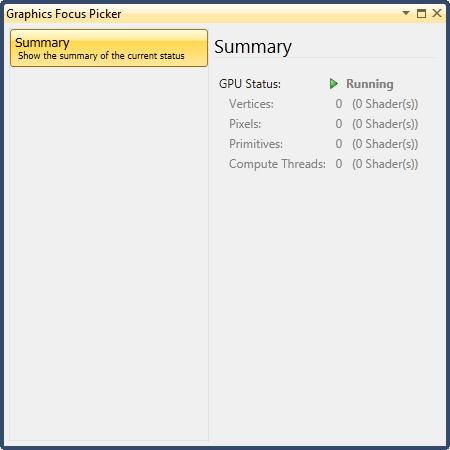
To access the Shader Debugger:
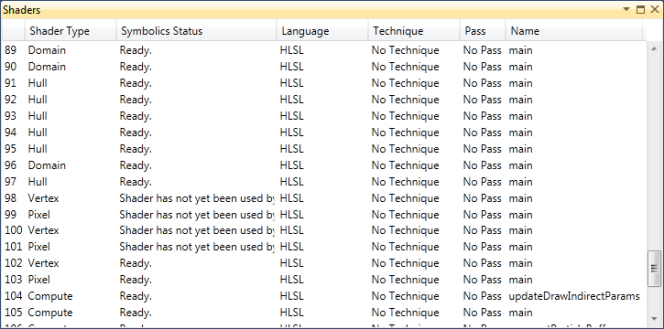
The following table shows the possible states of the Symbolics Status:
Status Meaning Ready The shader can be debugged. Shader has not yet been used by the application The shader is created, but it has not been used by the application. That means that it cannot yet be debugged. No symbols have been loaded for this shader. The shader cannot yet be debugged. This usually happens during startup when the debugger is still loading a defined shader, but has not yet loaded the debug symbolics required for debugging. Not a debuggable shader. The shader cannot be debugged. The shader was likely submitted as a binary shader compiled without debug information, which means that the instructions being executed cannot be mapped to the original HLSL source code.
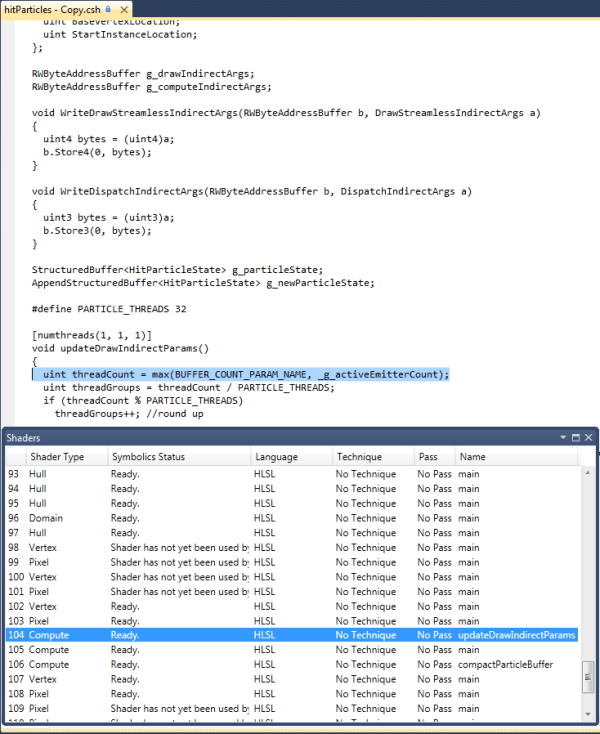
| Note that you must open the shader from the shader list or the API Inspector page, in order to use the debugger. You cannot open the from disk using the File > Open menu, or by double-clicking on an shader file in the project. NVIDIA Nsight will not resolve the file to shaders active in the program. |
In order to debug shaders and use the Pixel History functionality, NVIDIA Nsight needs access to the original HLSL source code of your shaders. There are a few ways to accomplish this task. The first is to submit the HLSL source at startup time and compile your shaders, using D3DXCompileShader, etc. NVIDIA Nsight can intercept these calls to gain access to the HLSL source code and display it for debugging.
Alternatively, you can precompile the shaders into binary format using the same functions and saving the results out to a file, or use the offline compiler, fxc.exe, provided by the DirectX SDK. However, using this method, you need to specify some flags in order for the HLSL debug information to be embedded in the binary output, outlined below:
D3DXCompileShader Compiler Flag (using fxc.exe) D3DXSHADER_PREFER_FLOW_CONTROL/GfpD3DXSHADER_DEBUG/ZiD3DXSHADER_SKIPOPTIMIZATION/Od
If no source debug information is available for a shader, byte code-level debugging will be possible. This includes being able to set breakpoints on byte code instructions, stepping byte code instructions, and inspecting register values.
To enable byte code debugging even with applications where the source code is available, set the Force Assembly Debugging option to True, before starting the debug session. Note that it is not possible to switch between the two byte code debugging and source code debugging after the application has been started.
If source debug information is available for a shader, because either the application submitted HLSL or a precompiled shader with debug information was provided, source-level debugging will be the default debug mode. In this case, it will not be possible to switch to byte code debugging.
NVIDIA® Nsight™ Application Development Environment for Heterogeneous Platforms, Visual Studio Edition User Guide Rev. 5.2.161206 ©2009-2016. NVIDIA Corporation. All Rights Reserved.