NVIDIA® Nsight™ Application Development Environment for Heterogeneous Platforms, Visual Studio Edition 5.2 User Guide
Send Feedback
The Range Profiler is a powerful tool that can help you determine how sections of your frame utilize the GPU, and give you direction to optimize the rendering of your application. Once you have captured a frame, the Range Profiler displays your frame broken down into a collection of ranges, or groups of contiguous actions. For each action, you can see the GPU execution times for each, as well as detailed GPU hardware statistics across all of the units in the GPU.
The Range Profiler also includes unmatched data mining capabilities that allow you to group calls in the frame into ranges based on various criteria that you choose.
To profile a graphics frame:
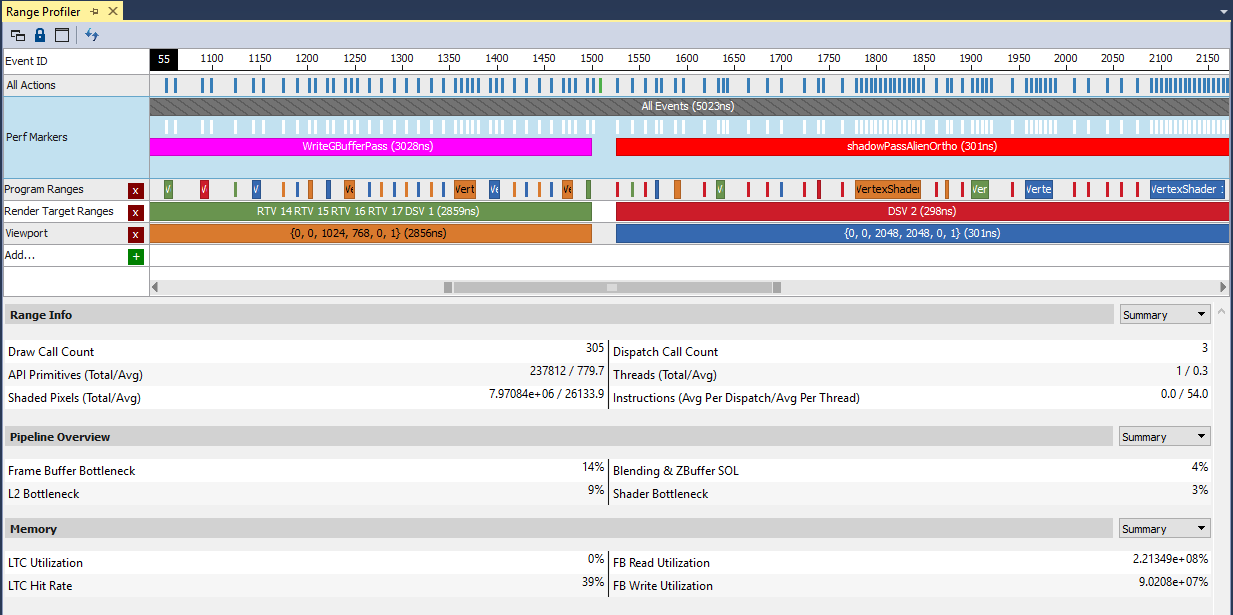
The Range Profiler View has four main parts: the Scrubber, which shows the ranges of actions, and the Range Info, Pipeline Overview, and Memory sections, which show the performance information for the currently selected range in the Scrubber.
On the right side of the header for each section, there is a drop-down menu that allows you to select different views for that section. The Summary highlights important aspects of the selected range, Range Details shows deeper data for the range, and Action Details shows statistics for each action in the selected range.
The top of the Range Profiler View includes a Scrubber, which mirrors the Scrubber View.
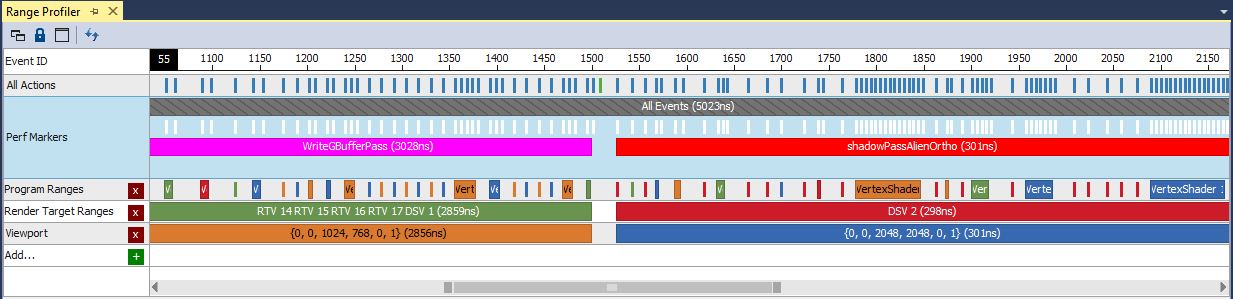
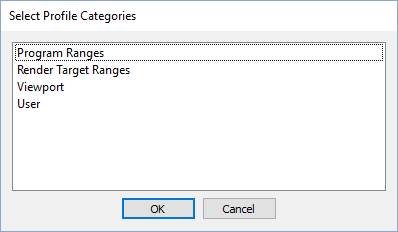
The default view will show ranges based on the performance markers you have defined in your application. These can be done via the NVTX library, KHR_debug, or any other range definition API supported by your graphics API of choice. Clicking the Add... button will open a dialog that allows you to select what type of range you want to add.
When you click on a range on the Scrubber portion, the other sections of the Range Profiler View will automatically update with that selected range's information.
The left half of the Range Info section shows a draw call summary, while a summary of compute or dispatch calls is on the right.

From the drop-down menu on the right, you can select either the Summary or Details view. The Summary display is shows by default; the Details display will show tables with all of the statistics in the Summary for all of the draw and dispatch calls in a table format.
When displaying the Summary, the Pipeline Overview section shows the top four "inefficiently" utilized units in the GPU pipeline. These show you, at a glance, where the most inefficient units are in the pipeline for the currently selected range.
The drop-down menu on the right shows two other available views: Range Details and Action Details.
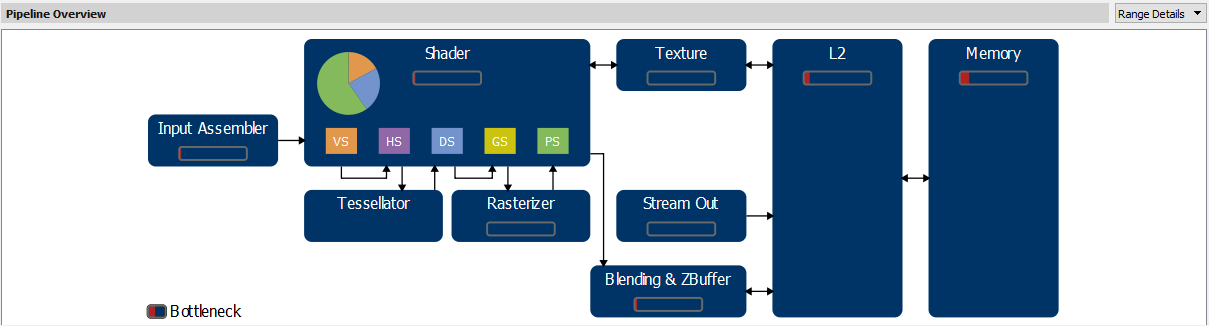
The Range Details of the Pipeline Overview section displays an "inefficiency" percentage for each GPU unit for the currently selected range. The results are laid out in the same way that data flows through the GPU pipeline. It starts from the Input Assembler, where the vertex attributes are gathered, loops multiple times through the shader unit, samples from the texture units, reads from L2 and the impact those have on the memory subsystem, etc. Note that this graph may vary based on the hardware being used, as well as the way your application utilizes the graphics API and GPU.
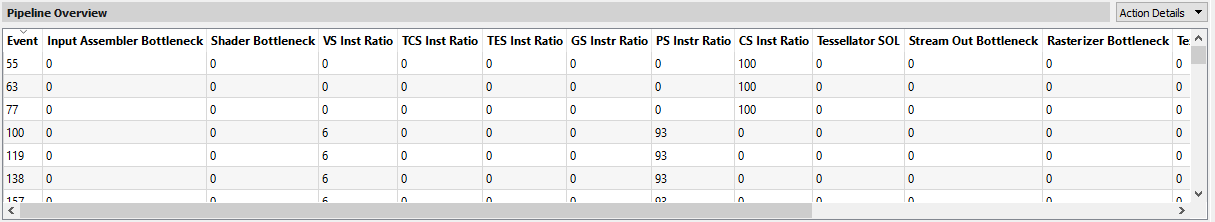
The Action Details display is essentially a raw output of the data you are profiling for each draw call/dispatch call in the currently selected range. The rows list the actions in the selected range, and the columns show the pipeline details for each event. Hovering your cursor over a given cell will show more detailed information for that action.
The Memory section shows a Summary display by default, with L2 utilization information on the left, and frame buffer information on the right. From the drop-down menu, you can select the Range Details display.
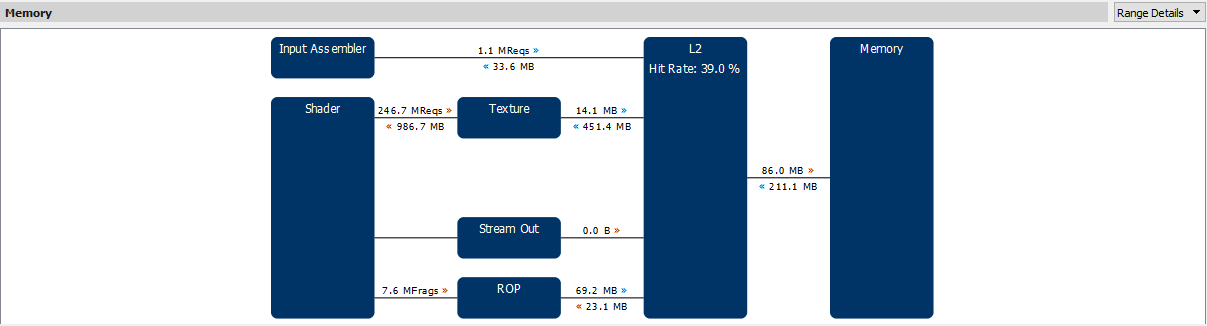
The Range Details display of the Memory section displays percentage utilization of the links between the various units that consume the memory subsystem resources. For example, the shader unit makes requests to the texture unit. These requests result in L2 cache queries, which may miss and have to load the data from the GPU memory.
NVIDIA® Nsight™ Application Development Environment for Heterogeneous Platforms, Visual Studio Edition User Guide Rev. 5.2.161206 ©2009-2016. NVIDIA Corporation. All Rights Reserved.