Open topic with navigation
View CUDA Information
NVIDIA® Nsight™ Application Development Environment for Heterogeneous Platforms, Visual Studio Edition 5.2 User Guide
Send Feedback
The CUDA Information tool window shows information on the current state of CUDA within the process that is being debugged.
To view the CUDA Information Tool Window:
- Launch the CUDA Debugger.
- Open a CUDA-based project.
- Make sure that the Nsight Monitor is running on the target machine.
- From the Nsight menu, select Start CUDA Debugging.
As an alternate option, you can also right-click on the project in Solution Explorer and choose Start CUDA Debugging.
- The CUDA Debugger starts and launches the target application.
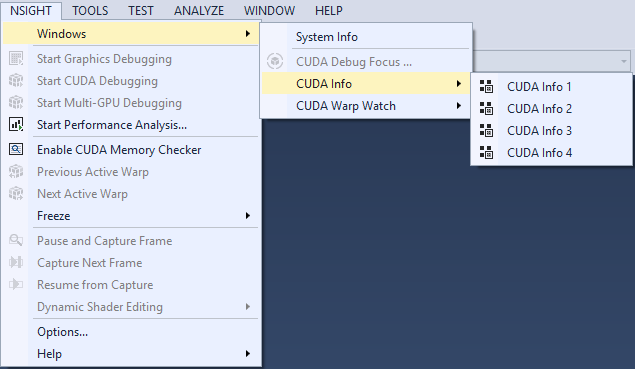
- From the Nsight menu, choose Windows > CUDA Info. Select the CUDA Info page that you wish to open.
General Features of the CUDA Information Tool Window
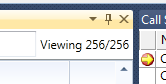
Viewing Rows
This displays the number of rows in the current view. If the view is filtered, the number shown may be less than the number of total rows.
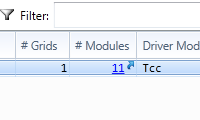
Hyperlinks
A hyperlink will use a specific filter to jump the current tool window to another page. For example, clicking a link in the Modules column will link you to the Modules tool window.
Filtering Results
Use $("Column Name") to specify by the exact name of the column, including spaces. The column name must be quoted.
- For example, in the Warps Page:
$("Active Mask") == 0xffffffff
The results in each page can be filtered by an expression. This leads to shorter expressions.
- For example, in the Warps Page:
Status=="Breakpoint" && FlatBlockIdx > 30
Other tips for filtering:
- To see an auto-completion window, type the first letter of the column. Use Reset Filter to clear the current filter for the page.
- To find all functions with a certain string, you can use
Name.StartsWith("bar"), Name.Contains("bar"), Name.Endswith("bar"), and ! operations.
- Filters that have been created by hyperlinks are not persisted between debug sessions. This is because these often have specific identifiers, such as context or module IDs, which would not make sense in the next debug session. However, any filter that is created by a user will persist with the page, whether it contains unique IDs or not.
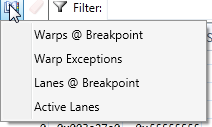
Bookmarks
Bookmarks are a quick way to jump to a specific page, with a preset filter.
Persistence
When debugging, each page will persist the last state that it was displaying. Any filters that have been created by clicking on a hyperlink will not be persisted in the next debug session.
Focus
To update the current focus in the Warps and Lanes pages, you can use any of the following methods:
- CUDA Focus Picker
- Next Warp or Previous Warp commands
- Using Set Focus in the Warp page
- Using Set Focus in the Lanes page
CUDA Info Tool Window Pages
There are several pages within this tool window that allow you to view different aspects of your CUDA application that is being debugged.
The CUDA Information tool window pages include the following:
Arrays
The Arrays page shows information about all arrays in the process that is being debugged.
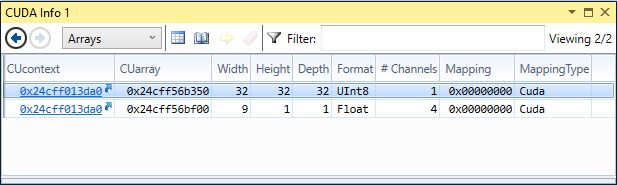
For more information on the Arrays page, see CUDA Arrays.
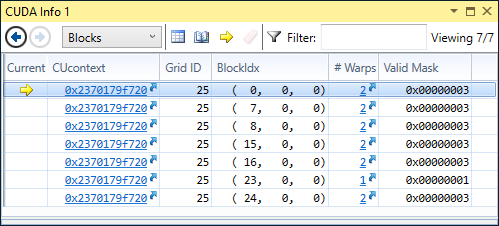
Blocks
The Blocks page shows all active blocks in the current kernel running on the GPU. The link in the CUcontext column will open the Contexts page. The hyperlink in the # Warps column will jump to the Warps page, filtered to the specific block.
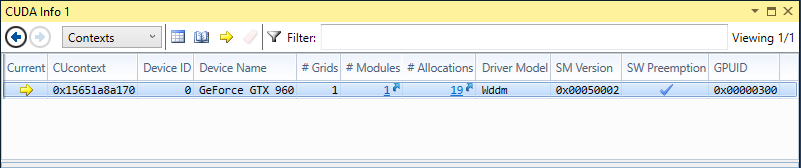
Contexts
The Contexts page shows information about all contexts on all GPUs in the process that is currently being debugged. Information on this page is always available, even when the process has not been stopped.
Note that the SW Preemption column is used to show if the application is using software preemption (on a single GPU) or non-preemption (either classic or hardware).
For more information on CUDA context object types, see CUcontext.
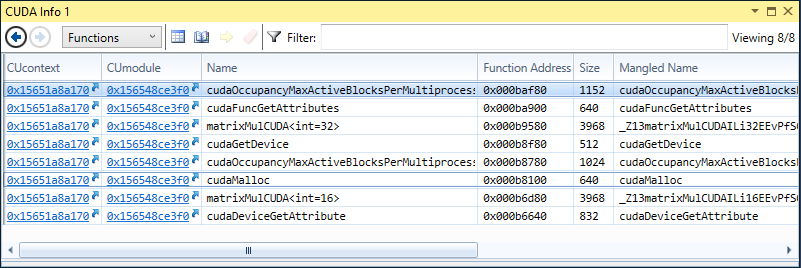
Functions
The Functions page shows information about all functions in all loaded modules. Information on this page is always available, even when the process has not been stopped.
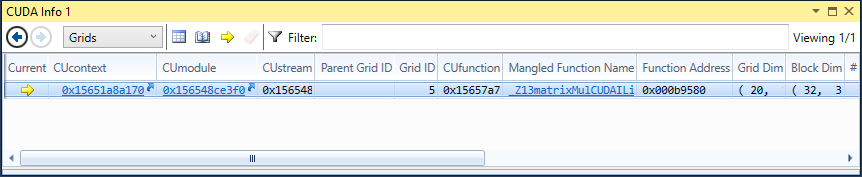
Grids
The Grids page shows all active and queued kernels on the GPU. The current kernel will have a # Blocks greater than 0. Other kernels will show # Blocks set to 0.
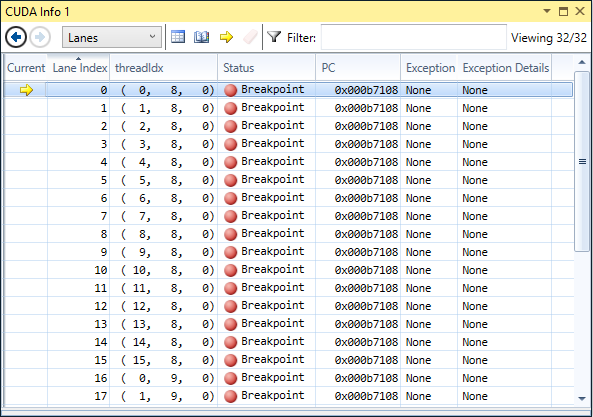
Lanes
The Lanes page displays information about all lanes in the current focus warp. A lane is a single thread in one warp.
The current state of the lane is shown as a barrier in the Status column.
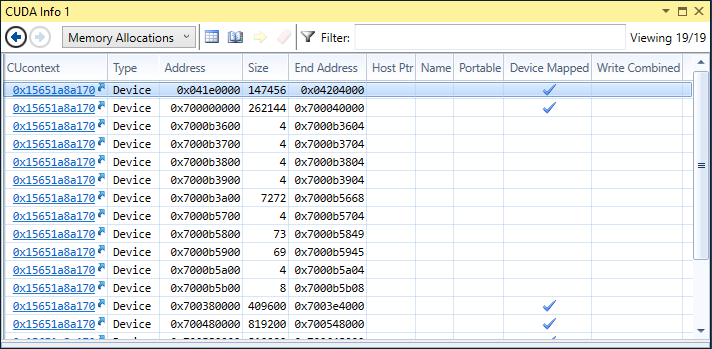
Memory Allocations
This page shows information for all CUDA global memory allocations, in all CUcontexts in the application. This page automatically updates when suspended in a kernel.
Like other pages, the results can be filtered. For example:
CUcontext==0x02c8c258
MemoryAllocationType == "Host" && Size > 100
A few columns to note on this page include the following:
Right-click on a particular line and select Set Memory View Expression to open the Memory window.
Modules
The Modules page displays information about all modules in all contexts. The information shown here matches the modules that are seen in the Visual Studio Modules view. Information on this page is always available, even when the process has not been stopped.
Tips for using the Modules page:
- Filtering results: Use HasSymbols to see only the loaded modules that have symbols.
- Any module without symbols will not be able to hit a breakpoint in a kernel.
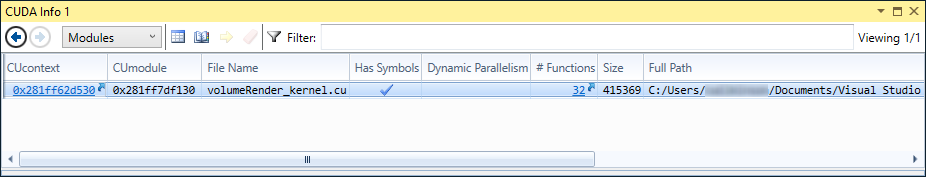
The Dynamic Parallelism column shows whether there is a nested kernel launch, in which a kernel launches another kernel. For more information, see CUDA Dynamic Parallelism.
Surfaces
The Surfaces page provides details on all of the CUDA surface object handle types per CUDA context.
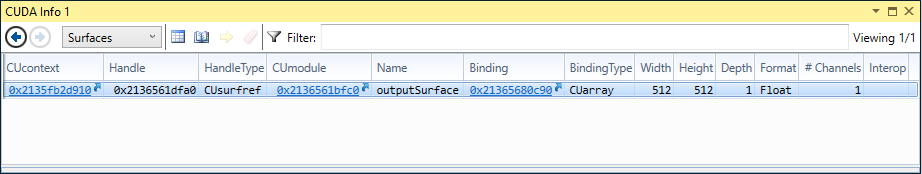
For more information, see Surface Object API.
Textures
The Textures page provides details on all of the CUDA texture object handle types per CUDA context.
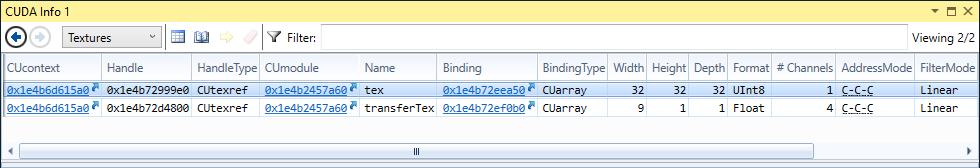
For more information, see Texture Object API.
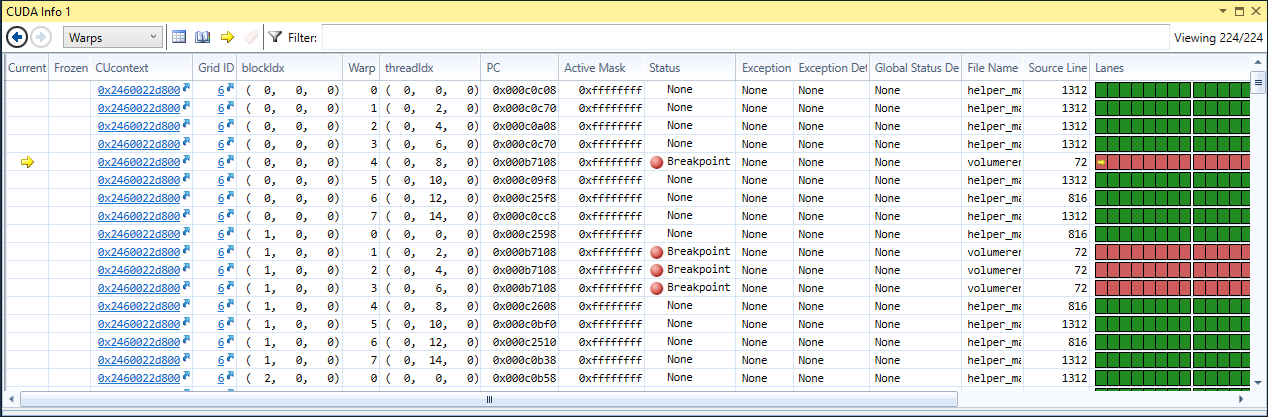
Warps
The Warps page displays all active warps on the GPU. Each row represents one warp, and the Lanes column displays information about all lanes for each of the warps in the view. A lane is a single thread in one warp. The Lanes column gives per-lane details about any warp exceptions; the current state is shown in the Lanes column.
Focus
- The current focus is denoted by a yellow arrow.
- Using right-click > Set Focus on the lane index number, or double-clicking a thread in the Lanes column, will change the view to that specific thread.
- Using right-click > Set Focus or double-clicking elsewhere in the same row will go to the first active thread in the selected warp.
- The user can switch to either active or inactive lanes; however, the focus cannot be changed to Not Launched lanes.
-
The user can freeze specific warps within the warps page itself. This set of frozen warps is managed separately from the global freeze control. Freezing warps 1, 2, and 3, and then toggling the global freeze state will leave those warps frozen. (See How To: Use the Global Freeze Page for more details.)
Filtering results:
- Use the Warp Exceptions bookmark to filter to only the warps currently in an exception state.
- Use the Warps @ Breakpoint bookmark to filter to only the warps that have hit a breakpoint.

The color legend for the Lanes column is as follows:
| Color |
Thread State |
| |
Gray |
Inactive |
| |
Forest Green |
Active |
| |
Light Sea Green |
At Barrier |
| |
Red |
At Breakpoint |
| |
Orange |
At Assert |
| |
Dark Red |
At Exception |
| |
Dark Gray |
Not Launched |
| |
Light Gray |
Exited |
Note that if you hover your cursor over a row in the lanes column, a tool tip will appear that shows the state of the lane.
For more information on the Warps page, see the Example Scenarios of the CUDA Warp Watch section.
NVIDIA® Nsight™ Application Development Environment for Heterogeneous Platforms, Visual Studio Edition User Guide Rev. 5.2.161206 ©2009-2016. NVIDIA Corporation. All Rights Reserved.
Open topic with navigation