Open topic with navigation
Analysis Trace Settings
NVIDIA® Nsight™ Application Development Environment for Heterogeneous Platforms, Visual Studio Edition 5.3 User Guide
Send Feedback
When setting up your NVIDIA Nsightanalysis session on the Activity Document, if you have selected either Trace Application or Trace Process Tree under the Activity Type section, you will have the following types of trace settings available for analysis.
System
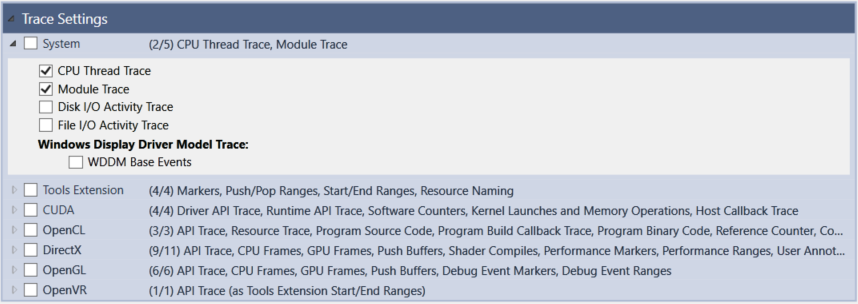
The System option includes the following traces:
- CPU Thread Trace — Enables the collection of CPU thread information.
- Module Trace — Enables collection of module information.
- Disk I/O Activity Trace — Enables the collection of disk I/O events.
- File I/O Activity Trace — Enables the collection of file I/O events.
Note that enabling this option can significantly increase the report file size. In case events get lost during the capture, you should consider increasing the ETW file size limit, the buffer count, or the buffer size.
- Windows Display Driver Model (WDDM) Base Events Trace — Enables the tracing of WDDM base events: vertical syncs, context activities, GPU usage.
If you want to be able to collect call stack trace data from the other performance analysis tests, the System setting must be enabled.

|
Events in the System group use the Event Tracing for Windows (ETW) kernel provider. There are two requirements for capturing these events:
- Nsight Monitor is running with elevated privileges (right-click Nsight Monitor and choose Run As Administrator).
- No monitoring programs (e.g., Task Manager or Process Explorer) are already using the ETW kernel provider.
|
Tools Extension
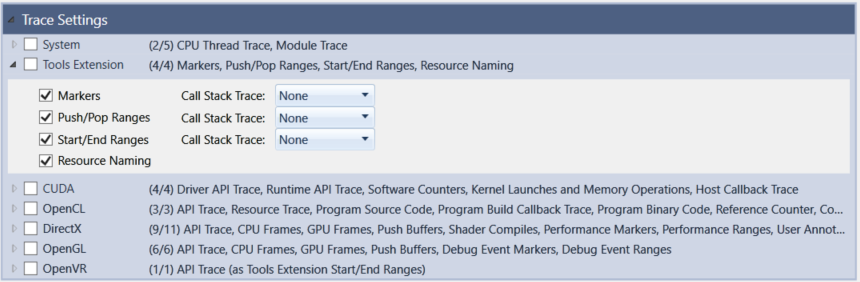
The Tools Extension option includes the following traces:
- Markers — Enables the tracing of NVTX library marker events. The call stack trace options here are None or Always.
- Push/Pop Ranges — Enables the tracing of NVTX library push/pop range events. The call stack trace options here are None, Always, On Push, or On Pop.
- Start/End Ranges — Enables the tracing of NVTX library start/end range events. The call stack trace options here are None, Always, On Start, or On End.
- Resource Naming — Enables the tracing of NVTX library resource naming events.
For more detail on the Tools Extension trace activities, see NVTX Implementation.
CUDA
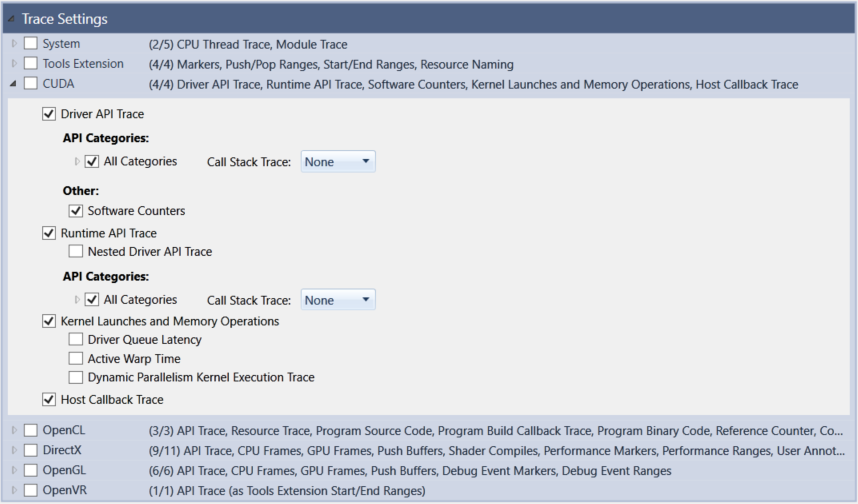
The CUDA option includes the following traces:
- Driver API Trace — Enables tracing of CUDA driver API calls. If you select this option and the API Categories sub-option, you can click the call stack trace drop-down option and select None, Always, or On Error.
- API Categories — You can expand the All Categories option and choose from which APIs you wish to collect data.
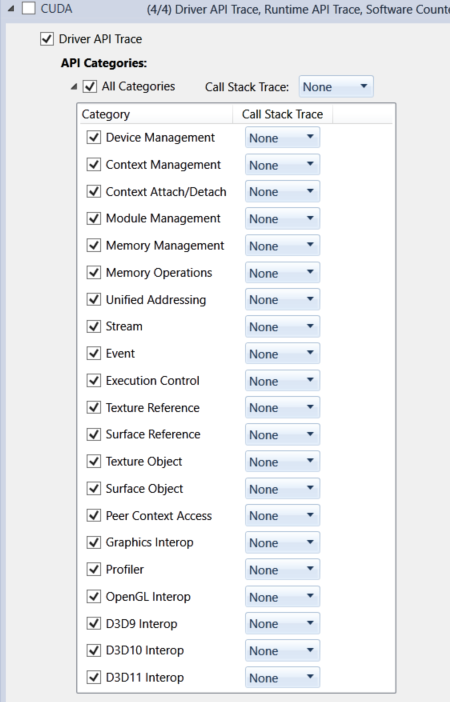
- API Categories
- Device Management
- Context Management
- Context Attach/Detach
- Module Management
- Memory Management
- Memory Operations
- Unified Addressing
- Stream
- Event
- Execution Control
- Texture Reference
- Surface Reference
- Texture Object
- Surface Object
- Peer Context Access
- Graphics Interop
- Profiler
- OpenGL Interop
- D3D9 Interop
- D3D10 Interop
- D3D11 Interop
- Software Counters — Enables collection of software counter tracing.
- Runtime API Trace
- Nested Driver API Trace — Enables tracing of CUDA driver API calls made from inside the CUDA runtime layer.
If you select this option and the API Categories sub-option, you can click the call stack trace drop-down option and select None, Always, or On Error. - API Categories — As with the CUDA Driver API Trace, you can also select the drop-down menu next to All Categories and customize which call stack trace data you wish to collect.
- Kernel Launches and Memory Operations — Enables collection of kernel launches, memory copies, and memory sets.
- Driver Queue Latency — Enables tracking of the driver workload queue and the GPU workload queue. For kernel launches and memory operations, this adds the queue time and the submit time to the report.
- Active Warp Time — Enables tracking of the active warp time for each kernel launch. The active warp time is defined by as the sum of the execution durations for all warps of a kernel launch.
- Dynamic Parallelism Kernel Execution Trace — Enables tracing of the execution activity for dynamic parallelism device kernel launches.
- Host Callback Trace — Enables tracing of host callbacks added to CUDA streams.
OpenCL
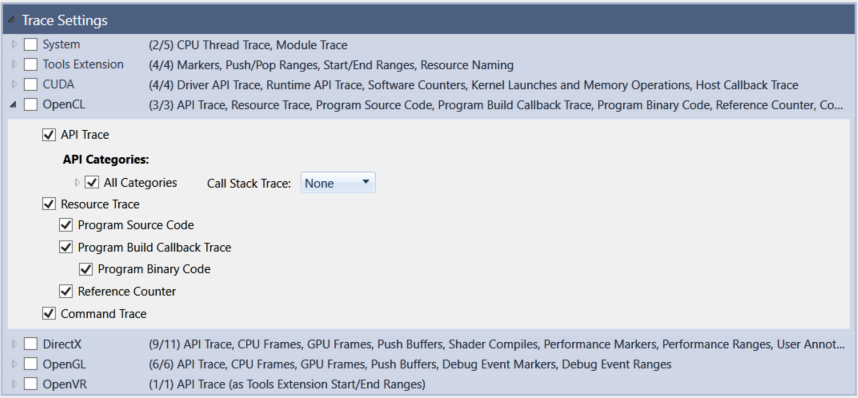
The OpenCL option includes the following traces:
- API Trace — Enables tracing of OpenCL API calls. If you select this option and the API Categories sub-option, you can click the call stack trace drop-down option and select None, Always, or On Error.
- API Categories — As with the CUDA Driver API Trace, you can select the drop-down menu next to API Categories and customize which call stack trace data you wish to collect.
- Resource Trace — Enables tracing of OpenCL resources.
- Program Source Code — Enables tracing of source code for OpenCL programs.
- Program Build Callback Trace — Enables tracing of the OpenCL build program
pfn_notify callback. - Program Binary Code — Enables tracing of binary code for OpenCL programs.
- Reference Counter — Enables tracing of reference counters for OpenCL objects.
- Command Trace — Enables tracing of OpenCL commands.
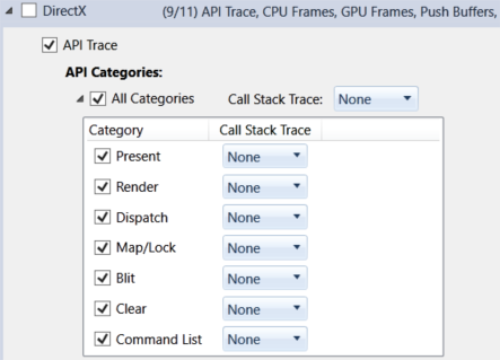
DirectX
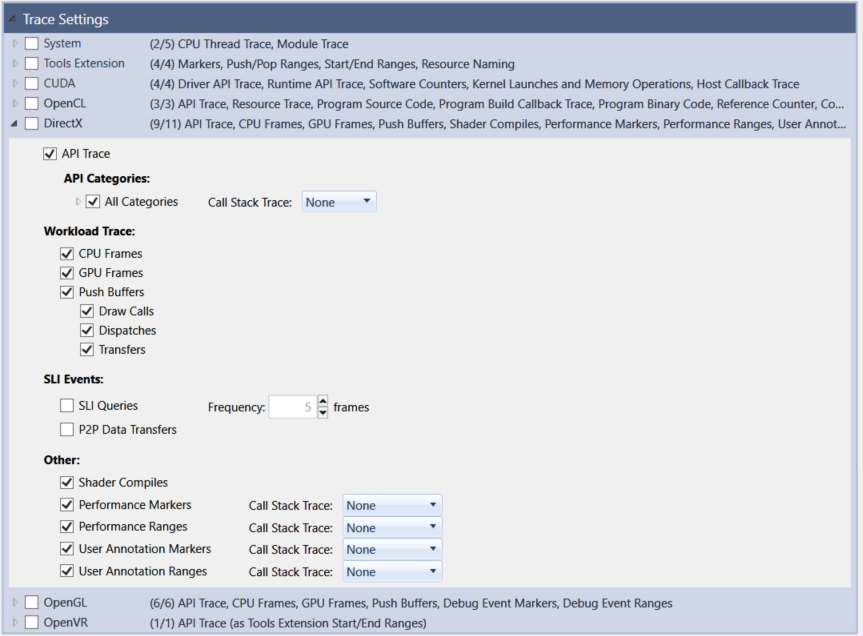
The DirectX option includes the following traces:
- API Trace — Enables tracing of DirectX API calls. If you select this option and the API Categories sub-option, you can click the call stack trace drop-down option and select None or Always.
- Workload Trace
- CPU Frames — Enables workload tracing of DirectX CPU frames.
- GPU Frames — Enables workload tracing of DirectX GPU frames.
- Push Buffers — Enables tracing of DirectX push buffers.
- Draw Calls — Enables workload tracing of DirectX draw calls.
- Dispatches — Enables workload tracing of DirectX dispatches.
- Transfers — Enables workload tracing of DirectX transfers.
- SLI Events
- SLI Queries — Enables collection of statistics about the usage of DirectX queries.
- P2P Data Transfers — Enables tracing of DirectX data transfers across multiple GPUs.
- Other
- Shader Compiles — Enables tracing of DirectX shader compile times.
- Performance Markers — Enables tracing of DirectX performance markers.The call stack trace data option here can be set to None or Always.
- Performance Ranges — Enables tracing of DirectX performance ranges.The call stack trace data option here can be set to None, Always, On Begin, or On End.
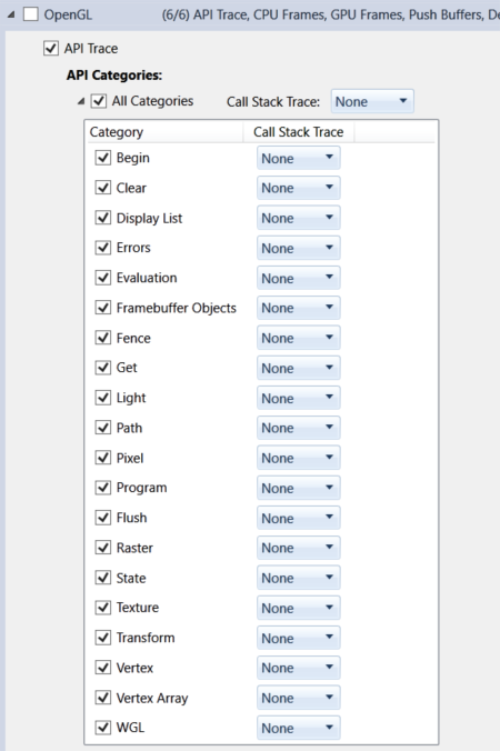
OpenGL
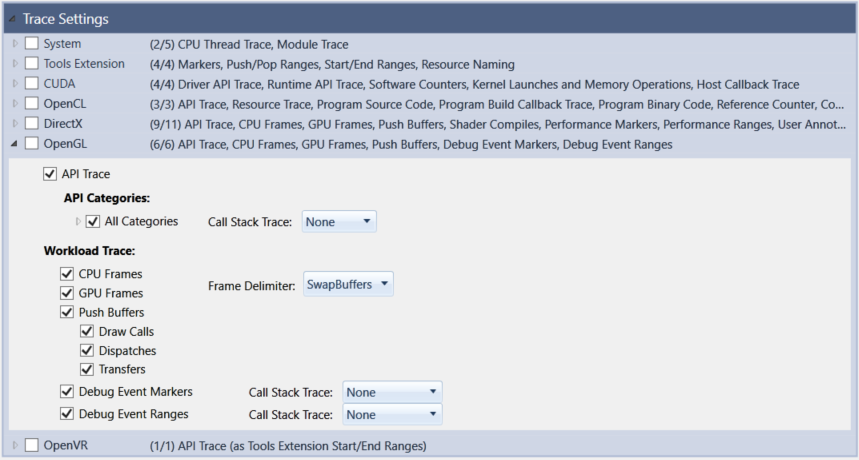
The OpenGL option includes the following traces:
- API Trace — If you select this option and the API Categories sub-option, you can click the call stack trace drop-down option and select None or Always.
- Workload Trace
- CPU Frames — Enables workload tracing of OpenGL CPU frames.
- GPU Frames — Enables workload tracing of OpenGL GPU frames.
- Push buffers — Enables tracing of OpenGL push buffers.
- Draw Calls — Enables workload tracing of OpenGL draw calls.
- Transfers — Enables workload tracing of OpenGL transfers.
OpenVR
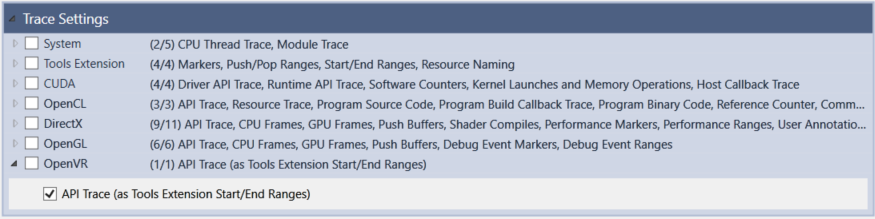
The OpenVR option enables the tracing of OpenVR API calls.

NVIDIA® Nsight™ Application Development Environment for Heterogeneous Platforms, Visual Studio Edition User Guide Rev. 5.3.170616 ©2009-2017. NVIDIA Corporation. All Rights Reserved.
Open topic with navigation