NVIDIA® Nsight™ Application Development Environment for Heterogeneous Platforms, Visual Studio Edition 5.3 User Guide
Send Feedback
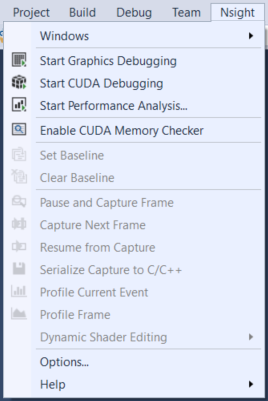
In NVIDIA® Nsight™ Visual Studio Edition, the host is the term for the computer that is running Visual Studio, where your application is being built and debugged. After you install NVIDIA Nsight on your computer, you will see a new menu called Nsight on your Visual Studio taskbar.
Feel free to explore the various options on this menu. The items that are critical for debugging will be discussed in further detail in later topics.
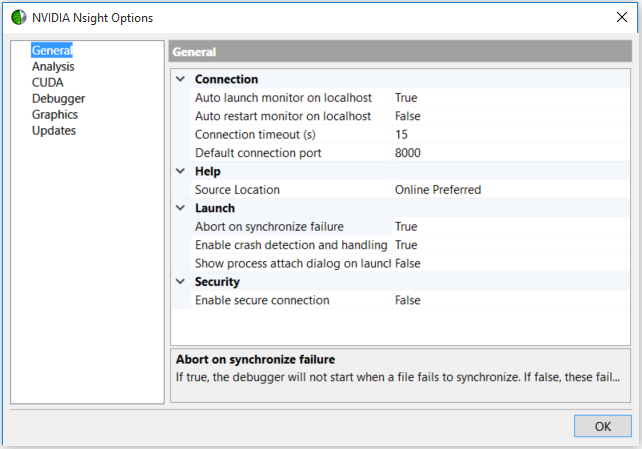
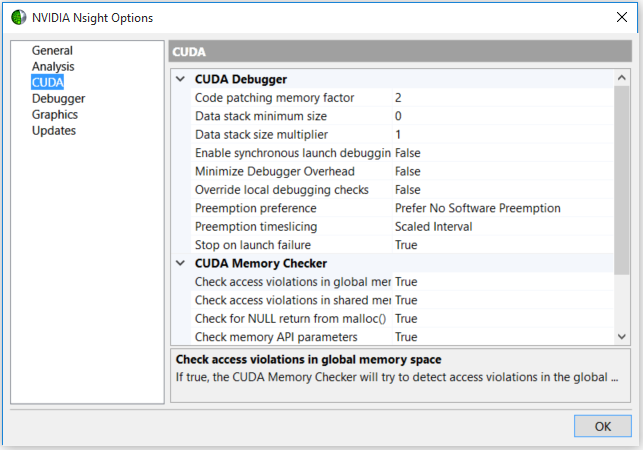
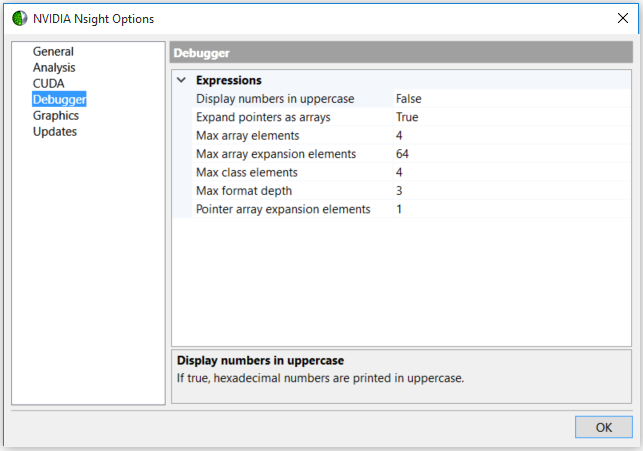
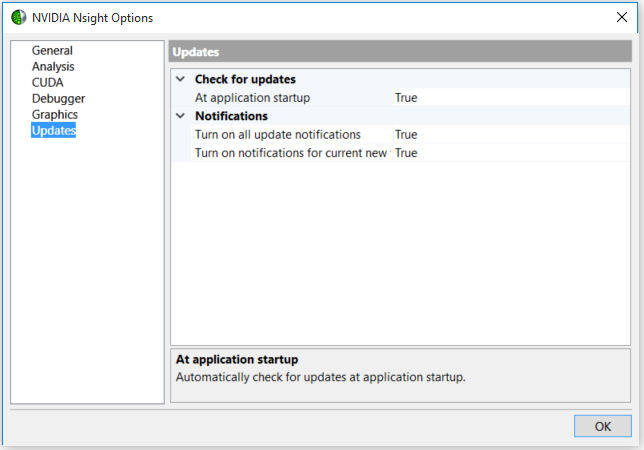
After installing NVIDIA Nsight on the host machine, open Visual Studio and go to Nsight > Options to configure your settings.
Note that the default port setting is 8000. The port number on both the host and target machines must match in order for a successful connection to occur. (See Target Basics for more information.)
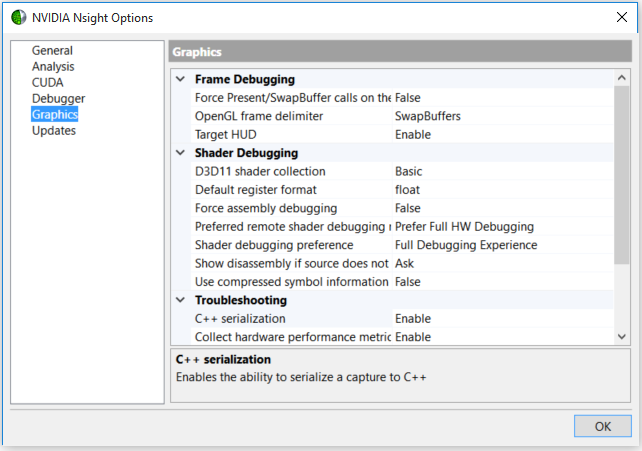
Frame Debugging
- Force Present/SwapBuffer calls on the target to repaint the window — If this option has been set to True, the frame replay will automatically invalidate the window of the target application for every Present/SwapBuffer call.
- Frame Profiler Enable — This setting sets the Frame Profiler options for the application you are debugging. There are 3 settings available:
- Auto — Enables the Frame Debugger for APIs that support it, and disables the feature for those that don't (for example, Direct3D 12 applications). This is the default setting.
- Enable — Attempts to enable the Frame Profiler for all APIs, and may result in device or context creation failure for unsupported APIs.
- Disable — Disables the Frame Profiler for all APIs.
Shader Debugging:
- D3D11 Shader Collection — This option provides the most thorough collection of D3D11 shader characteristics, but may slow program execution. Enable this option if you are doing detailed shader analysis.
Note: this option requires the Nsight Monitor to be started with administrator privileges.- Default Register Format — This option allows you to select the default interpretation of the raw values in general purpose assembly registers. If set to float, register components will be shown as float in the Watch window, and also interpreted as float in both breakpoint conditions and expressions. If set to int, the same register components will be shown as signed integers, and also used as such in both breakpoint conditions and expressions. It is also possible to control the interpretation of register data on a per-register basis, using the
$f,$i, and$uipostfixes. For example,r5$uiis the interpretation ofr5as auint4vector.- Force Assembly Debugging — This option is only available when debugging a Direct3D application. If set to true, the shader debugger will fall back to assembly debugging, even if source debug information is available.
- Preferred remote shader debugging mode — With this option, you can choose whether to prefer full hardware debugging or replay-based debugging on remote targets. When a breakpoint is hit, replay-based debugging frees the GPU to draw the desktop or run other application code. Full hardware debugging halts the GPU when a breakpoint is hit; no other tasks may run, but the debugger may run faster and may provide deeper insight of the hardware state.
- Shader debugging preference — This option selects how heavily shaders will be instrumented for debugging. The options available are:
- Full Debugging Experience — Supports all features, but may result in slow debugging speed.
- Limited Debugging Experience — May provide better debugging speed at the cost of not reporting information about sympathetic shader threads.
- Minimal Debugging Experience — The fastest setting, but also has the most restrictions. No information about sympathetic shader threads will be reported, and breakpoints set in other shaders while already debugging a shader may not be hit before a completely resume. Also, no render target, geometry, or compute buffer previews will be available in the Graphics Focus Picker.
- Disabled — Completely disables all shader debugging features, including pixel history.
- Show disassembly if source does not exist — With this option, if no source can be found for the given shader, then disassembly will be shown instead. You can choose one of three options here: Ask, Always show, or Never show.
- Use compressed symbol information — Using compressed symbol information reduces the memory used by the Nsight Monitor, but can slow down debugging performance.
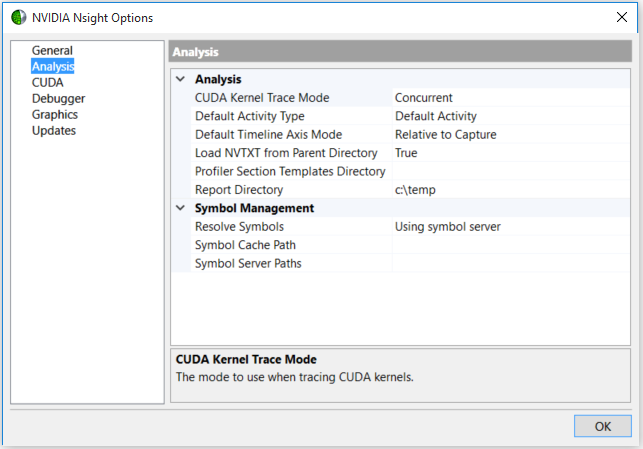
Troubleshooting:
- C++ serialization — Enables the ability to serialize a capture to C++.
- Collect hardware performance metrics — Enables the collection of performance metrics from the hardware.
- Collect native shaders — Enables the fetch of hardware native shaders which can be used to collect shader performance stats.
- Collect shader disassembly — Controls whether NVIDIA Nsight collects shader disassembly for viewing in the shaders list.
- Driver instrumentation — Enables the capabilities that require driver support.
- Frame capture threading — Controls whether the capture proceeds with concurrent threads or serialized threads.
Click OK when you are finished configuring your options for NVIDIA Nsight.
After NVIDIA Nsight has been installed on the host machine, it will need to be configured. To do this:
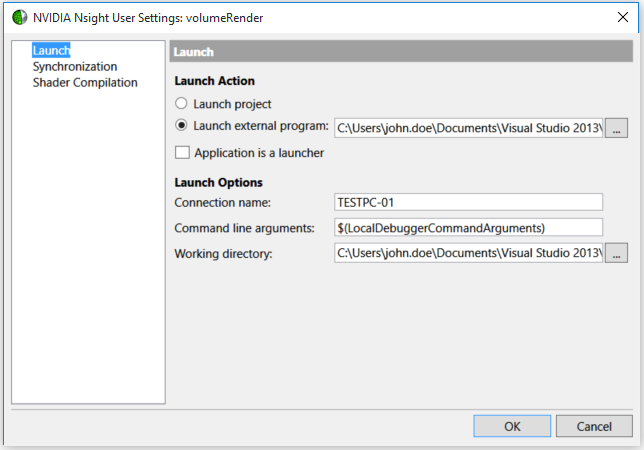
On the default Launch page, you configure the appropriate actions and options to be used when you begin debugging your project.
The Connection name field can be the IP address of the machine on your local network, or the machine name as recognized on your network (see Recommended IP Address Formatting for more information).
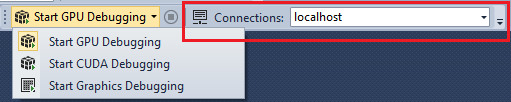
Note that you can also opt to use the Nsight Connections toolbar to specify the address of the computer that should be used for running the target application.
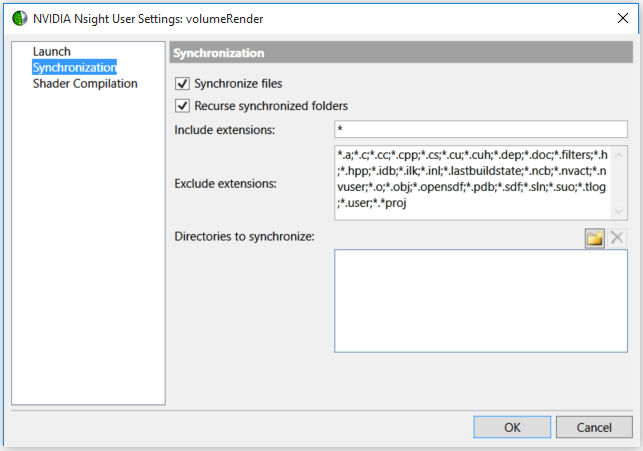
From here, you can choose which file extensions to include or exclude for synchronization purposes.
If you're debugging a large application, you'll want to turn off synchronization to prevent performance problems.
 | When using file synchronization, all file paths are relative to localhost.
When file synchronization is turned off, the file path is relative to the target machine (which could be localhost as well, depending on your settings.) |
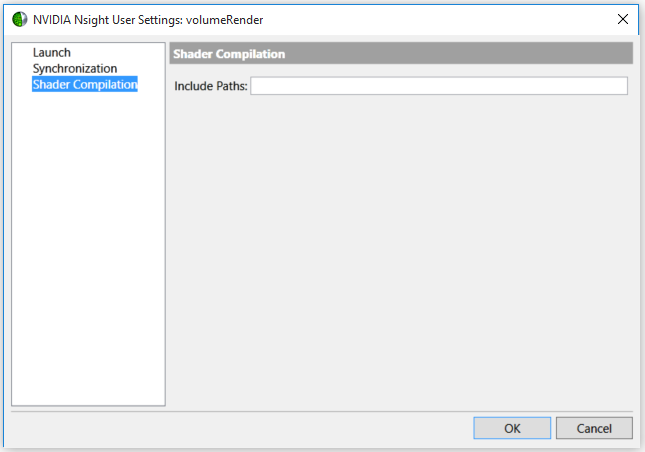
This page allows you to specify include paths for compiling the shaders in your application.
| IPv6 | IPv6 addresses should be formatted according to the IEFF RFC 5952 specification. | Examples: |
| IPv6 addresses without port specification uses colons as group delimiters or optional square brackets. | 2001:cb8:3:16d3:131:98a2:370f:7324 Or [2001:cb8:3:16d3:131:98a2:370f:7324] | |
| IPv6 with port specification requires square brackets surrounding the address so the following colon is recognized as a port delimiter. | [2001:cb8:3:16d3:131:98a2:370f:7324]:443 | |
| IPv4 | IPv4 addresses should be formatted according to the IETF RFC 791. | Examples: |
| IPv4 addresses without port specification use decimals as group delimiters | 169.244.0.23 | |
| IPv4 addresses without port specification use a colon as the port delimiter | 169.244.0.23:443 | |
| DNS | The trusted machine's address can also be specified as a DNS address or hostname. | Examples: |
| Addresses may be specified without a port. | Computer.domain.com localhost | |
| Addresses may be specified with a port. | Computer.domain.com:443 |
Note that specifying the port in the address overrides the default port.
There are multiple places that the target machine can be specified. The order of preference is as follows:
localhost.

NVIDIA® Nsight™ Application Development Environment for Heterogeneous Platforms, Visual Studio Edition User Guide Rev. 5.3.170616 ©2009-2017. NVIDIA Corporation. All Rights Reserved.