RAPIDS and Alluxio#
The RAPIDS Accelerator can remarkably accelerate the computing part of a SQL query by leveraging GPUs, but it’s hard to accelerate the data reading process when the data is in a cloud filesystem because of network overhead.
Alluxio is an open source data orchestration platform that brings your data closer to compute across clusters, regions, clouds, and countries for reducing the network overhead. Compute applications talking to Alluxio can transparently cache frequently accessed data from multiple sources, especially from remote locations.
This guide will go through how to set up the RAPIDS Accelerator for Apache Spark with Alluxio in an on-prem cluster. This guide sets up Alluxio to handle reads and by default does not handle file updates in the remote blob store.
Prerequisites#
This guide assumes the user has successfully setup and run the RAPIDS Accelerator in an on-prem cluster according to this doc.
This guide will go through deployment of Alluxio in a Yarn cluster with 2 NodeManagers and 1 ResourceManager, It will describe how to configure an S3 compatible filesystem as Alluxio’s underlying storage system.
We may want to put the Alluxio workers on the NodeManagers so they are on the same nodes as the Spark tasks will run. The Alluxio master can go anywhere, we pick ResourceManager for convenience.
Let’s assume the hostnames are:
1 RM_hostname
2 NM_hostname_1
3 NM_hostname_2
Alluxio setup#
Prerequisites
Download Alluxio binary file
Download the latest Alluxio binary file alluxio-${LATEST}-bin.tar.gz from this site.
Copy
alluxio-${LATEST}-bin.tar.gzto NodeManagers and ResourceManagerExtract
alluxio-${LATEST}-bin.tar.gzto the directory specified by ALLUXIO_HOME in the NodeManagers and ResourceManager1 # Let's assume we extract alluxio to /opt 2 mkdir -p /opt 3 tar xvf alluxio-${LATEST}-bin.tar.gz -C /opt 4 export ALLUXIO_HOME=/opt/alluxio-${LATEST}
For SSH login wihtout password and Alluxio ports problem, please refer to this site.
Configure Alluxio
Alluxio master configuration
On the master node, create
${ALLUXIO_HOME}/conf/alluxio-site.propertiesconfiguration file from the template.cp ${ALLUXIO_HOME}/conf/alluxio-site.properties.template ${ALLUXIO_HOME}/conf/alluxio-site.propertiesAdd the recommended configuration below to
${ALLUXIO_HOME}/conf/alluxio-site.properties.1 # set the hostname of the single master node 2 alluxio.master.hostname=RM_hostname 3 4 ########################### worker properties ############################## 5 # The maximum number of storage tiers in Alluxio. Currently, Alluxio supports 1, 6 # 2, or 3 tiers. 7 alluxio.worker.tieredstore.levels=1 8 9 # The alias of top storage tier 0. Currently, there are 3 aliases, MEM, SSD, and HDD. 10 alluxio.worker.tieredstore.level0.alias=SSD 11 12 # The paths of storage directories in top storage tier 0, delimited by comma. 13 # It is suggested to have one storage directory per hardware device for the 14 # SSD and HDD tiers. You need to create YOUR_CACHE_DIR first, 15 # For example, 16 # export YOUR_CACHE_DIR=/opt/alluxio/cache 17 # mkdir -p $YOUR_CACHE_DIR 18 alluxio.worker.tieredstore.level0.dirs.path=/YOUR_CACHE_DIR 19 20 # The quotas for all storage directories in top storage tier 0 21 # For example, set the quota to 100G. 22 alluxio.worker.tieredstore.level0.dirs.quota=100G 23 24 # The path to the domain socket. Short-circuit reads make use of a UNIX domain 25 # socket when this is set (non-empty). This is a special path in the file system 26 # that allows the client and the AlluxioWorker to communicate. You will need to 27 # set a path to this socket. The AlluxioWorker needs to be able to create the 28 # path. If alluxio.worker.data.server.domain.socket.as.uuid is set, the path 29 # should be the home directory for the domain socket. The full path for the domain 30 # socket with be {path}/{uuid}. 31 # For example, 32 # export YOUR_DOMAIN_SOCKET_PATH=/opt/alluxio/domain_socket 33 # mkdir -p YOUR_DOMAIN_SOCKET_PATH 34 alluxio.worker.data.server.domain.socket.address=/YOUR_DOMAIN_SOCKET_PATH 35 alluxio.worker.data.server.domain.socket.as.uuid=true 36 37 # Configure async cache manager 38 # When large amounts of data are expected to be asynchronously cached concurrently, 39 # it may be helpful to increase below async cache configuration to handle a higher 40 # workload. 41 42 # The number of asynchronous threads used to finish reading partial blocks. 43 alluxio.worker.network.async.cache.manager.threads.max=64 44 45 # The maximum number of outstanding async caching requests to cache blocks in each 46 # data server. 47 alluxio.worker.network.async.cache.manager.queue.max=2000 48 ############################################################################ 49 50 ########################### Client properties ############################## 51 # When short circuit and domain socket both enabled, prefer to use short circuit. 52 alluxio.user.short.circuit.preferred=true 53 ############################################################################ 54 55 # Running Alluxio locally with S3 56 # Optionally, to reduce data latency or visit resources which are separated in 57 # different AWS regions, specify a regional endpoint to make AWS requests. 58 # An endpoint is a URL that is the entry point for a web service. 59 # 60 # For example, s3.cn-north-1.amazonaws.com.cn is an entry point for the Amazon S3 61 # service in beijing region. 62 alluxio.underfs.s3.endpoint=<endpoint_url> 63 64 # Optionally, specify to make all S3 requests path style 65 alluxio.underfs.s3.disable.dns.buckets=true
For more explanations of each configuration, please refer to Alluxio Configuration and Amazon AWS S3.
Note
When preparing to mount S3 compatible file system to the root of Alluxio namespace, the user needs to add below AWS credentials configuration to
${ALLUXIO_HOME}/conf/alluxio-site.propertiesin Alluxio master node.1alluxio.master.mount.table.root.ufs=s3a://<S3_BUCKET>/<S3_DIRECTORY> 2alluxio.master.mount.table.root.option.aws.accessKeyId=<AWS_ACCESS_KEY_ID> 3alluxio.master.mount.table.root.option.aws.secretKey=<AWS_SECRET_ACCESS_KEY>
Instead, this guide demonstrates how to mount the S3 compatible file system with AWS credentials to any path of Alluxio namespace, and please refer to RAPIDS Configuration. For more explanations of AWS S3 credentials, please refer to Amazon AWS S3 Credentials setup.
Note
This guide demonstrates how to deploy Alluxio cluster in a insecure way, for the Alluxio security, please refer to this site
Add Alluxio worker hostnames into
${ALLUXIO_HOME}/conf/workers1NM_hostname_1 2NM_hostname_2
Copy configuration from Alluxio master to Alluxio workers
${ALLUXIO_HOME}/bin/alluxio copyDir ${ALLUXIO_HOME}/conf
This command will copy the
conf/directory to all the workers specified in theconf/workersfile. Once this command succeeds, all the Alluxio nodes will be correctly configured.
Alluxio worker configuration
After copying configuration to every Alluxio worker from Alluxio master, User needs to add below extra configuration for each Alluxio worker.
1# the hostname of Alluxio worker
2alluxio.worker.hostname=NM_hostname_X
3# The hostname to use for an Alluxio client
4alluxio.user.hostname=NM_hostname_X
Note that Alluxio can manage other storage media (e.g. MEM, HDD) in addition to SSD, so local data access speed may vary depending on the local storage media. To learn more about this topic, please refer to the tiered storage document.
Create a link to ALLUXIO_HOME
Execute the following commands to create a link
/opt/alluxioto actual Alluxio Home path:ln -s ${ALLUXIO_HOME} /opt/alluxio``
Start Alluxio cluster
Format Alluxio
Before Alluxio can be started for the first time, the journal must be formatted. Formatting the journal will delete all metadata from Alluxio. However, the data in under storage will be untouched.
Format the journal for the Alluxio master node with the following command:
${ALLUXIO_HOME}/bin/alluxio formatMasters
Launch Alluxio
On the master node, start the Alluxio cluster with the following command:
${ALLUXIO_HOME}/bin/alluxio-start.sh all
Verify Alluxio
To verify that Alluxio is running, visit
http://RM_hostname:19999to see the status page of the Alluxio master.
Mount an existing data storage to Alluxio
Mount S3 bucket
1${ALLUXIO_HOME}/bin/alluxio fs mount \
2    --option aws.accessKeyId=<AWS_ACCESS_KEY_ID> \
3    --option aws.secretKey=<AWS_SECRET_KEY_ID> \
4    alluxio://RM_hostname:19998/s3 s3a://<S3_BUCKET>/<S3_DIRECTORY>
Mount Azure directory
1${ALLUXIO_HOME}/bin/alluxio fs mount \
2--option fs.azure.account.key.<AZURE_ACCOUNT>.blob.core.windows.net=<AZURE_ACCESS_KEY> \
3alluxio://master:port/azure wasb://<AZURE_CONTAINER>@<AZURE_ACCOUNT>.blob.core.windows.net/<AZURE_DIRECTORY>/
For other filesystems, please refer to this site. We also provide auto mount feature for an easier usage. Please refer to Alluxio auto mount for AWS S3 buckets
RAPIDS Configuration#
There are two ways to leverage Alluxio in RAPIDS. We also provide an auto mount way for AWS S3 bucket if you install Alluxio in your Spark cluster. Please refer to Alluxio auto mount for AWS S3 buckets
Explicitly specify the Alluxio path
This may require user to change code. For example, change
val df = spark.read.parquet("s3a://<S3_BUCKET>/<S3_DIRECTORY>/foo.parquet")
to
val df = spark.read.parquet("alluxio://RM_hostname:19998/s3/foo.parquet")
Transparently replace in RAPIDS
RAPIDS has added a configuration
spark.rapids.alluxio.pathsToReplacewhich can allow RAPIDS to replace the input file paths to the Alluxio paths transparently at runtime. So there is no code change for users.Eg, at startup
--conf spark.rapids.alluxio.pathsToReplace="s3://foo->alluxio://RM_hostname:19998/foo,gs://bar->alluxio://RM_hostname:19998/bar"
This configuration allows RAPIDS to replace any file paths prefixed
s3://foowithalluxio://RM_hostname:19998/fooandgs://barwithalluxio://RM_hostname:19998/bar.Note, one side affect of using Alluxio in this way results in the sql function ``input_file_name`` printing the
alluxio://path rather than the original path. Below is an example of using input_file_name.1spark.read.parquet(data_path) 2 .filter(f.col('a') > 0) 3 .selectExpr('a', 'input_file_name()', 'input_file_block_start()', 'input_file_block_length()')
Submit an application
Spark driver and tasks will parse
alluxio://schema and access Alluxio cluster usingalluxio-${LATEST}-client.jar.The Alluxio client jar must be in the classpath of all Spark drivers and executors in order for Spark applications to access Alluxio.
We can specify it in the configuration of
spark.driver.extraClassPathandspark.executor.extraClassPath, but the Alluxio client jar should be present on the Yarn nodes.The other simplest way is copy
alluxio-${LATEST}-client.jarinto spark jars directory.cp ${ALLUXIO_HOME}/client/alluxio-${LATEST}-client.jar ${SPARK_HOME}/jars/
1${SPARK_HOME}/bin/spark-submit \
2   ...                          \
3   --conf spark.rapids.alluxio.pathsToReplace="REPLACEMENT_RULES" \
4   --conf spark.executor.extraJavaOptions="-Dalluxio.conf.dir=${ALLUXIO_HOME}/conf" \
Alluxio auto mount for AWS S3 buckets#
There’s a more user-friendly way to use Alluxio with RAPIDS when accessing S3 buckets. Suppose that a user has multiple buckets on AWS S3. To use spark.rapids.alluxio.pathsToReplace requires to mount all the buckets beforehand and put the path replacement one by one into this config. It’ll be boring when there’re many buckets.
To solve this problem, we add a new feature of Alluxio auto mount, which can mount the S3 buckets automatically when finding them from the input path in the Spark driver. This feature requires the node running Spark driver has Alluxio installed, which means the node is also the master of Alluxio cluster. It will use alluxio fs mount command to mount the buckets in Alluxio. And the uid used to run the Spark application can run Alluxio command. For example, the uid of Spark application is as same as the uid of Alluxio service or the uid of Spark application can use su alluxio_uid to run Alluxio command.
To enable the Alluxio auto mount feature, the simplest way is only to enable it by below config without setting spark.rapids.alluxio.pathsToReplace, which takes precedence over auto mount feature.
--conf spark.rapids.alluxio.automount.enabled=true
Additional configs:
--conf spark.rapids.alluxio.bucket.regex="^s3a{0,1}://.*"
The regex is used to match the s3 URI, to decide which bucket we should auto mount. The default value is to match all the URIs which start with s3:// or s3a://. For exmaple, ^s3a{1,1}://foo.* will match the buckets which start with foo.
Configure whether the disks used by Alluxio are fast#
The default value of config spark.rapids.alluxio.slow.disk is true, indicating the disks used by Alluxio are slow. The true value enables an improvement which reads from S3 directly to get better performance when the files being read are large. The config spark.rapids.alluxio.large.file.threshold, which defaults to 64MB, controls the file size threshold used to trigger this improvement. If the disks are fast, this feature should be disabled by setting it to false as it will be faster to read from Alluxio. Typically, if speed of the disks is bigger than 300M/second, set it as false.
Alluxio Troubleshooting#
This section will give some links about how to configure, tune Alluxio and some troubleshooting.
Alluxio reliability#
The properties mentioned in this section can be found in Alluxio configuration
Dealing with Client side delays in response from master or workers#
If the master is not responding, possibly due to it crashing or GC pause, alluxio.user.rpc.retry.max.duration will cause the client to retry for 2 minutes. This is a very long time and can cause delays in the running job, so we suggest lowering this value to 10 seconds.
If the worker is not responding, possibly due to it crashing or GC pause, alluxio.user.block.read.retry.max.duration will cause the client to retry for 5 minutes. This is a very long time and can cause delays in the running job, so we suggest lowering this value to 1 minute.
See relative configs also:
1alluxio.user.rpc.retry.max.duration
2alluxio.user.rpc.retry.max.sleep
3alluxio.user.rpc.retry.base.sleep
4
5alluxio.user.block.read.retry.max.duration
6alluxio.user.block.read.retry.sleep.max
7alluxio.user.block.read.retry.sleep.base
Above configurations define the ExponentialTimeBoundedRetry retry policies and max durations, we can adjust them to appropriate values.
Set these properties on Spark because Spark invokes Alluxio client.
1$SPARK_HOME/bin/spark-shell \
2......
3--conf spark.driver.extraJavaOptions='-Dalluxio.user.rpc.retry.max.duration=10sec -Dalluxio.user.block.read.retry.max.duration=1min' \
4--conf spark.executor.extraJavaOptions='-Dalluxio.user.rpc.retry.max.duration=10sec -Dalluxio.user.block.read.retry.max.duration=1min' \
5......
Worker server tunings to fail fast#
By default, alluxio.master.worker.timeout is 5min, this is the timeout between master and worker indicating a lost worker. If the worker holding cache is killed but the elapsed time does not exceed the timeout, the master still marks the worker as alive. The client will connect this dead worker to pull data, and will fail. If the worker holding cache is killed and the elapsed time exceeds the timeout, the master marks the worker as lost. In this case, if cluster has one alive worker, the client will query an alive worker and the alive worker will pull data from external file system if it is not holding the requested cache.
To avoid failures when master marking an actual dead worker as alive, set the timeout to a reasonable value, like 1 minute. vi $ALLUXIO_HOME/conf/alluxio-site.properties
alluxio.master.worker.timeout=60sec
The logs#
By default, the log path is /logs. See the master.log and worker.log in this path.
Auto start Alluxio the master and workers#
After installing Alluxio master and workers, it’s better to add a systemd service for each process of master and workers. Systemd service can automatically restart a process if that process is terminated.
Alluxio limitations#
Alluxio does not sync metadata from UFS(e.g. S3) by default#
Alluxio does not sync metadata from S3 by default, so it won’t pick up any changed files.
For example:
If you update a file in the S3 from 1M size to 10M size and Alluxio already cached the 1M size file, Alluxio cluster will always use the 1M file. If you want to enable sync it has performance impact which will affect the read performance.
For details, please search alluxio.user.file.metadata.sync.interval in Alluxio doc.
Alluxio metrics#
The following sections describes 3 methods to view Alluxio metrics GUI:
Monitor Alluxio live metrics based on Alluxio Master Web:
When the Alluxio cluster is running, users can monitor current metrics based on Alluxio Master Web.
Monitor Alluxio live metrics based on Grafana with Prometheus:
When the Alluxio cluster is running, users can monitor current metrics based on Grafana with Prometheus.
View Alluxio historic metrics based on Grafana with Prometheus:
When the Alluxio cluster is shutdown, users can restore the saved historic metrics and view them locally.
Monitor Alluxio live metrics based on Alluxio Master Web#
Users can view the Alluxio metrics in the Web interface of Alluxio leading master: http://:19999/metrics. For more details, please refer to section 3.1 of Alluxio doc: Master Web UI Metrics The Alluxio Web UI is not available by default on Databricks, the following provides a method to view the Web UI by SSH tunnel via jump server. First forward the Alluxio port 19999 to a new port on a jump server, then forward the new port on the jump server to a local port, finally access the local port in the browser. For example:
Forward the Alluxio server 19999 port to the port 29999 on jump server.
ssh user@jump-server // login to jump server ssh -L 29999:localhost:19999 alluxio_master_user@alluxio_master_host -p 2200 -i
Forward the port 29999 on jump server to local port 39999 on your own machine.
ssh -L 39999:localhost:29999 user@jump-server
Finally open http://localhost:39999/metrics on your own machine.
Monitor Alluxio live metrics based on Grafana with Prometheus#
Config Prometheus when creating Databricks cluster#
When creating a Databricks cluster via the Docker container for Databricks, Set Environment variable ENABLE_ALLUXIO and PROMETHEUS_COPY_DATA_PATH, for example:
1ENABLE_ALLUXIO=1
2PROMETHEUS_COPY_DATA_PATH=/dbfs/user1/dblogs-prometheus
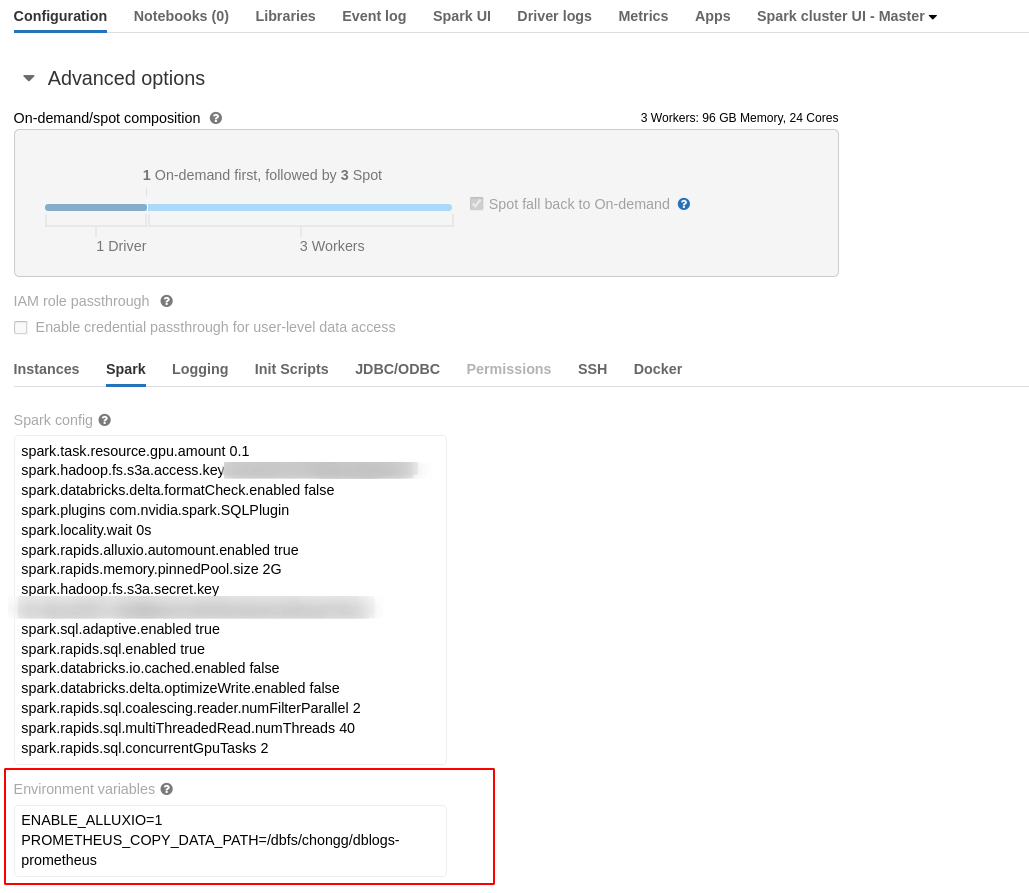
The cluster will install Prometheus, configure Prometheus to collect the metrics into its own storage, and also save Prometheus-format metrics into the path specified for back up purpose.
Note
If not set ENABLE_ALLUXIO, PROMETHEUS_COPY_DATA_PATH will not take effect.
For more details, refer to spark-rapids-Databricks-container
Install and start Grafana locally#
For example: local machine is Ubuntu.
1sudo apt-get install -y adduser libfontconfig1
2wget https://dl.grafana.com/enterprise/release/grafana-enterprise_9.2.6_amd64.deb
3sudo dpkg -i grafana-enterprise_9.2.6_amd64.deb
4sudo systemctl start grafana-server
5sudo systemctl enable grafana-server
For more details, refer to doc
Forward the Prometheus port 9090 to local port#
In order to access Prometheus-typed metrics on Databricks cluster by local Grafana, users may need to create an SSH tunnel to access the Databricks internal port.
Forward the Alluxio server 9090 port to the port 29090 on jump server.
ssh user@jump-server // login to jump server ssh -L 29090:localhost:9090 alluxio_master_user@alluxio_master_host -p 2200 -i
Forward the port 29090 on jump server to local port 39090 on your own machine.
ssh -L 39090:localhost:29090 user@jump-server
It’s similar to the tunnel method described in the previous section.
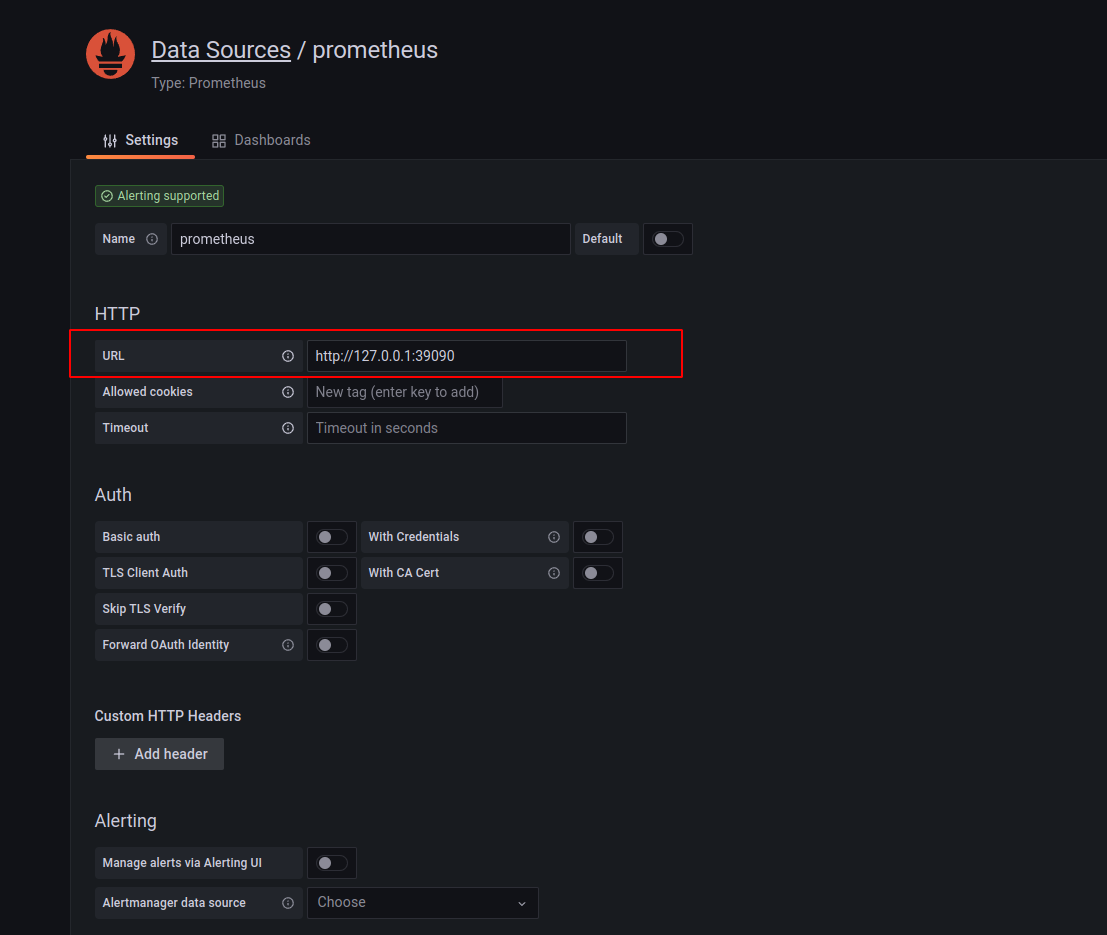
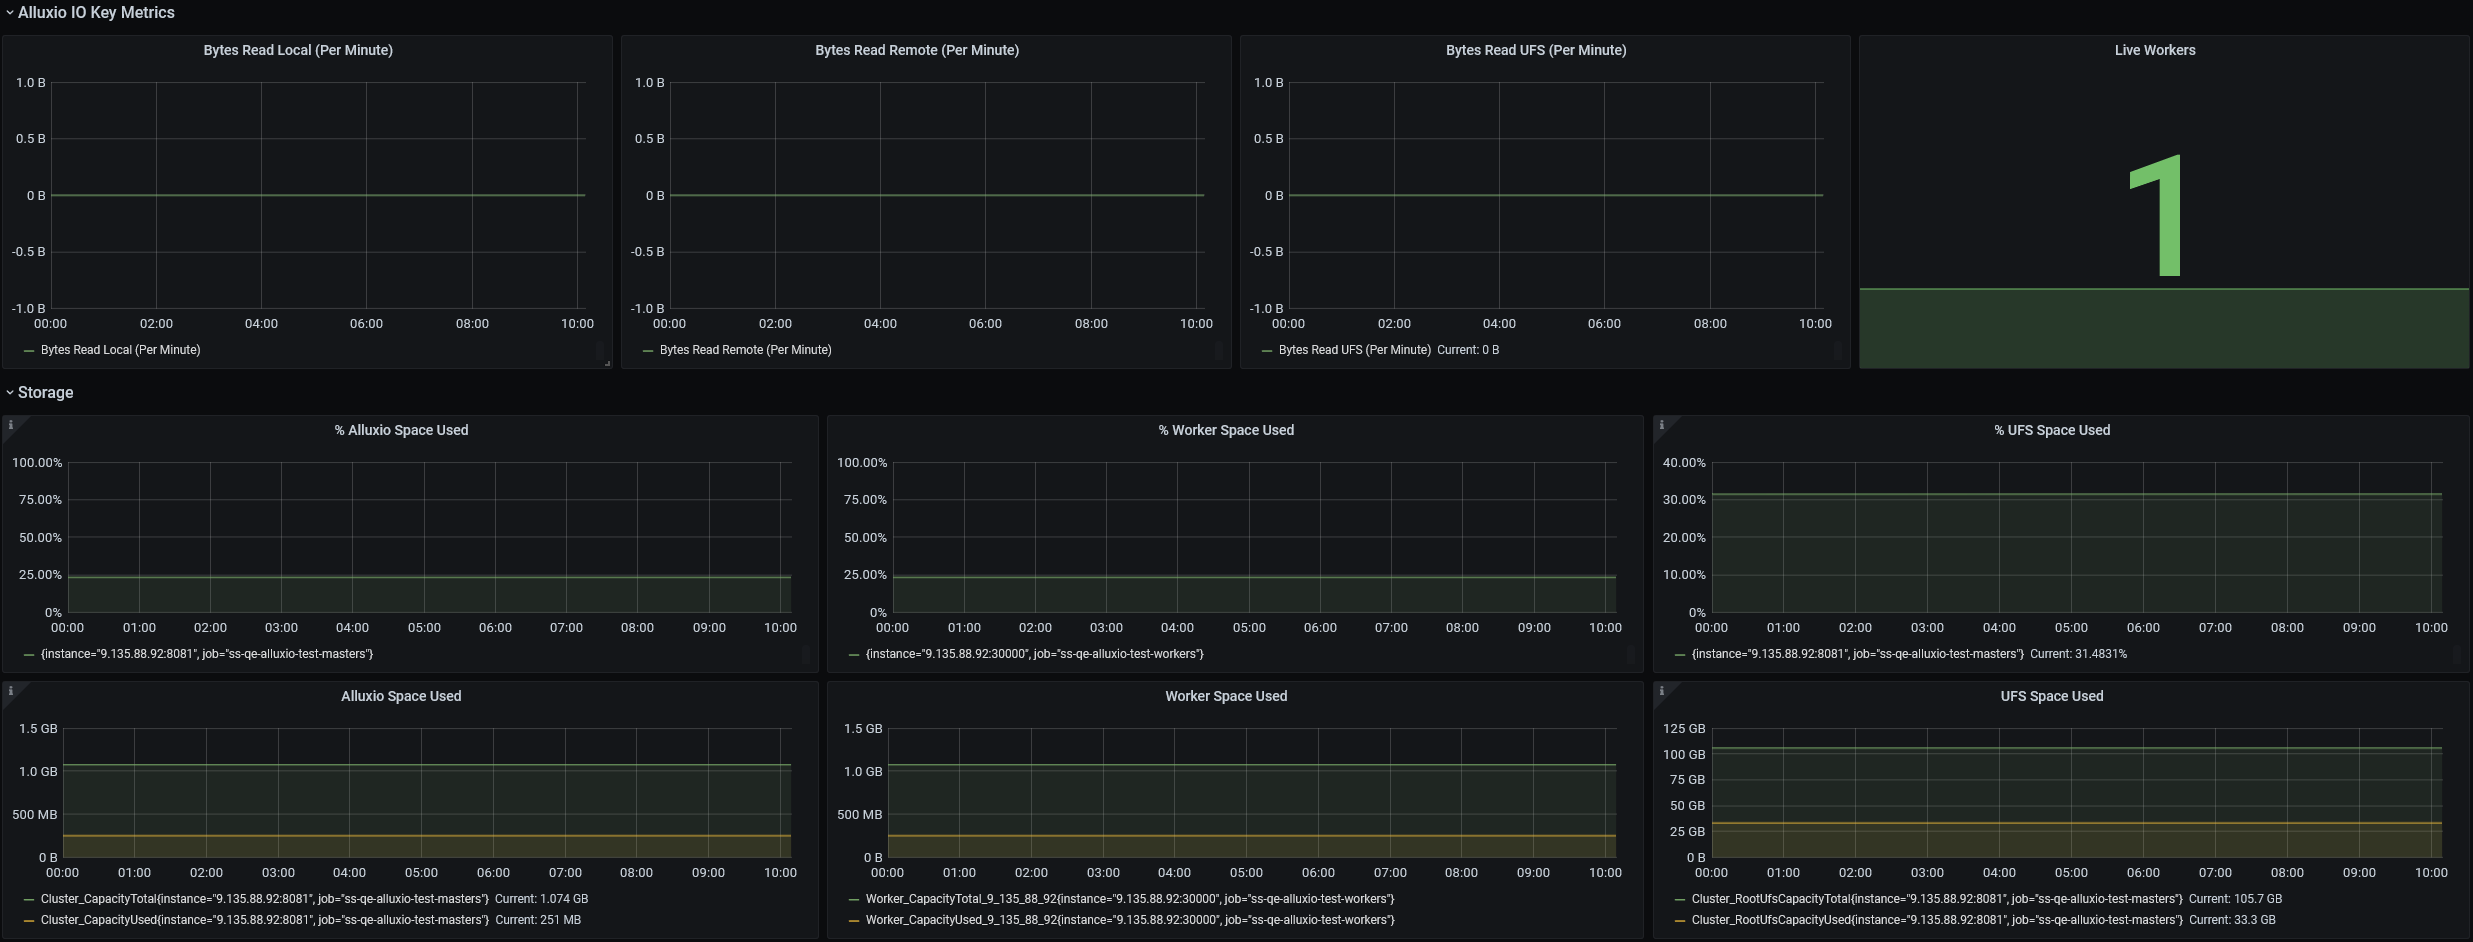
Config local Grafana to monitor the live metrics#
The main flows are:
Create a Prometheus datasource in Grafana, the URL of Prometheus datasource is: http://localhost:39090, note: the SSH tunnel port.
Refer to the tutorial for help on importing a dashboard.
Download the Grafana template JSON file for Alluxio.
Import the template JSON file to create a dashboard. See this example for importing a dashboard.
Add the Prometheus data source to Grafana.
Modify the variables in the dashboard/settings with instructions here and save your dashboard.
alluxio_datasource: Your prometheus datasource name used in step 1.
masters: Alluxio master. It’s the Master ‘job_name’ configured in prometheus.yml on Databricks cluster.
workers: Currently, it’s no use, the Databricks does not collect worker metrics.
alluxio_user: ubuntu. The user used to start up Alluxio.
For more details, refer to section 3.2 of Alluxio doc: Grafana Web UI with Prometheus
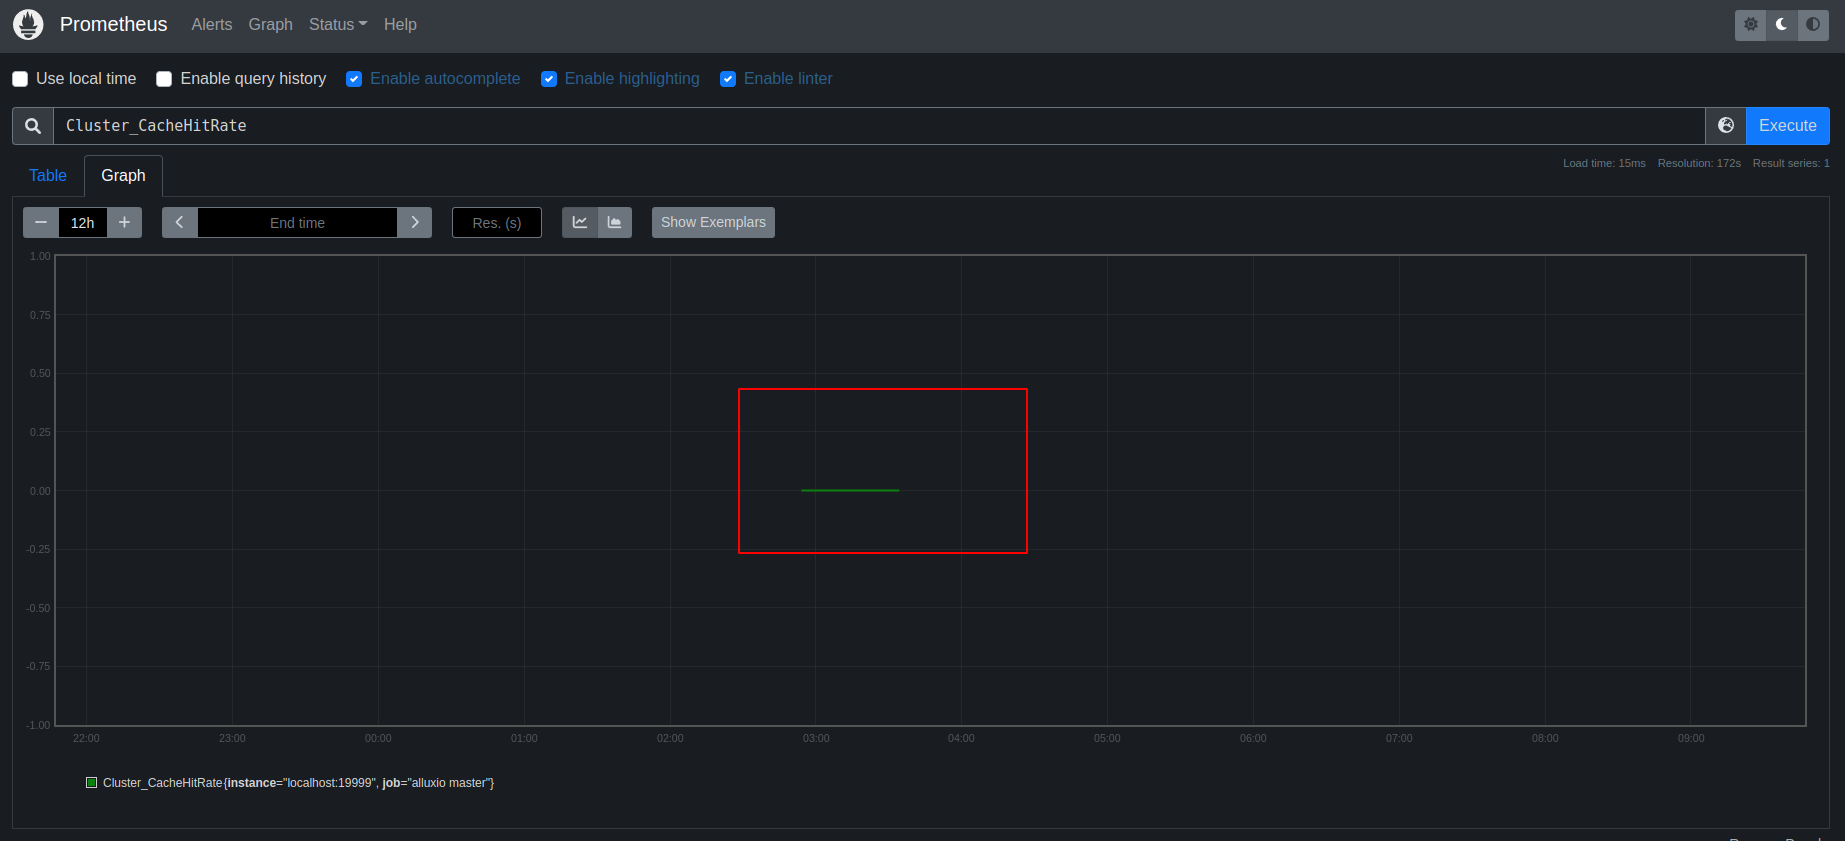
View a specific live Alluxio metrics in Prometheus Web UI#
The graph in the previous may not show all the metrics users care about, the following describes how to view a specific historic Alluxio metric as you want:
Open Prometheus Web UI: http://localhost:39090/graph
Click the
Open metrics explorerbutton.
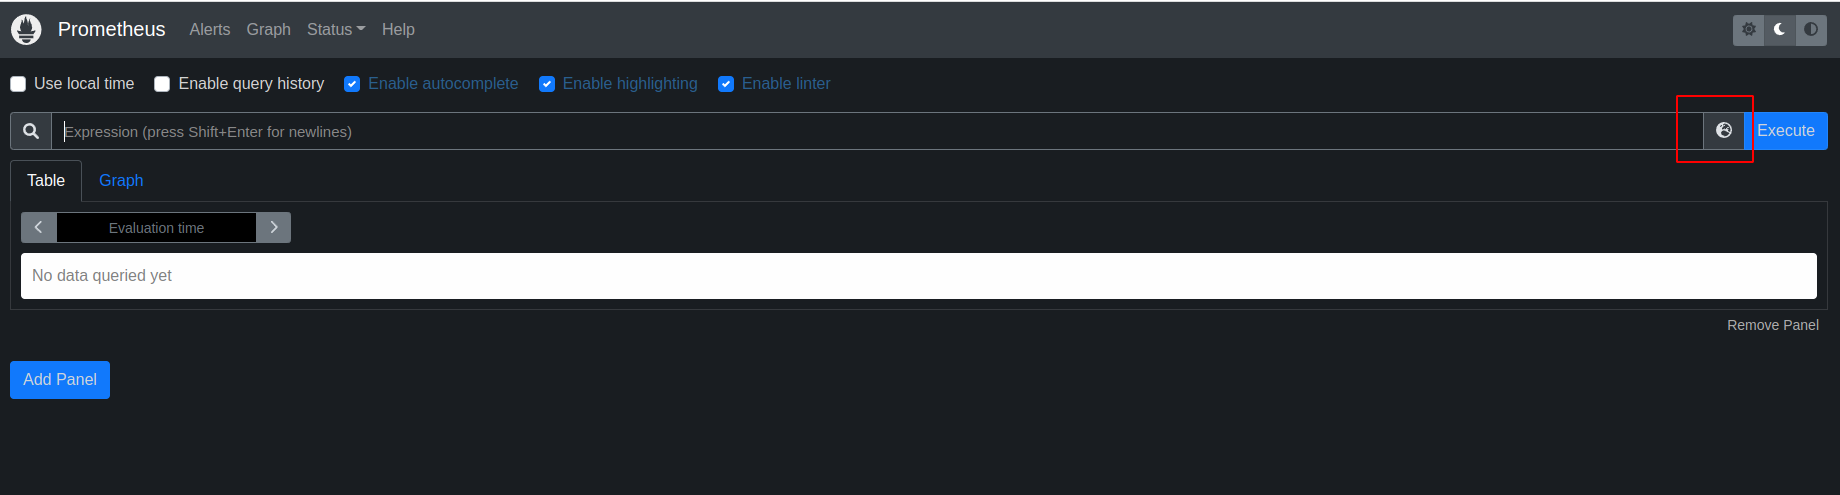
Then a list is shown:
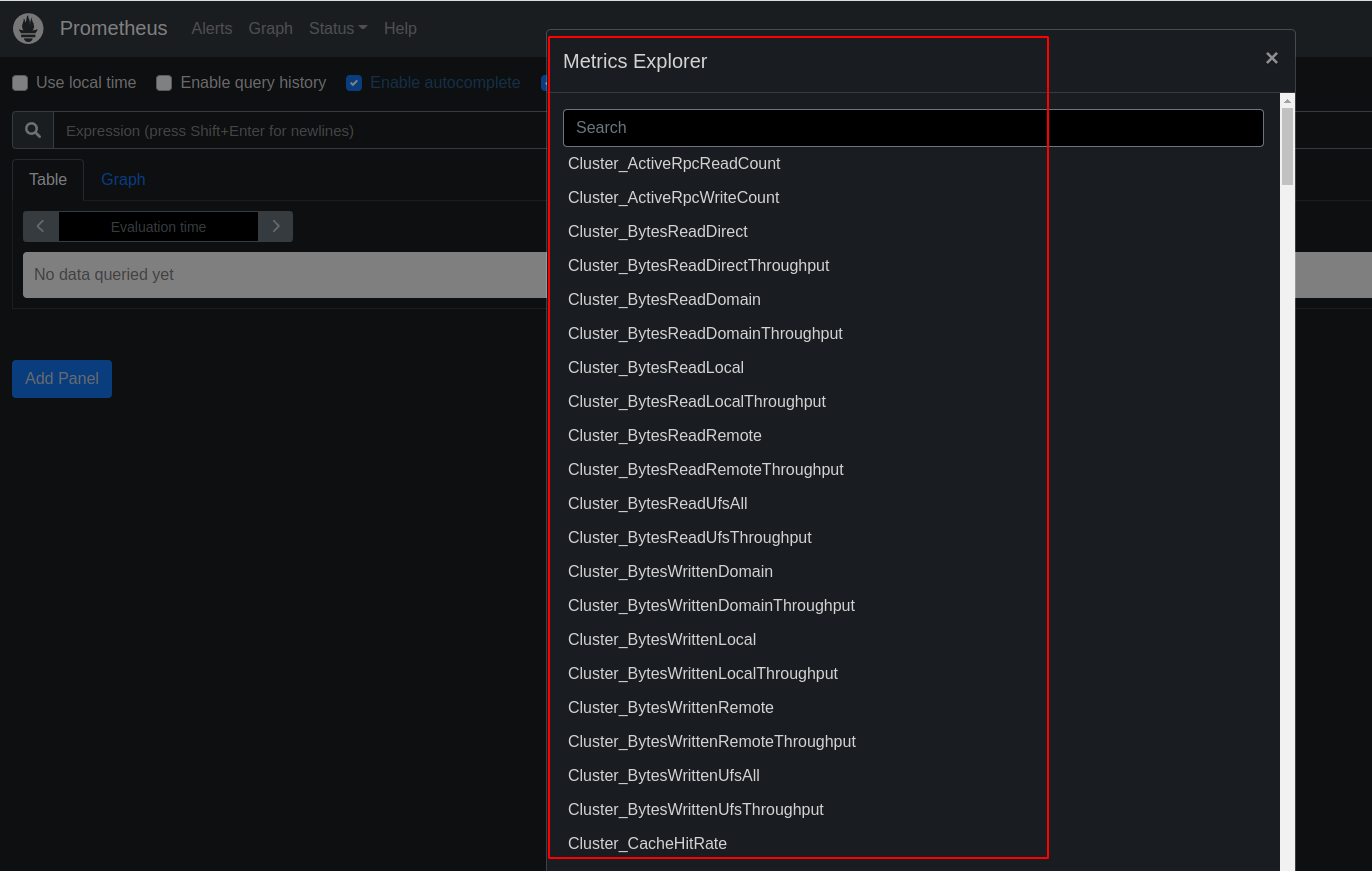
Select a metric and then click Graph Tab, then a graph is shown:
View Alluxio historic metrics based on Grafana with Prometheus#
This section is similar to the previous section
After the Databricks cluster is shutdown, the Web UI on Databricks can not be accessed again, this section describes how to view historic metrics.
The differences are:
View historic metrics when Databricks cluster is shutdown
Install and start Prometheus locally
Restore the Prometheus data into local Prometheus
The steps are as following:
Install and start Prometheus locally#
For example: local machine is Ubuntu.
1wget https://github.com/prometheus/prometheus/releases/download/v2.37.3/prometheus-2.37.3.linux-amd64.tar.gz
2tar xvfz prometheus-*.tar.gz
3cd prometheus-*
For more details, refer to doc
Restore historic metrics into Prometheus#
Copy the saved data in PROMETHEUS_COPY_DATA_PATH into Prometheus data path.
1cd <prometheus-root-dir>
2mkdir data
3# Copy the saved files into `data` directory.
4cp -r $PROMETHEUS_COPY_DATA_PATH/some/sub/path/* /path/to/prometheus-root-dir/data
5`ls /path/to/prometheus-root-dir/data` will show files like:
6`chunks_head  lock  queries.active  wal`
Start Prometheus#
1cd
2./prometheus
View Alluxio historic metrics based on Grafana#
Refer to Config local Grafana to monitor the live metrics
The difference is:
The prometheus datasource is local(http://localhost:9090) instead of the remote prometheus on Databricks cluster.
View a specific historic Alluxio metrics in Prometheus Web UI#
Refer to the section
The difference is:
The prometheus datasource is local instead of the remote prometheus on Databricks cluster.
Open Prometheus Web UI: http://localhost:9090/graph.