Feature Overview
The following sections review key DCGM features, along with examples of input and output using the DCGMI tool. Common usage scenarios and suggested best practices are included as well. Starting with v1.3, DCGM is supported on non-Tesla GPUs. The following table lists the features available on different GPU products.
| Feature Group | Support Status | |||
|---|---|---|---|---|
| Tesla | Titan | Quadro | GeForce | |
| Field Value Watches (GPU metrics) | X | X | X | X |
| Configuration Management | X | X | X | X |
| Active Health Checks (GPU subsystems) | X | X | X | X |
| Job Statistics | X | X | X | X |
| Topology | X | X | X | X |
| Introspection | X | X | X | X |
| Policy Notification | X | |||
| GPU Diagnostics (Diagnostic Levels – 1, 2, 3) | All Levels | Level 1 | Level 1 | Level 1 |
Groups
Almost all DCGM operations take place on groups. Users can create, destroy and modify collections of GPUs on the local node, using these constructs to control all subsequent DCGM activities.
Groups are intended to help the user manage collections of GPUs as a single abstract resource, usually correlated to the scheduler’s notion of a node-level job. By working in this way clients can ask question about the entire job, such as job-level health, without needing to track the individual resources.
Groups in DCGM need not be disjoint. In many cases it may make sense to maintain overlapping groups for different needs. Global groups, consisting of all GPUs in the system, are useful for node-level concepts such as global configuration or global health. Partitioned groups, consisting of only a subset of GPUs, are useful for job-level concepts such as job stats and health.
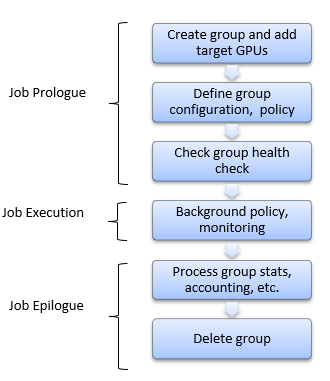
For example, a group created to manage the GPUs associated with a single job might have the following lifecycle. During prologue operations the group is created, configured, and used to verify the GPUs are ready for work. During epilogue operations the groups is used to extract target information. And while the job is running, DCGM works in the background to handle the requested behaviors.
Managing groups is very simple. Using the dcgmi group subcommand, the following example shows how to create, list and delete a group.
# dcgmi group -c GPU_Group
Successfully created group "GPU_Group" with a group ID of 1

# dcgmi group -l
1 group found.
+----------------------------------------------------------------------------+
| GROUPS                                                                     |
+============+===============================================================+
| Group ID   | 1                                                             |
| Group Name | GPU_Group                                                     |
| GPU ID(s)  | None                                                          |
+------------+---------------------------------------------------------------+

# dcgmi group -d 1
Successfully removed group 1
To add GPUs to a group it is first necessary to identify them. This can be done by first asking DCGM for all supported GPUs in the system.
# dcgmi discovery -l
2 GPUs found.
+--------+-------------------------------------------------------------------+
| GPU ID | Device Information                                                |
+========+===================================================================+
| 0      | Name: Tesla K80                                                   |
|        | PCI Bus ID: 0000:07:00.0                                          |
|        | Device UUID: GPU-000000000000000000000000000000000000             |
+--------+-------------------------------------------------------------------+
| 1      | Name: Tesla K80                                                   |
|        | PCI Bus ID: 0000:08:00.0                                          |
|        | Device UUID: GPU-111111111111111111111111111111111111             |
+--------+-------------------------------------------------------------------+

# dcgmi group -g 1 -a 0,1
Add to group operation successful.

# dcgmi group -g 1 -i
+----------------------------------------------------------------------------+
| GROUPS                                                                     |
+============+===============================================================+
| Group ID   | 1                                                             |
| Group Name | GPU_Group                                                     |
| GPU ID(s)  | 0, 1                                                          |
+------------+---------------------------------------------------------------+
Configuration
An important aspect of managing GPUs, especially in multi-node environments, is ensuring consistent configuration across workloads and across devices. In this context the term configuration refers to the set of administrative parameters exposed by NVIDIA to tune GPU behavior. DCGM makes it easier for clients to define target configurations and ensure those configurations are maintained over time.
It is important to note that different GPU properties have different levels of persistence. There are two broad categories:
- Device InfoROM lifetime
- Non-volatile memory on each board, holding certain configurable firmware settings.
- Persists indefinitely, though firmware can be flashed.
- GPU initialization lifetime
- Driver level data structures, holding volatile GPU runtime information.
- Persists until the GPU is de-initialized by the kernel mode driver.
DCGM is primarily focused on maintaining configuration settings that fall into the second category. These settings are normally volatile, potentially resetting each time a GPU becomes idle or is reset. By using DCGM a client can ensure that these settings persist over the desired lifetime.
In most common situations the client should be expected to define a configuration for all GPUs in the system (global group) at system initialization, or define individual partitioned group settings on a per-job basis. Once a configuration has been defined DCGM will enforce that configuration, for example across driver restarts, GPU resets or at job start.
DCGM currently supports the follows configuration settings:
| Setting | Description | Defaults |
|---|---|---|
| Sync Boost | Coordinate Auto Boost across GPUs in the group | None |
| Target Clocks | Attempt to maintain fixed clocks at the target values | None |
| ECC Mode | Enable ECC protection throughout the GPU’s memory | Usually On |
| Power Limit | Set the maximum allowed power consumption | Varies |
| Compute Mode | Limit concurrent process access to the GPU | No restrictions |
To define a target configuration for a group, use the dcgmi config subcommand. Using the group created in the section above, the following example shows how to set a compute mode target and then list the current configuration state.
# dcgmi config -g 1 --set -c 2
Configuration successfully set.
#dcgmi config -g 1 --get
+--------------------------+------------------------+------------------------+
| GPU_Group                |                        |                        |
| Group of 2 GPUs          | TARGET CONFIGURATION   | CURRENT CONFIGURATION  |
+==========================+========================+========================+
| Sync Boost               | Not Specified          | Disabled               |
| SM Application Clock     | Not Specified          | ****                   |
| Memory Application Clock | Not Specified          | ****                   |
| ECC Mode                 | Not Specified          | ****                   |
| Power Limit              | Not Specified          | ****                   |
| Compute Mode             | E. Process             | E. Process             |
+--------------------------+------------------------+------------------------+
**** Non-homogenous settings across group. Use with –v flag to see details.

#dcgmi config -g 1 --get --verbose
+--------------------------+------------------------+------------------------+
| GPU ID: 0                |                        |                        |
| Tesla K20c               | TARGET CONFIGURATION   | CURRENT CONFIGURATION  |
+==========================+========================+========================+
| Sync Boost               | Not Specified          | Disabled               |
| SM Application Clock     | Not Specified          | 705                    |
| Memory Application Clock | Not Specified          | 2600                   |
| ECC Mode                 | Not Specified          | Disabled               |
| Power Limit              | Not Specified          | 225                    |
| Compute Mode             | E. Process             | E. Process             |
+--------------------------+------------------------+------------------------+
+--------------------------+------------------------+------------------------+
| GPU ID: 1                |                        |                        |
| GeForce GT 430           | TARGET CONFIGURATION   | CURRENT CONFIGURATION  |
+==========================+========================+========================+
| Sync Boost               | Not Specified          | Disabled               |
| SM Application Clock     | Not Specified          | 562                    |
| Memory Application Clock | Not Specified          | 2505                   |
| ECC Mode                 | Not Specified          | Enabled                |
| Power Limit              | Not Specified          | 200                    |
| Compute Mode             | E. Process             | E. Process             |
+--------------------------+------------------------+------------------------+
Once a configuration is set, DCGM maintains the notion of Target and Current state. Target tracks the user’s request for configuration state while Current tracks the actual state of the GPU and group. These are generally maintained such that they are equivalent with DCGM restoring current state to target in situations where that state is lost or changed. This is common in situations where DCGM has executed some invasive policy like a health check or GPU reset.
Policy
DCGM provides a way for clients to configure automatic GPU behaviors in response to various conditions. This is useful for event->action situations, such as GPU recovery in the face of serious errors. It’s also useful for event->notification situations, such as when a client wants to be warned if a RAS event occurs. In both scenarios the client must define a condition on which to trigger further behavior. These conditions are specified from a predefined set of possible metrics. In some cases the client must also provide a threshold above/below which the metric condition is triggered. Generally, conditions are fatal and non-fatal RAS events, or performance-oriented warnings. These include the following examples:
| Condition | Type | Threshold | Description |
|---|---|---|---|
| PCIe/NVLINK Errors | Fatal | Hardcoded | Uncorrected, or corrected above SDC threshold |
| ECC Errors | Fatal | Hardcoded | Single DBE, multiple co-located SBEs |
| Page Retirement Limit | Non-Fatal | Settable | Lifetime limit for ECC errors, or above RMA rate |
| Power Excursions | Performance | Settable | Excursions above specified board power threshold |
| Thermal Excursions | Performance | Settable | Excursions above specified GPU thermal threshold |
| XIDs | All | Hardcoded | XIDs represent several kinds of events within the NVIDIA driver such as pending page retirements or GPUs falling off the bus. See http://docs.nvidia.com/deploy/xid-errors/index.html for details. |
Notifications
The simplest form of a policy is to instruct DCGM to notify a client when the target condition is met. No further action is performed beyond this. This is primarily interesting as a callback mechanism within the programmatic interfaces, as a way to avoid polling.
When running DCGM in embedded mode such callbacks are invoked automatically by DCGM each time a registered condition is hit, at which point the client can deal with that event as desired. The client must register through the appropriate API calls to receive these callbacks. Doing so transparently instructs DCGM to track the conditions that trigger those results.
The dcgmi policy subcommand does allow access to some of this functionality from the command line via setting of conditions and via a blocking notification mechanism. This can be useful when watching for a particular problem, e.g. during a debugging session.
As an example, the following shows setting a notification policy for PCIe fatal and non-fatal events:
 # dcgmi policy -g 2 --set 0,0 -p
Policy successfully set.

#dcgmi policy -g 2 --get
Policy information
+---------------------------+------------------------------------------------+
| GPU_Group                 | Policy Information                             |
+===========================+================================================+
| Violation conditions      | PCI errors and replays                         |
| Isolation mode            | Manual                                         |
| Action on violation       | None                                           |
| Validation after action   | None                                           |
| Validation failure action | None                                           |
+---------------------------+------------------------------------------------+
**** Non-homogenous settings across group. Use with –v flag to see details.

#dcgmi policy -g 2 --get --verbose
Policy information
+---------------------------+------------------------------------------------+
| GPU ID: 0                 | Policy Information                             |
+===========================+================================================+
| Violation conditions      | PCI errors and replays                         |
| Isolation mode            | Manual                                         |
| Action on violation       | None                                           |
| Validation after action   | None                                           |
| Validation failure action | None                                           |
+---------------------------+------------------------------------------------+
+---------------------------+------------------------------------------------+
| GPU ID: 1                 | Policy Information                             |
+===========================+================================================+
| Violation conditions      | PCI errors and replays                         |
| Isolation mode            | Manual                                         |
| Action on violation       | None                                           |
| Validation after action   | None                                           |
| Validation failure action | None                                           |
+---------------------------+-----------------------------------------------
Once such a policy is set the client will receive notifications accordingly. While this is primarily interesting for programmatic use cases, dcgmi policy can be invoked to wait for policy notifications:
# dcgmi policy -g 2 --reg
Listening for violations
...
A PCIe error has violated policy manager values.
...
Actions
Action policies are a superset of the notification policies above.
Some clients may find it useful to tie a condition to an action that DCGM performs automatically as soon as the condition is met. This is most pertinent when the condition is a RAS event that prevents the GPU from otherwise operating normally.
Policies that are defined as actions include three additional components:
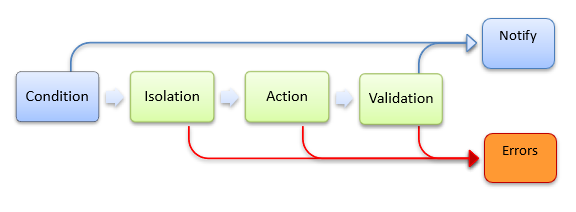
- Isolation mode – whether DCGM grabs exclusive access to the GPU before performing the subsequent policy steps.
- Action – The DCGM invasive behavior to perform.
- Validation – Any follow-up validation of GPU state, post action.
A common action based policy is to configure DCGM to automatically retire a memory page after an ECC DBE has occurred. By retiring the page and re-initializing the GPU, DCGM can isolate the hardware fault and prepare the GPU for the next job. Since this operation involves resetting the GPU, a quick system validation is a follow-up step to ensure the GPU is healthy.
Clients setting action policies receive two notifications each time the policy is run.
- Notification callback when condition is hit and policy enacted.
- Notification callback when action completes, i.e. after validation step.
Using the dcgmi policy subcommand, this kind of action-based policy can be configured as follows:
# dcgmi policy -g 1 --set 1,1 -e
Policy successfully set.

# dcgmi policy -g 1 --get
Policy information for group 1
+----------------------------------------------------------------------------+
| GPU ID: 0                 | Policy Information                             |
+===========================+================================================+
| Violation Conditions      | Double-bit ECC errors                          |
| Isolation mode            | Manual                                         |
| Action on violation       | Reset GPU                                      |
| Validation after action   | NVVS (Short)                                   |
| Validation failure action | None                                           |
+---------------------------+------------------------------------------------+
...
As shown in the previous section, dcgmi policy can also be used to watch for notifications associated with this policy.
Job Stats
DCGM provides background data gathering and analysis capabilities, including the ability to aggregate data across the lifetime of a target workload and across the GPUs involved. This makes it easy for clients to gather job level data, such as accounting, in a single request.
To request this functionality a client must first enable stats recording for the target group. This tells DCGM that all relevant metrics must be periodically watched for those GPUs, along with process activity on the devices. This need only be done once at initialization for each job-level group.
 # dcgmi stats -g 1 --enable
Successfully started process watches on group 1.
Stats recording must be enabled prior to the start of the target workload(s) for reliable information to be available.
Once a job has completed DCGM can be queried for information about that job, both at the summary level of a group and, if needed, broken down individually between the GPUs within that group. The suggested behavior is that clients perform this query in epilogue scripts as part of job cleanup.
An example of group-level data provided by dcgmi stats:
dcgmi stats --pid 1234 -v
Successfully retrieved process info for pid: 1234. Process ran on 1 GPUs.
+----------------------------------------------------------------------------+
| GPU ID: 0                                                                  |
+==================================+=========================================+
|------- Execution Stats ----------+-----------------------------------------|
| Start Time *                     | Tue Nov 3 17:36:43 2015                 |
| End Time *                       | Tue Nov 3 17:38:33 2015                 |
| Total Execution Time (sec) *     | 110.33                                  |
| No. of Conflicting Processes *   | 0                                       |
+------- Performance Stats --------+-----------------------------------------+
| Energy Consumed (Joules)         | 15758                                   |
| Power Usage (Watts)              | Avg: 150, Max: 250, Min: 100            |
| Max GPU Memory Used (bytes) *    | 213254144                               |
| SM Clock (MHz)                   | Avg: 837, Max: 875, Min: 679            |
| Memory Clock (MHz)               | Avg: 2505, Max: 2505, Min: 2505         |
| SM Utilization (%)               | Avg: 99, Max: 100, Min: 99              |
| Memory Utilization (%)           | Avg: 2, Max: 3, Min: 0                  |
| PCIe Rx Bandwidth (megabytes)    | Avg: N/A, Max: N/A, Min: N/A            |
| PCIe Tx Bandwidth (megabytes)    | Avg: N/A, Max: N/A, Min: N/A            |
+------- Event Stats --------------+-----------------------------------------+
| Single Bit ECC Errors            | 0                                       |
| Double Bit ECC Errors            | 0                                       |
| PCIe Replay Warnings             | 0                                       |
| Critical XID Errors              | 0                                       |
+------- Slowdown Stats -----------+-----------------------------------------+
| Due to - Power (%)               | 0                                       |
| - Thermal (%)                    | 0                                       |
| - Reliability (%)                | 0                                       |
| - Board Limit (%)                | 0                                       |
| - Low Utilization (%)            | 0                                       |
| - Sync Boost (%)                 | Not Supported                           |
+----------------------------------+-----------------------------------------+
(*) Represents a process statistic. Otherwise device statistic during process lifetime listed.
For certain frameworks the processes and their PIDs cannot be associated with a job directly, and the process associated with a job may spawn many children. In order to get job-level stats for such a scenario, DCGM must be notified when a job starts and stops. It is required that the client notifies DCGM with the user defined job id and the corresponding GPU group at job prologue, and notifies with the job id at the job epilogue. The user can query the job stats using the job id and get aggregated stats across all the pids during the window of interest.
An example of notifying DCGM at the beginning and end of the job using dcgmi:
# dcgmi stats -g 1 –s <user-provided-jobid>
Successfully started recording stats for <user-provided-jobid>
# dcgmi stats –x <user-provided-jobid>
Successfully stopped recording stats for <user-provided-jobid>
The stats corresponding to the job id already watched can be retrieved using dcgmi:
# dcgmi stats –j <user-provided-jobid>
Successfully retrieved statistics for <user-provided-jobid>
+----------------------------------------------------------------------------+
| GPU ID: 0                                                                  |
+==================================+=========================================+
|------- Execution Stats ----------+-----------------------------------------|
| Start Time                       | Tue Nov 3 17:36:43 2015                 |
| End Time                         | Tue Nov 3 17:38:33 2015                 |
| Total Execution Time (sec)       | 110.33                                  |
| No. of Processes                 | 0                                       |
+----- Performance Stats ----------+-----------------------------------------+
| Energy Consumed (Joules)         | 15758                                   |
| Power Usage (Watts)              | Avg: 150, Max: 250, Min 100             |
| Max GPU Memory Used (bytes)      | 213254144                               |
| SM Clock (MHz)                   | Avg: 837, Max: 875, Min: 679            |
| Memory Clock (MHz)               | Avg: 2505, Max: 2505, Min: 2505         |
| SM Utilization (%)               | Avg: 99, Max: 100, Min: 99              |
| Memory Utilization (%)           | Avg: 2, Max: 3, Min: 0                  |
| PCIe Rx Bandwidth (megabytes)    | Avg: N/A, Max: N/A, Min: N/A            |
| PCIe Tx Bandwidth (megabytes)    | Avg: N/A, Max: N/A, Min: N/A            |
+----- Event Stats ----------------+-----------------------------------------+
| Single Bit ECC Errors            | 0                                       |
| Double Bit ECC Errors            | 0                                       |
| PCIe Replay Warnings             | 0                                       |
| Critical XID Errors              | 0                                       |
+----- Slowdown Stats -------------+-----------------------------------------+
| Due to - Power (%)               | 0                                       |
| - Thermal (%)                    | 0                                       |
| - Reliability (%)                | 0                                       |
| - Board Limit (%)                | 0                                       |
| - Low Utilization (%)            | 0                                       |
| - Sync Boost (%)                 | Not Supported                           |
+----------------------------------+-----------------------------------------+
Health and Diagnostics
DCGM provides several mechanisms for understanding GPU health, each targeted at different needs. By leveraging each of these interfaces it is easy for clients to determine overall GPU health non-invasively -- while workloads are running, and actively -- when the GPU(s) can run dedicated tests. A new major feature of DCGM is the ability to run online hardware diagnostics.
More detailed targeted use cases are as follows:
- Background health checks.
These are non-invasive monitoring operations that occur while jobs are running, and can be queried at any time. There is no impact on application behavior or performance.
- Prologue health checks.
Quick, invasive health checks that take a few seconds and are designed to verify that a GPU is ready for work prior to job submission.
- Epilogue health checks.
Medium duration invasive health checks, taking a few minutes, that can be run when a job has failed or a GPU’s health is otherwise suspect
. - Full system validation.
Long duration invasive health checks, taking tens of minutes, that can be run when a system is being active investigated for hardware problems or other serious issues.
CAUTION:All of these are online diagnostics, meaning they run within the current environment. There is potential for factors beyond the GPU to influence behavior in negative ways. While these tools try to identify those situations, full offline diagnostics delivered via a different NVIDIA tool are required for complete hardware validation, and are required for RMA.
Background Health Checks
This form of health check is based on passive, background monitoring of various hardware and software components. The objective is to identify problems in key areas without impact on application behavior or performance. These kinds of checks can catch serious problems, such as unresponsive GPUs, corrupted firmware, thermal escapes, etc.
When such issues are identified they are reported by DCGM as warnings or errors. Each situation can require different client responses, but the following guidelines are usually true:
- Warning – an issue has been detected that won’t prevent current work from completing, but the issue should be examined and potentially addressed in the future.
- Error – a critical issue has been detected and the current work is likely compromised or interrupted. These situations typically correspond to fatal RAS events and usually indicate the need for job termination and GPU health analysis.
Background health checks can be set and watched via simple DCGM interfaces. Using dcgmi health as the interface, the following code sets several health checks for a group and then verifies that those checks are currently enabled:
 # dcgmi health -g 1 -s mpi
Health monitor systems set successfully.
To view the current status of all GPUs in the group the client can simply query for the overall group health. The result is an overall health score for the group as well as individual results for each impacted GPU, identifying key problems.
For example, DCGM would show the following when excessive PCIe replay events or InfoROM issues are detected:
# dcgmi health -g 1 –c
Health Monitor Report
+----------------------------------------------------------------------------+
| Group 1          | Overall Health: Warning                                 |
+==================+=========================================================+
| GPU ID: 0        | Warning                                                 |
|                  | PCIe system: Warning - Detected more than 8 PCIe        |
|                  | replays per minute for GPU 0: 13                        |
+------------------+---------------------------------------------------------+
| GPU ID: 1        | Warning                                                 |
|                  | InfoROM system: Warning - A corrupt InfoROM has been    |
|                  | detected in GPU 1.                                      |
+------------------+---------------------------------------------------------+
Active Health Checks
This form of health check is invasive, requiring exclusive access to the target GPUs. By running real workloads and analyzing the results, DCGM is able to identify common problems of a variety of types. These include:
- Deployment and Software Issues
- NVIDIA library access and versioning
- 3rd-party software conflicts
- Integration Issues
- Correctable/uncorrectable issues on PCIe/NVLINK busses
- Topological limitations
- OS-level device restrictions, cgroups checks
- Basic power and thermal constraint checks
- Stress Checks
- Power and thermal stress
- PCIe/NVLINK throughput stress
- Constant relative system performance
- Maximum relative system performance
- Hardware Issues and Diagnostics
- GPU hardware and SRAMs
- Computational robustness
- Memory
- PCIe/NVLINK busses
DCGM exposes these health checks through its diagnostic and policy interfaces. DCGM provides three levels of diagnostic capability (see dcgmi diag help on the command line). DCGM runs more in-depth tests to verify the health of the GPU at each level. The test names and tests run at each level are provided in the table below:
| Test Suite Name | Run Level |
Test Duration |
Test Classes | |||
|---|---|---|---|---|---|---|
| Software | Hardware | Integration | Stress | |||
| Quick | 1 | ~ seconds | Deployment | -- | -- | -- |
| Medium | 2 | ~ 2 minutes | Deployment | Memory Test | PCIe/NVLink | -- |
| Long | 3 | ~15 minutes | Deployment |
Memory Test Memory Bandwidth HW Diagnostic Tests |
PCIe/NVLink |
SM Stress Targeted Stress Targeted Power |
While simple tests of runtime libraries and configuration are possible on non-Tesla GPUs (Run Level 1), DCGM is also able to perform hardware diagnostics, connectivity diagnostics, and a suite of stress tests on Tesla GPUs to help validate health and isolate problems. The actions in each test type are further described in the section GPU Parameters.
For example, running the full system validation (long test):
# dcgmi diag -g 1 -r 3
Successfully ran diagnostic for group 1.
+---------------------------+------------------------------------------------+
| Diagnostic                | Result                                         |
+===========================+================================================+
|------- Deployment --------+------------------------------------------------|
| Blacklist                 | Pass                                           |
| NVML Library              | Pass                                           |
| CUDA Main Library         | Pass                                           |
| CUDA Toolkit Libraries    | Pass                                           |
| Permissions and OS Blocks | Pass                                           |
| Persistence Mode          | Pass                                           |
| Environment Variables     | Pass                                           |
| Page Retirement           | Pass                                           |
| Graphics Processes        | Pass                                           |
+------- Hardware ----------+------------------------------------------------+
| GPU Memory                | Pass - All                                     |
| Diagnostic                | Pass - All                                     |
+------- Integration -------+------------------------------------------------+
| PCIe                      | Pass - All                                     |
+------- Performance -------+------------------------------------------------+
| SM Stress                 | Pass - All                                     |
| Targeted Stress           | Pass - All                                     |
| Targeted Power            | Pass - All                                     |
| Memory Bandwidth          | Pass – All                                     |
+---------------------------+------------------------------------------------+
The diagnostic tests can also be run as part of the validation phase of action-based policies. A common scenario, for example, would be to run the short version of the test as a validation to a DBE page retirement action.
DCGM will store logs from these tests on the host file system. Two types of logs exist:
- Hardware diagnostics include an encrypted binary log, only viewable by NVIDIA.
- System validation and stress checks provide additional time series data via JSON text files. These can be viewed in numerous programs to see much more detailed information about GPU behavior during each test.
For complete details about the active health checks, including descriptions of the plugins and their various failure conditions, please read chapter 5.
Topology
DCGM provides several mechanisms for understanding GPU topology both at a verbose device-level view and non-verbose group-level view. These views are designed to give a user information about connectivity to other GPUs in the system as well as NUMA/affinity information.
For the device-level view:
# dcgmi topo --gpuid 0
+-------------------+--------------------------------------------------------+
| GPU ID: 0         | Topology Information                                   |
+===================+========================================================+
| CPU Core Affinity | 0 - 11                                                 |
+-------------------+--------------------------------------------------------+
| To GPU 1          | Connected via an on-board PCIe switch                  |
| To GPU 2          | Connected via a PCIe host bridge                       |
+-------------------+--------------------------------------------------------+
And for the group-level view:
# dcgmi topo -g 1
+-------------------+--------------------------------------------------------+
| MyGroup           | Topology Information                                   |
+===================+========================================================+
| CPU Core Affinity | 0 - 11                                                 |
+-------------------+--------------------------------------------------------+
| NUMA Optimal      | True                                                   |
+-------------------+--------------------------------------------------------+
| Worst Path        | Connected via a PCIe host bridge                       |
+-------------------+--------------------------------------------------------+
.........
NVlink Counters
DCGM provides a way to check the nvlink error counters for various links in the system. This makes it easy for clients to catch abnormalities and watch the health of the communication over nvlink. There are multiple types of nvlink errors that are accounted for by DCGM as follows:
- CRC FLIT Error: Data link receive flow control digit CRC error
- CRC Data Error: Data link receive data CRC error.
- Replay Error: Transmit replay error.
- Recovery Error: Transmit recovery error.
To check the nvlink counters for all the nvlink present in gpu with gpu Id 0:
 # dcgmi nvlink --errors -g 0
+-------------------------------------------------------------+
| GPU ID: 0 | NVLINK Error Counts                             |
+-------------------------------------------------------------+
|Link 0     | CRC FLIT Error      | 0                         |
|Link 0     | CRC Data Error      | 0                         |
|Link 0     | Replay Error        | 0                         |
|Link 0     | Recovery Error      | 0                         |
|Link 1     | CRC FLIT Error      | 0                         |
|Link 1     | CRC Data Error      | 0                         |
|Link 1     | Replay Error        | 0                         |
|Link 1     | Recovery Error      | 0                         |
|Link 2     | CRC FLIT Error      | 0                         |
|Link 2     | CRC Data Error      | 0                         |
|Link 2     | Replay Error        | 0                         |
|Link 2     | Recovery Error      | 0                         |
|Link 3     | CRC FLIT Error      | 0                         |
|Link 3     | CRC Data Error      | 0                         |
|Link 3     | Replay Error        | 0                         |
|Link 3     | Recovery Error      | 0                         |
+-------------------------------------------------------------+
Field Groups
DCGM provides predefined groups of fields like job statistics, process statistics, and health for ease of use. Additionally, DCGM allows users to create their own custom groups of fields called field groups. Users can watch a group of fields on a group of GPUs and then retrieve either the latest values or a range of values of every field in a field group for every GPU in a group.
Field groups are not used directly in DCGMI, but you can still look at them and manage them from DCGMI.
To see all of the active field groups on a system, run:
# dcgmi fieldgroup -l
4 field groups found.
+----------------------------------------------------------------------------+
| FIELD GROUPS                                                               |
+============+===============================================================+
| ID         | 1                                                             |
| Name       | DCGM_INTERNAL_1SEC                                            |
| Field IDs  | 38, 73, 86, 112, 113, 119, 73, 51, 47, 46, 66, 72, 61, 118,...|
+------------+---------------------------------------------------------------+
| ID         | 2                                                             |
| Name       | DCGM_INTERNAL_30SEC                                           |
| Field IDs  | 124, 125, 126, 130, 131, 132, 133, 134, 135, 136, 137, 138,...|
+------------+---------------------------------------------------------------+
| ID         | 3                                                             |
| Name       | DCGM_INTERNAL_HOURLY                                          |
| Field IDs  | 117, 55, 56, 64, 62, 63, 6, 5, 26, 8, 17, 107, 22, 108, 30, 31|
+------------+---------------------------------------------------------------+
| ID         | 4                                                             |
| Name       | DCGM_INTERNAL_JOB                                             |
| Field IDs  | 111, 65, 36, 37, 38, 101, 102, 77, 78, 40, 41, 121, 115, 11...|
+------------+---------------------------------------------------------------+
If you want to create your own field group, pick a unique name for it, decide which field IDs you want inside of it, and run:
 # dcgmi fieldgroup -c mygroupname -f 50,51,52
Successfully created field group "mygroupname" with a field group ID of 5
Note that field IDs come from dcgm_fields.h and are the macros that start with DCGM_FI_.
Once you have created a field group, you can query its info:
#dcgmi fieldgroup -i --fieldgroup 5
+----------------------------------------------------------------------------+
| FIELD GROUPS                                                               |
+============+===============================================================+
| ID         | 5                                                             |
| Name       | mygroupname                                                   |
| Field IDs  | 50, 51, 52                                                    |
+------------+---------------------------------------------------------------+
If you want to delete a field group, run the following command:
# dcgmi fieldgroup -d -g 5
Successfully removed field group 5
Note that DCGM creates a few field groups internally. Field groups that are created internally, like the ones above, cannot be removed. Here is an example of trying to delete a DCGM-internal field group:
# dcgmi fieldgroup -d -g 1
Error: Cannot destroy field group 1. Return: No permission.
Link Status
In DCGM 1.5, you can query the status of the NVLinks of the GPUs and NVSwitches attached to the system with the following command:
# dcgmi nvlink --link-status
+----------------------+
|  NvLink Link Status  |
+----------------------+
GPUs:
    gpuId 0:
        U U U U U U
    gpuId 1:
        U U U U U U
    gpuId 2:
        U U U U U U
    gpuId 3:
        U U U U U U
    gpuId 4:
        U U U U U U
    gpuId 5:
        U U U U U U
    gpuId 6:
        U U U U U U
    gpuId 7:
        U U U U U U
    gpuId 8:
        U U U U U U
    gpuId 9:
        U U U U U U
    gpuId 10:
        U U U U U U
    gpuId 11:
        U U U U U U
    gpuId 12:
        U U U U U U
    gpuId 13:
        U U U U U U
    gpuId 14:
        U U U U U U
    gpuId 15:
        U U U U U U
NvSwitches:
    physicalId 8:
        U U U U U U X X U U U U U U U U U U
    physicalId 9:
        U U U U U U U U U U U U U U X X U U
    physicalId 10:
        U U U U U U U U U U U U X U U U X U
    physicalId 11:
        U U U U U U X X U U U U U U U U U U
    physicalId 12:
        U U U U X U U U U U U U U U U U X U
    physicalId 13:
        U U U U X U U U U U U U U U U U X U
    physicalId 24:
        U U U U U U X X U U U U U U U U U U
    physicalId 25:
        U U U U U U U U U U U U U U X X U U
    physicalId 26:
        U U U U U U U U U U U U X U U U X U
    physicalId 27:
        U U U U U U X X U U U U U U U U U U
    physicalId 28:
        U U U U X U U U U U U U U U U U X U
    physicalId 29:
        U U U U X U U U U U U U U U U U X U

Key: Up=U, Down=D, Disabled=X, Not Supported=_
Profiling Metrics
As GPU-enabled servers become more common in the datacenter, it becomes important to better understand applications’ performance and the utilization of GPU resources in the cluster. Profiling metrics in DCGM enables the collection of a set of metrics using the hardware counters on the GPU. DCGM provides access to device-level metrics at low performance overhead in a continuous manner. This feature is currently in beta starting with DCGM 1.7.
DCGM includes a new profiling module to provide access to these metrics. The new metrics are available as new fields (i.e.n new IDs) via the regular DCGM APIs (such as the C, Python, Go bindings or the dcgmi command line utility). The installer packages also include an example CUDA based test load generator (called dcgmproftester) to demonstrate the new capabilities.
Profiling Metrics
In this release of DCGM, the following new device-level profiling metrics are supported. The definitions and corresponding DCGM field IDs are listed. By default, DCGM provides the metrics at a sample rate of 1Hz (every 1000ms). Users can query the metrics at any configurable frequency (minimum is 100ms) from DCGM (for example, see dcgmi dmon -d ).
| Metric | Definition | DCGM Field Name (DCGM_FI_*) and ID |
|---|---|---|
| Graphics Engine Activity | Ratio of time the graphics engine is active. The graphics engine is active if a graphics/compute context is bound and the graphics pipe or compute pipe is busy. | PROF_GR_ENGINE_ACTIVE (ID: 1001) |
| SM Activity | The ratio of cycles an SM has at least 1 warp assigned (computed from the number of cycles and elapsed cycles) | PROF_SM_ACTIVE (ID: 1002) |
| SM Occupancy | The ratio of number of warps resident on an SM. (number of resident warps as a percentage of the theoretical maximum number of warps per elapsed cycle) | PROF_SM_OCCUPANCY (ID: 1003) |
| Tensor Activity | The ratio of cycles the tensor (HMMA) pipe is active (off the peak sustained elapsed cycles) | PROF_PIPE_TENSOR_ACTIVE (ID: 1004) |
| Memory BW Utilization | The ratio of cycles the device memory interface is active sending or receiving data. | PROF_DRAM_ACTIVE (ID: 1005) |
| Engine Activity | Ratio of cycles the fp64 /fp32 / fp16 / HMMA|IMMA pipes are active. | PROF_PIPE_FPXY_ACTIVE (ID: 1006 (FP64); 1007 (FP32); 1008 (FP16)) |
| NVLink Activity | The number of bytes of active NVLink rx or tx data including both header and payload. | DEV_NVLINK_BANDWIDTH_L0 |
| PCIe Bandwidth | pci__bytes_{rx, tx} - The number of bytes of active pcie rx or tx data including both header and payload. | PROF_PCIE_[T|R]X_BYTES (ID: 1009 (TX); 1010 (RX)) |
Some metrics require multiple passes to be collected and therefore all metrics cannot be collected together. Due to hardware limitations on the Tesla V100, only certain groups of metrics can be read together. For example, SM Activity | SM Occupancy cannot be collected together with Tensor Utilization. To overcome these limitations, DCGM supports automatic multiplexing of metrics by statistically sampling the requested metrics and performing the groupings internally. This may be transparent to users who requested metrics that may not have been able to be collected together.
Profiling of the GPU counters requires administrator privileges starting with Linux drivers 418.43 or later. This is documented here. When using profiling metrics from DCGM, ensure that nv-hostengine is started with superuser privileges.
CUDA Test Generator (dcgmproftester)
dcgmproftester is a CUDA load generator. It can be used to generate deterministic CUDA workloads for reading and validating GPU metrics. The tool is shipped as a simple x86_64 Linux binary along with the CUDA kernels compiled to PTX. Customers can use the tool in conjunction with dcgmi to quickly generate a load on the GPU and view the metrics reported by DCGM via dcgmi dmon on stdout.
dcgmproftester takes two important arguments as input: -t for generating load for a particular metric (for example use 1004 to generate a half-precision matrix-multiply-accumulate for the Tensor Cores) and -d for specifying the test duration. Add --no-dcgm-validation to let dcgmproftester generate test loads only.
For a list of all the field IDs that can be used to generate specific test loads, see the table in the Profiling Metrics section. The rest of this section includes some examples using the dcgmi command line utility.
Before starting to use dcgmproftester copy the utilities into a local directory. You should find the dcgmproftester binary and DcgmProfTesterKernels.ptx for the PTX of the kernels.
$ cp -r /usr/local/dcgm/sdk_samples/dcgmproftester $HOME
For example in a console, generate a load for the TensorCores on V100 for 30seconds. As can be seen, the V100 is able to achieve close to 94TFLops of FP16 performance using the TensorCores.
 $ ./dcgmproftester --no-dcgm-validation -t 1004 -d 30
 CU_DEVICE_ATTRIBUTE_MAX_THREADS_PER_MULTIPROCESSOR: 2048
 CU_DEVICE_ATTRIBUTE_MULTIPROCESSOR_COUNT: 80
 CU_DEVICE_ATTRIBUTE_MAX_SHARED_MEMORY_PER_MULTIPROCESSOR: 98304
 CU_DEVICE_ATTRIBUTE_MEMORY_CLOCK_RATE: 877000
 Max Memory bandwidth: 898048000000 bytes (898.05 GiB)
 CudaInit completed successfully.

 TensorEngineActive ??? (91772.8 gflops)
 TensorEngineActive ??? (93744.9 gflops)
 TensorEngineActive ??? (93831.8 gflops)
 TensorEngineActive ??? (93848.2 gflops)
 TensorEngineActive ??? (93844.5 gflops)
In another console, use the dcgmi dmon -e command to view the various performance metrics (streamed to stdout) reported by DCGM as the CUDA workload runs on the GPU. In this example, DCGM reports the GPU activity, TensorCore activity and Memory utilization at a frequency of 1Hz (or 1000ms). As can be seen, the GPU is busy doing work (~99% of Graphics Activity showing that the SMs are busy), with the TensorCore activity pegged to ~80%. Note that dcgmi is currently returning the metrics for GPU ID: 0. On a multi-GPU system, you can specify the GPU ID for which DCGM should return the metrics. By default, the metrics are returned for all the GPUs in the system.
 $ dcgmi dmon -e 1001,1004,1005
 # GPU/Sw  GRACT  TENSO  DRAMA
 Id
 0  0.000  0.000  0.000
 0  1.000  0.909  0.213
 0  0.994  0.797  0.251
 0  0.992  0.796  0.251
 0  0.992  0.796  0.250
 0  0.993  0.797  0.251
 0  0.994  0.797  0.251
 0  0.994  0.797  0.251
 0  0.993  0.796  0.251