

Power and Thermals#
This chapter provides information about CPU power and thermal management settings on Vera.
C-States#
C-States refer to idle CPU power states. Use C-state controls when idle power or wake up latency matters. Deep idle states save more power but add exit latency when work resumes.
Vera has the following C-states:
LPI-0 (Low-Power Idle 0): Enhanced clock gated state
This state is entered when WFI/WFE instructions are executed by the CPU core. In addition to clock gating, the core voltage and frequency are reduced. Core context is preserved.
LPI-1: Power gated state
Core power gated state. Context is lost. Best suited for longer idle durations.
The LPI feature in Advanced Configuration and Power Interface (ACPI) tables provides information about the C-states to the OS. On Linux, the information is used by the cpuidle framework.
Vera supports SMT2 where each CPU core contains two Processing Elements (PE).
LPI states describe a CPU core’s power state. However, the kernel’s cpuidle framework exposes states per PE. This is because each PE independently requests a state using WFI/WFE, so the hardware enters the shallowest LPI state that is common to both PEs on the core. If only one PE on a core is in WFI/WFE and the other PE is active, the physical core remains active, and no LPI state is entered.
For systems that do not use cpuidle governors, CPU cores can still enter the LPI-0 state when WFI/WFE instructions are executed, but no stats will be available.
C-State sysfs Mapping and Metrics#
The following table provides the default mapping of the C-State to the sysfs node directory that contains information on desc, time, and usage statistics for the power state. However, you should always verify the mapping on the end system using the description in the directory.
C-State |
(Expected) sysfs node directory |
|---|---|
LPI-0 |
/sys/devices/system/cpu/cpuN/cpuidle/state0/ |
LPI-1 |
/sys/devices/system/cpu/cpuN/cpuidle/state1/ |
To confirm state mapping, run the following command:
cat /sys/devices/system/cpu/cpuN/cpuidle/state0/desc
For systems that have the cpuidle framework enabled, state metrics are collected through the idle framework and can be read through sysfs.
To read the number of state0 selections for cpuN, run the following command:
cat /sys/devices/system/cpu/cpuN/cpuidle/state0/usageTo read the time spent (in microseconds) in state0 for cpuN, run the following command:
cat /sys/devices/system/cpu/cpuN/cpuidle/state0/time
Note
There are some considerations to be made regarding LPI-1.
LPI-1 metrics reflect the core level state, not the PE level state, so the metrics for a logical core will only update when the core level state is triggered (for example, when both PEs on a core enter LPI-1). For LPI-0, they reflect the PE level state.
The LPI-1 state might cause performance degradation in latency sensitive applications because of the latency required to exit from the state. Refer to Enabling and Disabling C-States for more information about disabling the state.
Enabling and Disabling C-States#
C-state enablement and disablement can be controlled globally and per-CPU.
Global control
State enablement can also be controlled globally with the
cpupowertool, and through thedisablenode in the sysfs directories above.To install the cpupower tool, run the following command:
sudo apt install linux-tools-common linux-tools-`uname -r`To disable the LPI-1 state on all CPUs, run one of the following commands:
sudo cpupower idle-set -d 1echo 1 | sudo tee /sys/devices/system/cpu/cpu*/cpuidle/state1/disable
To enable the LPI-1 state on all CPUs, run one of the following commands:
sudo cpupower idle-set -e 1echo 0 | sudo tee /sys/devices/system/cpu/cpu*/cpuidle/state1/disable
Per-CPU control
You can enable LPI states per-PE through the
disablenode in the sysfs directories above.To disable the cpuidle governor from selecting LPI-1 on cpuN, run the following command:
echo 1 | sudo tee /sys/devices/system/cpu/cpuN/cpuidle/state1/disableTo enable the cpuidle governor to select LPI-1 on cpuN, run the following command:
echo 0 | sudo tee /sys/devices/system/cpu/cpuN/cpuidle/state1/disable
Note
LPI-0 cannot be truly disabled. It can be disabled in the cpuidle subsystem, but it can still be triggered in other ways. If no other valid state is available, the kernel will put PEs into WFI. In these cases, the hardware mechanism for LPI-0 will trigger, which results in a lower voltage and frequency.
P-States#
P-States refer to performance states, and Vera does not offer explicit P-states.
Vera exposes the maximum and minimum performance capabilities through ACPI’s Collaborative Processor Performance Control (CPPC) mechanism. CPPC offers users and operating systems the ability to request any performance within the allowed bounds of a power profile. Refer to CPU Performance and Frequency Management for more information.
CPU Performance and Frequency Management#
Each CPU core has one frequency source that is shared by its two PEs, so the PE frequency cannot be independently set. The final frequency is the maximum of the frequencies requested by the two PEs in a core.
Core frequency can be determined and/or set in the following ways:
Using an OS-based frequency governor
Hardware-autonomous frequency selection
User overrides
The following sections provide more information about these methods.
Hardware-Autonomous Frequency Selection#
Vera supports hardware-based DVFS (HW DVFS) for each core, which allows CPU cores to automatically and independently adjust their frequency based on usage and other factors. The frequency determination and change can be at a timescale that is much faster than OS-based governors, which allows the core to be more efficient. Vera supports CPPC, which can be enabled in hardware autonomous mode. To enable HW DVFS, set both PEs to the same mode. To maintain an efficient frequency control of the core you can, for example, enable or disable autonomous mode on both PEs.
Vera supports HW DVFS through the CPPC Autonomous Selection functionality, and it can be enabled by using the cppc_cpufreq.auto_sel_mode kernel boot arg. When hardware autonomous selection and an OS-based governor are both enabled, hardware autonomous selection takes precedence.
Boot-time configuration:
Here are the valid values for cppc_cpufreq.auto_sel_mode:
performance (or 1): override Energy Performance Preference (EPP) to performance (0x0)balance_performance (or 2): override EPP to balance_performance (0x80)default_epp (or 3): preserve EPP value programmed by BIOS/firmware
For example, the following to the kernel command line will enable autonomous selection with an EPP of 0x0 for all cores at boot:
cppc_cpufreq.auto_sel_mode=performance
This sets the initial state of the auto_select knob for all cores before userspace starts, but EPP values can also be modified by users at runtime. Refer to Energy Performance Preference for more information.
Runtime configuration: The following sysfs nodes can be used to control autonomous selection properties:
Auto selection
Enables or disables the hardware-autonomous frequency selection.
sysfs path:
/sys/devices/system/cpu/cpuN/cpufreq/auto_select
Here are the valid values:
1: Enable Autonomous Selection0: Disable Autonomous Selection
This knob can be modified at runtime irrespective of the boot-time configuration.
Min and max frequency
Lower and upper frequency bounds in kHz. Hardware will not scale frequency beyond these values.
sysfs paths:
/sys/devices/system/cpu/cpuN/cpufreq/scaling_min_freq/sys/devices/system/cpu/cpuN/cpufreq/scaling_max_freq
Here are the valid values:
scaling_min_freq: integer value in kHz between scaling_max_freq and cpuinfo_min_freq.scaling_max_freq: integer value in kHz between scaling_min_freq and cpuinfo_max_freq.
Energy Performance Preference
Hints to the hardware how aggressively to favor performance versus energy efficiency. Only takes effect when hardware autonomous selection is enabled (auto_select=1).
sysfs path:
/sys/devices/system/cpu/cpuN/cpufreq/energy_performance_preference_val
Here are the valid values:
Integer between 0 and 255. Values closer to 0 favor performance, values closer to 255 favor energy efficiency.
Examples:
0: Maximum performance (ramp to high frequency aggressively)128: Balanced255: Maximum energy efficiency (favor lowest frequency)
OS-Based Frequency Governors#
Linux’s cpufreq subsystem provides many frequency governors, and here are the most commonly used:
Performance governor: Geared towards getting the maximum performance and sets the performance/frequency request of the CPU cores to the maximum possible value.
The request is kept statically fixed at highest value.
Powersave governor: Geared towards lowest power consumption while keeping the core still operational.
The governor statically sets the frequency to the lowest allowed value.
Userspace governor: Bypasses a kernel governor and provides control to the userspace application for frequency control.
To set the frequency of the cores, a hypervisor, or a higher level software entity, can take input from an application. The kernel does not modify the frequency based on other information but will honor frequency caps based on thermals.
Schedutil governor: Uses information from the scheduler to determine the optimal frequency for the core.
The goal of this governor is to provide best performance while saving power by setting the frequency based on scheduler visible workloads.
Ondemand governor: Periodically samples the load on the CPU core to determine the optimal frequency.
This governor reacts to CPU core load and ramps frequency accordingly.
Refer to https://www.kernel.org/doc/Documentation/cpu-freq/governors.txt for more information.
The default frequency governor in Vera is the performance governor, which sets the frequency to the maximum value for that core. The maximum frequency usually corresponds to the maximum possible performance and is higher than the frequency at which nominal (sustained) performance can be achieved. When running at the maximum frequency violates thermals, the thermal management solution throttles frequency. Refer to Power and Thermal Management for more information.
Each PE in a core has its own CPPC interface, which allows the PE to make an independent frequency request. However, the PE’s final frequency is the maximum of the requested value from both PEs because they share a frequency source.
The ACPI _CPC object generically describes processor performance, which is requested on this abstract scale, and the platform
maps the request to real values that are understood by hardware. Refer to ACPI Specification 6.6, section 8.4.6
for more information.
CPPC v4#
Vera supports OSPM Nominal Performance Register functionality from CPPC v4, which extends CPPC with an interface to control processor performance. It is defined in the ACPI _CPC object:
OSPM Nominal Performance Register: Enables setting a lower nominal (sustained) performance point than the platform-defined nominal performance. Performance above this programmed value is boosted, and performance below this value is throttled. This value must be in the range between the lowest performance to nominal performance.
CPPC v4 has the following mutually exclusive operating modes on Vera:
ACPI (OS-managed) Mode
OSPM nominal performance registers can be set through the OS.
DPRP (HW-managed) Mode
The system firmware manages resource provisioning.
Both modes write the same CPPC v4 nominal performance register, so only one mode can be active at a time.
When the OS should own this policy, use ACPI mode.
When firmware should manage resource provisioning, use DPRP.
To enable CPPC v4 in the UEFI menu, select the following option.
Vera Configuration ->
   Power and Performance ->
      Enable CPPC V4 (ACPI 6.6)
After CPPC v4 is enabled, select one of the following modes.
Vera Configuration ->
   Power and Performance ->
      CPPC V4 Mode ->
         ACPI Mode (OS-Managed)
         or
         DPRP (HW-Managed)
ACPI (OS) mode and DPRP controlled CPPC v4 both write the same CPPC v4 nominal performance register so only one mode can be active at a time.
OS Managed#
Note
Support for CPPC v4 is not yet present in upstream Linux. Support will be available in a future BaseOS version.
In this mode, the OSPM Nominal Performance register is exposed in each PE of a core
through the /sys/devices/system/cpu/cpuN/cpufreq/ospm_nominal_freq sysfs node.
This node can be written to set the nominal performance for the PE to a value between
the lowest and nominal performance values defined in the ACPI _CPC object. The value
represents the nominal performance target the OS wants hardware to apply
when the system becomes power-limited.
To read the OSPM nominal frequency for PE N, run the following command:
cat /sys/devices/system/cpu/cpuN/cpufreq/ospm_nominal_freqTo write a new OSPM nominal frequency value (in kHZ) for PE N, run the following command:
echo *[frequency in kHz]* > /sys/devices/system/cpu/cpuN/cpufreq/ospm_nominal_freq
This enables priority-aware power management in power-limited conditions. By programming different OSPM nominal values for different cores, the software allows the selected cores to retain a higher operating frequency while other cores are throttled more aggressively when system power limits are exceeded.
During a power-limit event, hardware uses the programmed OSPM nominal value as the temporary limit for the affected core.
If HW DVFS is enabled, this value becomes the upper bound for autonomous frequency selection.
If HW DVFS is disabled, the core is driven directly to this value.
When the event clears, the temporary bound is removed and frequency selection returns to the typical behavior.
This interface is exposed for each PE, but hardware uses the maximum of the two requested values for both PEs in a core. For predictable behavior, program the same value on both sibling PEs.
Dynamic Power and Resource Partitioning (DPRP)#
DPRP is a firmware control layer for CPPC v4 and works by distributing a chip-wide performance budget across the cores in the system. Cores with stronger performance preference receive more of the budget, and lower-priority cores are more aggressively capped.
When DPRP is enabled, the firmware monitors each core’s programmed CPPC settings, such as EPP and min/max performance limits, every 50 ms, and uses the values as inputs to compute a new value and write to the core’s OSPM nominal performance register.
EPP values fall into one of four priority tiers:
Tier 0:
0 <= EPP < 64Tier 1:
64 <= EPP < 128Tier 2:
128 <= EPP < 192Tier 3:
192 <= EPP <= 255
DPRP distributes the performance budget across these tiers to grant higher priority tiers (lower EPP) a larger share while remaining within each core’s minimum and maximum limits.
The same min/max/epp sysfs nodes described in Hardware-Autonomous Frequency Selection can be used to steer DPRP behavior per-core.
User Overrides#
Managing the CPU frequency on Linux can be achieved by using the cpupower tool or directly through the sysfs interface. The next section provides information about the methods to set a fixed frequency and a scaling max frequency. Vera supports SMT, so the commands in the next section need to be run for each PE to take effect.
Note
User overrides will only work if HW DVFS is not enabled
Setting a Fixed Frequency#
This section provides information about setting a fixed frequency.
The cpupower tool
This command allows you to set a fixed frequency for all cores.
To manually set the frequency, switch to the userspace governor (if supported).
sudo cpupower frequency-set -g userspaceSet the frequency (for example, 3.2 GHz = 3200000 kHz).
sudo cpupower frequency-set -f 3200000
The sysfs method
Sysfs allows you to complete the following tasks:
Switch to the userspace governor (if supported).
$ echo userspace | sudo tee \
      /sys/devices/system/cpu/cpu*/cpufreq/scaling_governor
Set the frequency.
$ echo <desired frequency in kHz> | sudo tee \
      /sys/devices/system/cpu/cpu*/cpufreq/scaling_setspeed
Setting a Scaling Max Frequency#
This section provides information about setting a scaling max frequency.
The cpupower tool
Switch to performance governor to limit the max scaling frequency:
sudo cpupower frequency-set -g performanceSet the scaling max frequency (for example, 3.2 GHz = 3200000 kHz):
sudo cpupower frequency-set -u 3200000
The sysfs method
Switch to the performance governor (if supported).
$ echo performance | sudo tee \
      /sys/devices/system/cpu/cpu*/cpufreq/scaling_governor
Limit the maximum scaling frequency (replace [MAX_FREQUENCY] with desired value in kHz).
$ echo *[MAX_FREQUENCY]* | sudo tee \
      /sys/devices/system/cpu/cpu*/cpufreq/scaling_max_freq
The following table provides a list of the general CPU frequency commands to read the currently requested and measured settings.
Note
At least one PE in a core should be active to get an accurate frequency reading for that core.
Reading |
Command |
Notes |
|---|---|---|
Software requested frequency (kHz) for CPU core X |
|
|
Measured instantaneous frequency (kHz) for CPU core X |
|
Instantaneous readings are susceptible to error due to hardware clocks used to measure them. For accurate readings of CPU frequency, use the |
Measured average frequency (kHz) for CPU core X |
|
Reads of this node will fail if performed when the core is not active. Core activity is necessary in order to compute an accurate average frequency. |
Firmware-Based Dynamic Voltage and Frequency Scaling#
Vera supports firmware-based Dynamic Voltage and Frequency Scaling (DVFS) for some non-CPU system components. The system firmware monitors activity and adjusts their voltage and frequency.
Firmware-based DVFS is supported for the following components:
DRAM
UCF SLC
C2C Hub
These can be enabled per component through the UEFI menu by navigating to the following:
Vera Configuration ->
   Power and Performance ->
      Enable DRAM DVFS Manager
      Enable UCF SLC DVFS
      Enable C2CHUB DVFS Manager
Note
Currently, enabling DRAM DVFS and C2C Hub DVFS through UEFI has no effect. This functionality will be part of a future SBIOS release.
Performance Determinism Modes#
Performance Determinism Modes define power-provisioning mechanisms and are useful when uniform and deterministic behavior across parts matters more than absolute performance. Vera supports the following performance determinism modes that can be selected through the UEFI menu:
Vera Configuration ->
   Power and Performance ->
      Performance Determinism Mode ->
         Both Disabled (Legacy behavior)
         or
         Power Limit Scaling Only
         or
         Perf Determinism (Full mode)
Mode |
Description |
|---|---|
Both Disabled (Legacy behavior) |
Default. No frequency cap and no power-limit scaling. Highest peak performance but most possible variation. |
Power Limit Scaling only |
Enables power-limit scaling but leaves frequency uncapped. Normalizes power limit per part for predictable power/thermal behavior across all parts, while allowing cores to boost if there is headroom. System power budget is limited, so sustained performance might be lower than Legacy. |
Perf Determinism (Full mode) |
Frequencies and power-limits are both scaled. Frequency is limited so it can be achieved across all parts when power is not constrained, and power limits are scaled as described above. Provides the most repeatable performance and power across parts and is useful for performance guarantees at the cost of peak performance. |
Power and Thermal Management#
Vera provides the following types of thermal management support:
Limit power consumption to stay within the power limit.
Thermal sensor (Tj)-based management.
More information about these thermal management types is provided in the following sections.
Power Telemetry#
This section provides information about power telemetries for Vera and guidance to compare Vera power telemetry to x86 power telemetry.
Vera Power Telemetry#
Vera exposes power and related telemetry through hwmon, using the ACPI power meter interface. You can read this telemetry in the following ways:
Reading Power Telemetry#
To see hwmon sysfs nodes, set
CONFIG_SENSORS_ACPI_POWER=min your kconfig.To display the name of the power meter (telemetry name).
This provides information about which value is being reported by the hwmon node X.
cat /sys/class/hwmon/hwmonX/power1_oem_infoTo display the power stats interval in milliseconds, on hwmon node X:
cat /sys/class/hwmon/hwmonX/power1_average_intervalTo display average value over past interval on hwmon node X:`
cat /sys/class/hwmon/hwmonX/power1_averageTo change the interval in milliseconds, on hwmon node X:
echo <value in ms> | sudo tee /sys/class/hwmon/hwmonX/power1_average_intervalVera supports 50 ms (default) and 1000 ms averaging intervals for the hwmon nodes that report power. Other nodes are fixed at 50 ms.
To dump all available ACPI Power Meter telemetry:
for x in /sys/class/hwmon/hwmon*/power1_average; do \
    info=${x/power1_average/power1_oem_info}; \
    cat "$info" | tr '\n' ' '; \
    echo ": $x = $(cat "$x")"; \
done
Available Power Telemetries#
All telemetries are replicated per-socket. When read from hwmon, the name of each telemetry will include the socket it belongs to. All telemetries are replicated per-socket. When read from hwmon, the name of each telemetry will include the socket to which it belongs. The following table provides information about available power telemetries.
Type |
Hwmon Name |
Details |
|---|---|---|
Power |
Total Input Power in uW |
Total power of the socket. This includes Vera CPU power, SOCAMM power, and regulator loss. This is the Total CPU Power (TCP). This is the domain in which power capping is performed. |
Power |
AP Input Power in uW |
Total power of Vera including regulator loss. This includes the power consumed by all of its rails. This telemetry is not present on all platforms. |
Power |
AP Output Power (TDP) in uW |
Total power of Vera after regulator losses are removed. This is the TDP of Vera, and includes the power consumed by all of its rails. |
Power |
CPU Rail Input Power in uW |
CPU rail power, including regulator loss. This includes the power consumed by the Vera CPU Olympus Cores and the Scalable Coherency Fabric (SCF). |
Power |
SoC Rail Input Power in uW |
SoC rail power, including regulator loss This includes the power consumed by the Vera System Die. |
Power |
DRAM Input Power in uW |
DRAM power, including regulator loss This includes the power consumed by SOCAMM modules. |
Power |
CPU Rail Output Power in uW |
CPU rail power after regulator losses are removed. This includes the power consumed by the Vera CPU Olympus Cores and the SCF. |
Energy |
Total CPU Energy in uJ |
Energy consumed by CPU rail, including regulator losses |
Regulator Temperature |
CPUVDD Vtg Regulator Temperature in uC |
CPU rail regulator temperature |
Regulator Temperature |
SOCVDD Vtg Regulator Temperature in uC |
SoC rail regulator temperature |
Regulator Temperature |
MSSVDD Vtg Regulator Temperature in uC |
MSS rail regulator temperature |
Throttle Counter |
Chipthrot TCPc Throttle (samples x1000) |
Number of telemetry sampling windows (50 ms) where TCPc (continuous TCP) violations caused throttling to occur. |
Throttle Counter |
Chipthrot TJMAX Throttle (samples x1000) |
Number of telemetry sampling windows (50 ms) where TJMAX violations caused throttling to occur |
Throttle Counter |
Chipthrot TJAVG Throttle (samples x1000) |
Number of telemetry sampling windows (50 ms) where TJAVG violations caused throttling to occur |
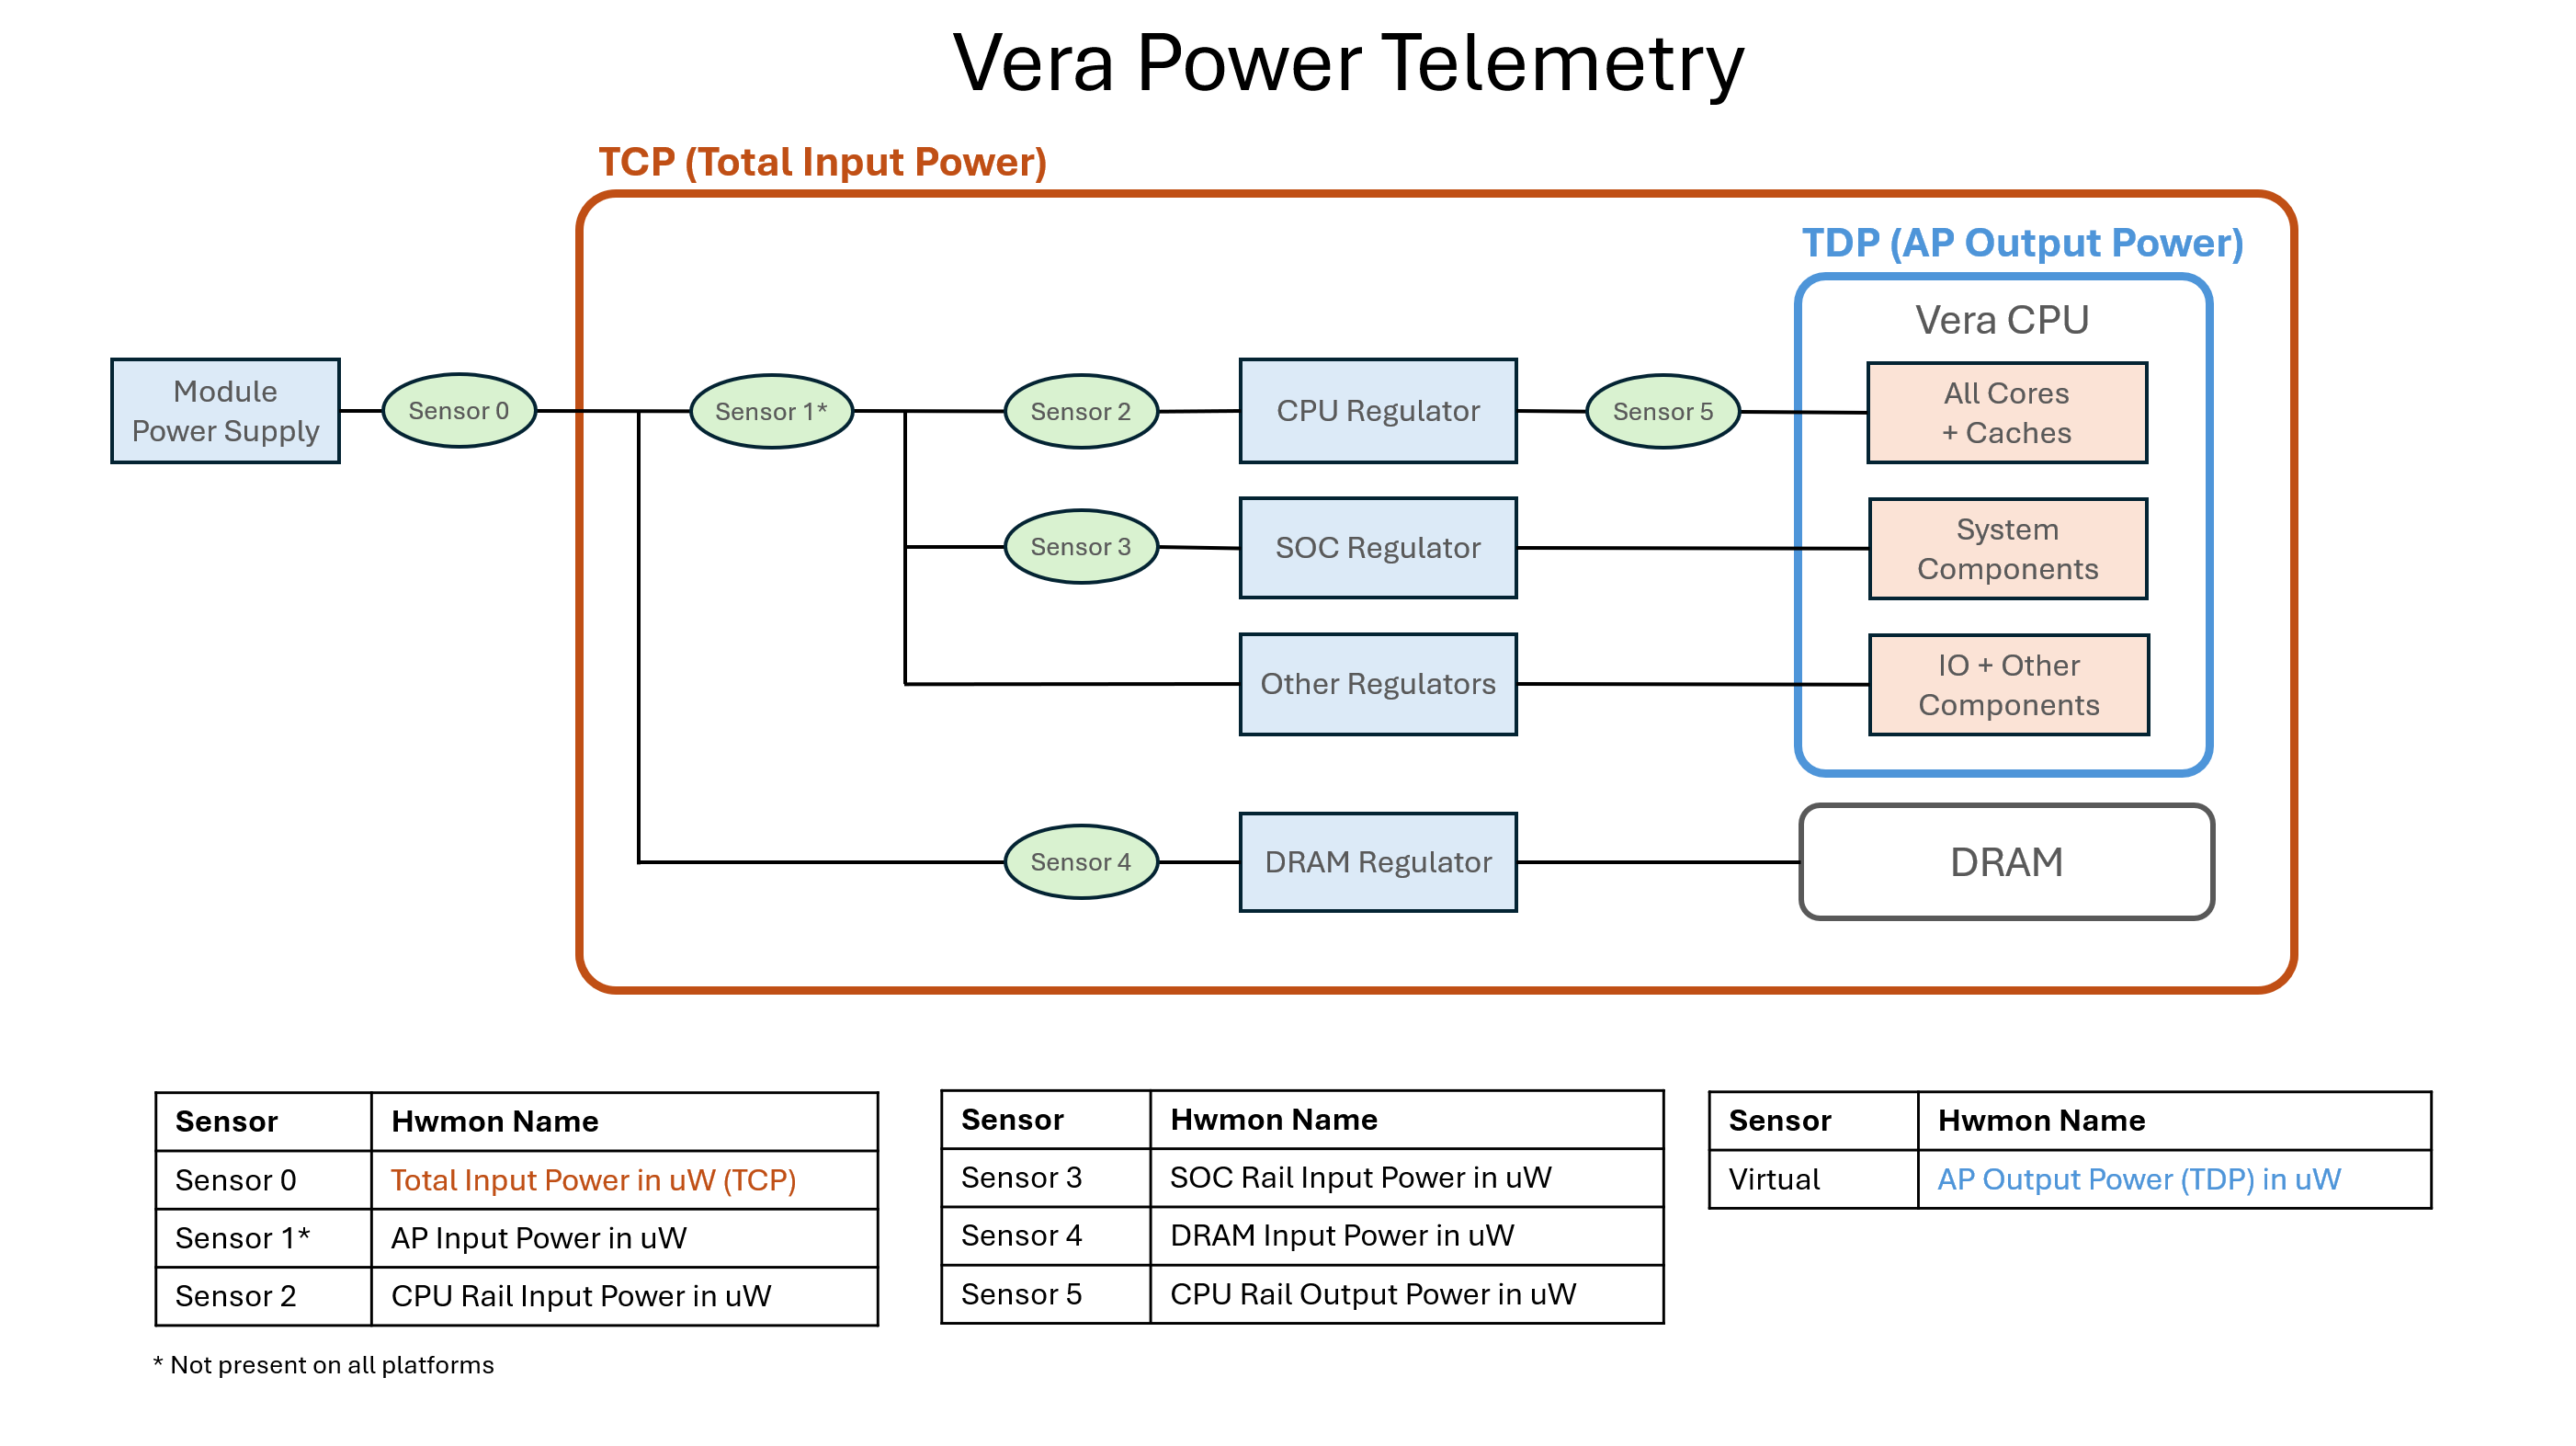
The following graphic shows the topology of power telemetry sensors on Vera:
Comparing Vera and x86 Power Telemetry#
Vera exposes many power telemetries that are comparable to telemetry that x86 exposes.
Note
x86 TDP is equivalent to the AP Output Power telemetry on Vera, so you can use this telemetry for comparisons to x86 TDP.
The following table can be used to map x86 telemetries to their Vera counterparts. References to any Sensors in this table can be resolved by referring to the diagram above (link).
x86 Power Term |
What the x86 term covers |
Vera Equivalent |
Where the Vera term comes from |
|---|---|---|---|
Processor Base Power / TDP (Intel PBP, AMD Default TDP MSR register) |
Package only: cores + uncore + IO. Excludes DRAM and board regulator losses. TDP is a thermal spec for x86, but it includes FIVR losses. |
AP Output power |
Power of Vera (TDP) as shown in the diagram above |
Core Power (Intel RAPL PP0 MSR register) |
Cores + caches only |
CPU Rail Output Power |
CPU Rail Output Power measured on Sensor 5 |
DRAM Power (RAPL DRAM domain) |
Off package DIMMs on the motherboard |
DRAM Input Power |
On-module LPDDR measured on Sensor 4 ; at the input of the regulator. |
No standard x86 term/sensors. Requires board instrumentation |
Power drawn by entire socket: die + DRAM + SOC/IO + regulator losses |
Total Input Power (TCP) |
Total CPU Power including CPU and DRAM measured at input of regulator on Sensor 0. This is what Vera specs and rack sizing are built on. |
Socket Power Cap (Intel PL1/PL2, AMD PPT) |
Enforced power limit on the package power domain |
TCP Cap |
Enforced on the Sensor 0 “module”/TCP domain - a larger domain than x86 PL1, so the number is larger. This is the TCP, which includes the CPU and DRAM measured at the input of the regulator. |
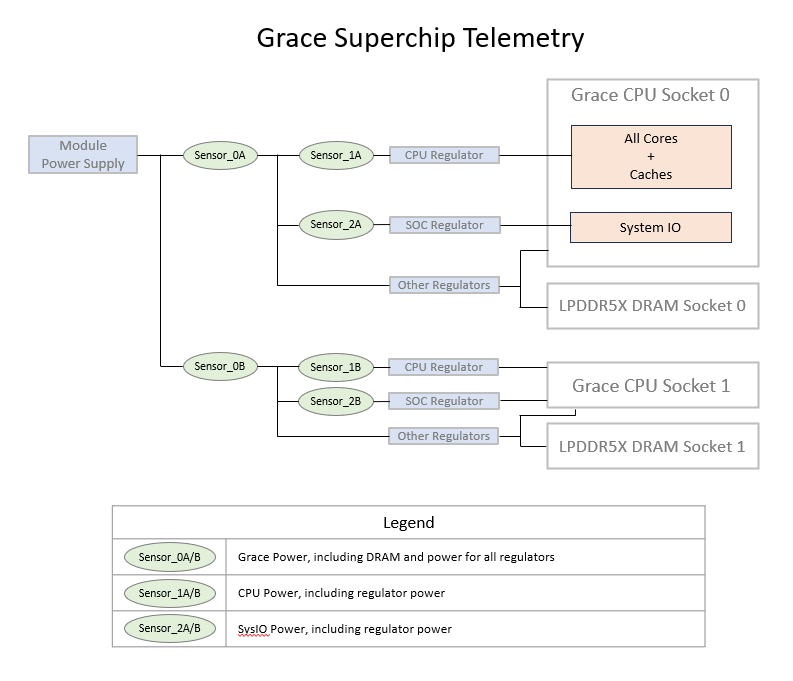
Comparing Vera and Grace Power Telemetry#
Vera and Grace expose power telemetry through the ACPI power meter interface, but the names of the telemetries are slightly different.
Telemetry name |
Description |
Grace power meter name |
Vera power meter name |
|---|---|---|---|
Module power |
Total power including CPU power, DRAM power, and regulator losses |
|
|
CPU rail input power |
CPU rail input power including regulator losses |
|
|
CPU rail output power |
CPU rail power after regulator losses are removed |
N/A |
|
SoC rail power |
SoC rail input power including regulator losses |
|
|
DRAM power |
Power consumed by DRAM, including regulator losses |
N/A |
|
Refer to the following Grace power sensor topology diagram for more information.
Using the Throttle and Energy Counters#
Vera’s energy and throttle counters provide insights into system behavior that cannot be achieved only through power metrics. The CPU energy counter can provide an accurate accounting system of energy consumed over time by providing snapshots of accumulated energy consumption. This counter can provide a picture of CPU power consumption without having to continuously sample the power meters.
Average power can be computed by taking energy snapshots before and after running a workload as follows (assuming the CPU energy counter is hwmon0):
cat /sys/class/hwmon/hwmon0/power1_average  # 3164784457000
stress-ng -c 150 -t 10 # run stress-ng CPU stressor on 150 cores, for 10 seconds
cat /sys/class/hwmon/hwmon0/power1_average  # 3169849339000
While this workload was running, the CPU consumed 3169849339000 uJ - 3164784457000 uJ = 5064882000 uJ = 5064.88 J,
which is an average of 5064.88 J / 10 s = 506.488 W over the 10s for which it ran.
The throttle counters provide insight into why a stressful workload’s performance might not be as high as expected. If the throttling conditions are met, power to the CPU will be reduced. The following example illustrates TCPc throttling (assuming hwmon2 is “Total Input Power in uW socket 0”, and hwmon0 is “Chipthrot TCPc Throttle (samples x1000) socket 0”):
cat /sys/class/hwmon/hwmon2/power1_cap      # 500000000 - system is power limited to 500 W
cat /sys/class/hwmon/hwmon0/power1_average  # 4454000 (4454)
stress-ng -c 150 -t 10                      # run stress-ng CPU stressor on 150 cores, for 10 seconds
cat /sys/class/hwmon/hwmon0/power1_average  # 4648000 (4648)
While this workload was running, 4648 - 4454 = 194 throttling events took place because of TCPc throttling. The number of “throttling events” is equal to the number of telemetry sampling windows (50 ms), where at least one throttling event occurred. This does not indicate any information about the depth or frequency of the throttling, only that it occurred.
Power Capping#
Power capping limits average power consumption and is usually set based on the thermal power dissipation capability of the system. On Vera, power capping is performed at the TCP level. When TCP (Sensor 0 reading, diagram link) exceeds the power cap, throttling is performed to maintain an average TCP within the power cap.
This setting is exposed through the TCP hwmon nodes (“Total Input Power in uW”), and users can reduce the power limit lower than the default value that was set in the BIOS.
Power capping can be applied only at the TCP level, not at the VDD_CPU or VDD_SOC levels.
To set power limit for socket N, run the following command:
echo <power value in micro Watts> > /sys/class/hwmon/hwmonX/power1_cap
where /sys/class/hwmon/hwmonX/power1_oem_info is “Total Input Power in uW socket N”.
Writes to this sysfs node are not persistent across reboots.
On Vera Rubin (CPU + GPU) systems, capping the Vera CPU power allows the Rubin GPU to draw more power. This can improve the performance of GPU-heavy applications.
CPU Temperature Management#
Thermal management (Tj) on Vera uses telemetry from temperature sensors to ensure that no local hotspots exceed the operating temperature. Power capping ensures that the average power of the socket/module is at or below the thermal capacity of the system. However, this does not account for asymmetric power distribution based on workload distribution across the cores.
On Vera, thermal management occurs in the hardware and firmware. Thermal controllers monitor temperature and perform throttling to ensure temperatures remain within acceptable operating range.
These operating ranges are used by the hardware and firmware and are not exposed to the OS.
ACPI does expose critical temperature limits for thermal zones. If the temperature of a thermal zone exceeds its critical limit, a shutdown is initiated.
Vera has the following thermal zones:
Thermal Zone Compute TJMax Socket 0: Max CPU temperature
Thermal Zone Compute TJAvg Socket 0: Average CPU temperature
Thermal Zone DRAM TJMax Socket 0: Max DRAM temperature
To read the critical limit of thermal zone N:
cat /sys/class/thermal/thermal_zoneN/trip_point_0_type

cat /sys/class/thermal/thermal_zoneN/trip_point_0_temp